57) In the diagram above, which igure(s) show(s) an inverse relationship between the
variables?
A) both B and C
B) only B
C) both A and C
D) only D
E) only C
Skill: Level 2: Using deinitions
Section: Chapter 1 Appendix – Checkpoint 2
Status: Old
AACSB: Analytical thinking
58) In the diagram above, which igure(s) show(s) no relationship between the variables?
A) both B and C
B) only B
C) both A and C
D) only D
E) both A and B
Skill: Level 2: Using deinitions
Section: Chapter 1 Appendix – Checkpoint 2
Status: Old
AACSB: Analytical thinking
59) If a curve rises and then falls, it has a
A) maximum.
B) minimum.
C) linear relationship.
D) constant slope relationship.
E) slope that is negative and then positive.
Skill: Level 1: Deinition
Section: Chapter 1 Appendix – Checkpoint 2
Status: Old
AACSB: Analytical thinking
71
60) As a shoe factory adds more workers, shoe production grows, reaches a maximum, and
then shrinks. In a diagram that has the number of workers on the horizontal axis and the
number of shoes on the vertical axis, the relationship between the number of workers and
the number of shoes starts as ________ and then, after the maximum point, is ________.
A) positive; negative
B) negative; positive
C) linear; negative
D) positive; linear
E) positive; nonexistent
Skill: Level 3: Using models
Section: Chapter 1 Appendix – Checkpoint 2
Status: Old
AACSB: Analytical thinking
61) As a curve approaches a maximum point, the slope will
A) be positive and then negative after the maximum point.
B) be negative and then positive after the maximum point.
C) remain constant on either side of the maximum point.
D) increase before and after the maximum point.
E) decrease before and after the maximum point.
Skill: Level 2: Using deinitions
Section: Chapter 1 Appendix – Checkpoint 2
Status: Old
AACSB: Analytical thinking
72
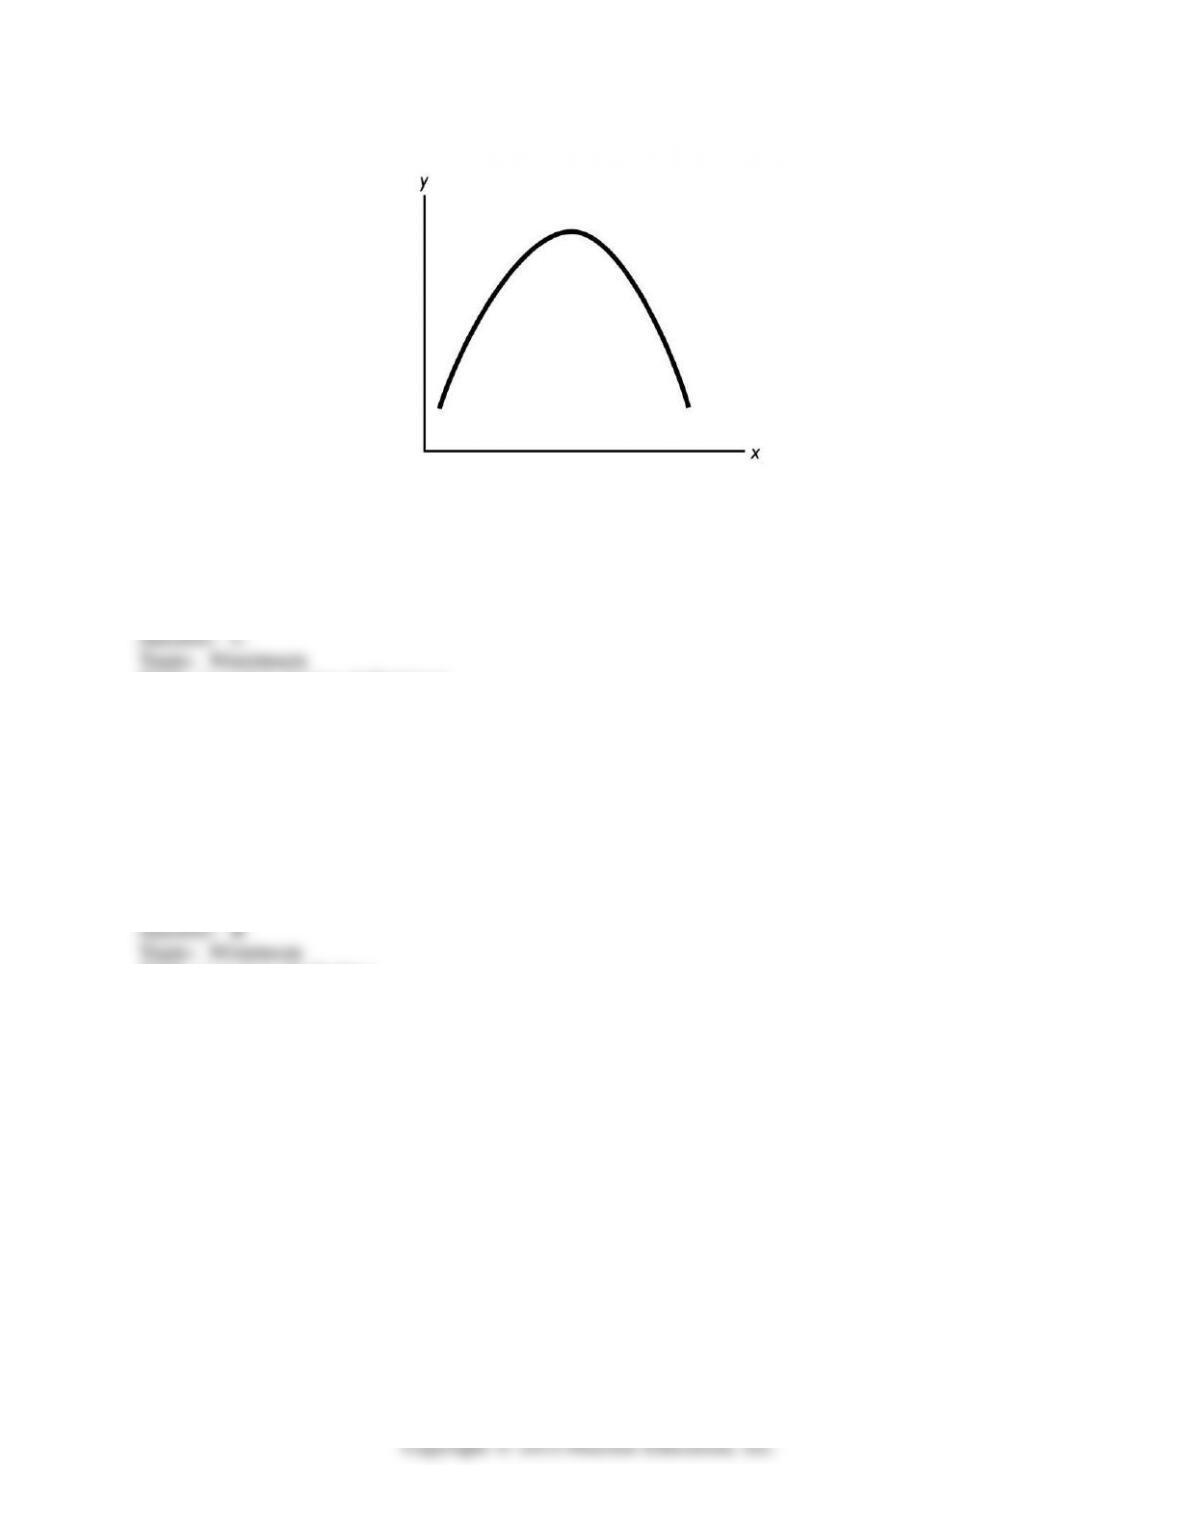
62) In the igure above, the relationship between the x variable and the y variable
A) is positive.
B) is negative.
C) starts by being positive and then becomes negative.
D) starts by being negative and then becomes positive.
E) is non-existent because the two variables are unrelated.
Skill: Level 2: Using deinitions
Section: Chapter 1 Appendix – Checkpoint 2
Status: Old
AACSB: Analytical thinking
63) If a curve falls and then rises, it
A) has a maximum.
B) has a minimum.
C) has a linear relationship.
D) has a constant slope relationship.
E) shows no relationship between the two variables.
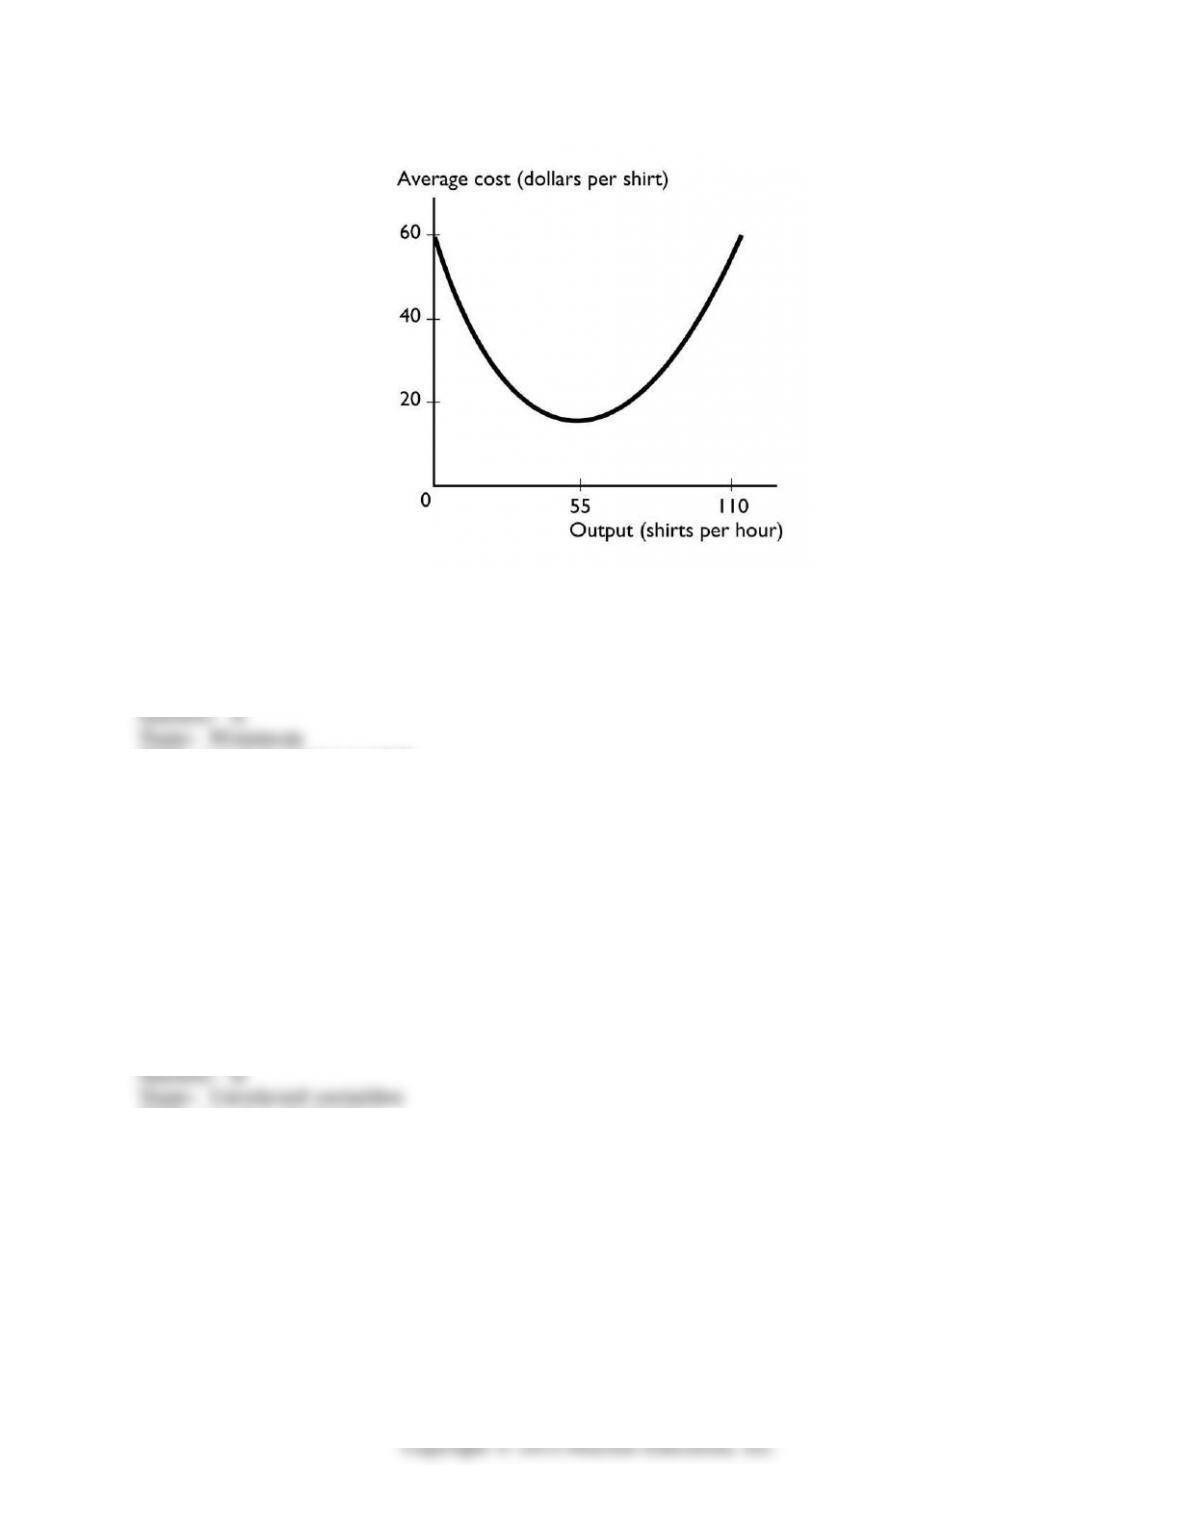
Skill: Level 1: Deinition
Section: Chapter 1 Appendix – Checkpoint 2
Status: Old
AACSB: Analytical thinking
73
64) Moving from left to right, a U-shaped curve starts with a
A) positive slope, reaches a maximum, then ends with a negative slope.
B) positive slope, reaches a minimum, then ends with a negative slope.
C) negative slope, reaches a maximum, then ends with a positive slope.
D) negative slope, reaches a minimum, then ends with a positive slope.
E) negative slope, reaches a minimum, then ends with a negative slope.
Skill: Level 2: Using deinitions
Section: Chapter 1 Appendix – Checkpoint 2
Status: Old
AACSB: Analytical thinking
65) The minimum point of a U-shaped curve
A) is a point where the variable is neither increasing nor decreasing.
B) has a slope equal to zero.
C) has the maximum slope possible.
D) Both answers A and B are correct.
E) Both answers A and C are correct.
Skill: Level 1: Deinition
Section: Chapter 1 Appendix – Checkpoint 2
Status: Old
AACSB: Analytical thinking
66) An economist observed that as more computers are added to a factory, the costs of
production initially decline, reach a minimum, and then rise. In a diagram that has costs on
the vertical axis and the number of computers on the horizontal axis, the relationship
always is
A) negative and then linear after the minimum point.
B) positive and then negative after the minimum point.
C) negative and then positive after the minimum point.
D) linear and then positive after the minimum point.
E) negative both before and after the minimum point.
Skill: Level 3: Using models
Section: Chapter 1 Appendix – Checkpoint 2
Status: Old
AACSB: Analytical thinking
74
67) If whenever one variable increases, another variable also increases, then these two
variables are ________ related.
A) positively
B) negatively
C) inversely
D) cross-sectionally
E) trend-line
Skill: Level 1: Deinition
Section: Chapter 1 Appendix – Checkpoint 2
Status: Old
AACSB: Analytical thinking
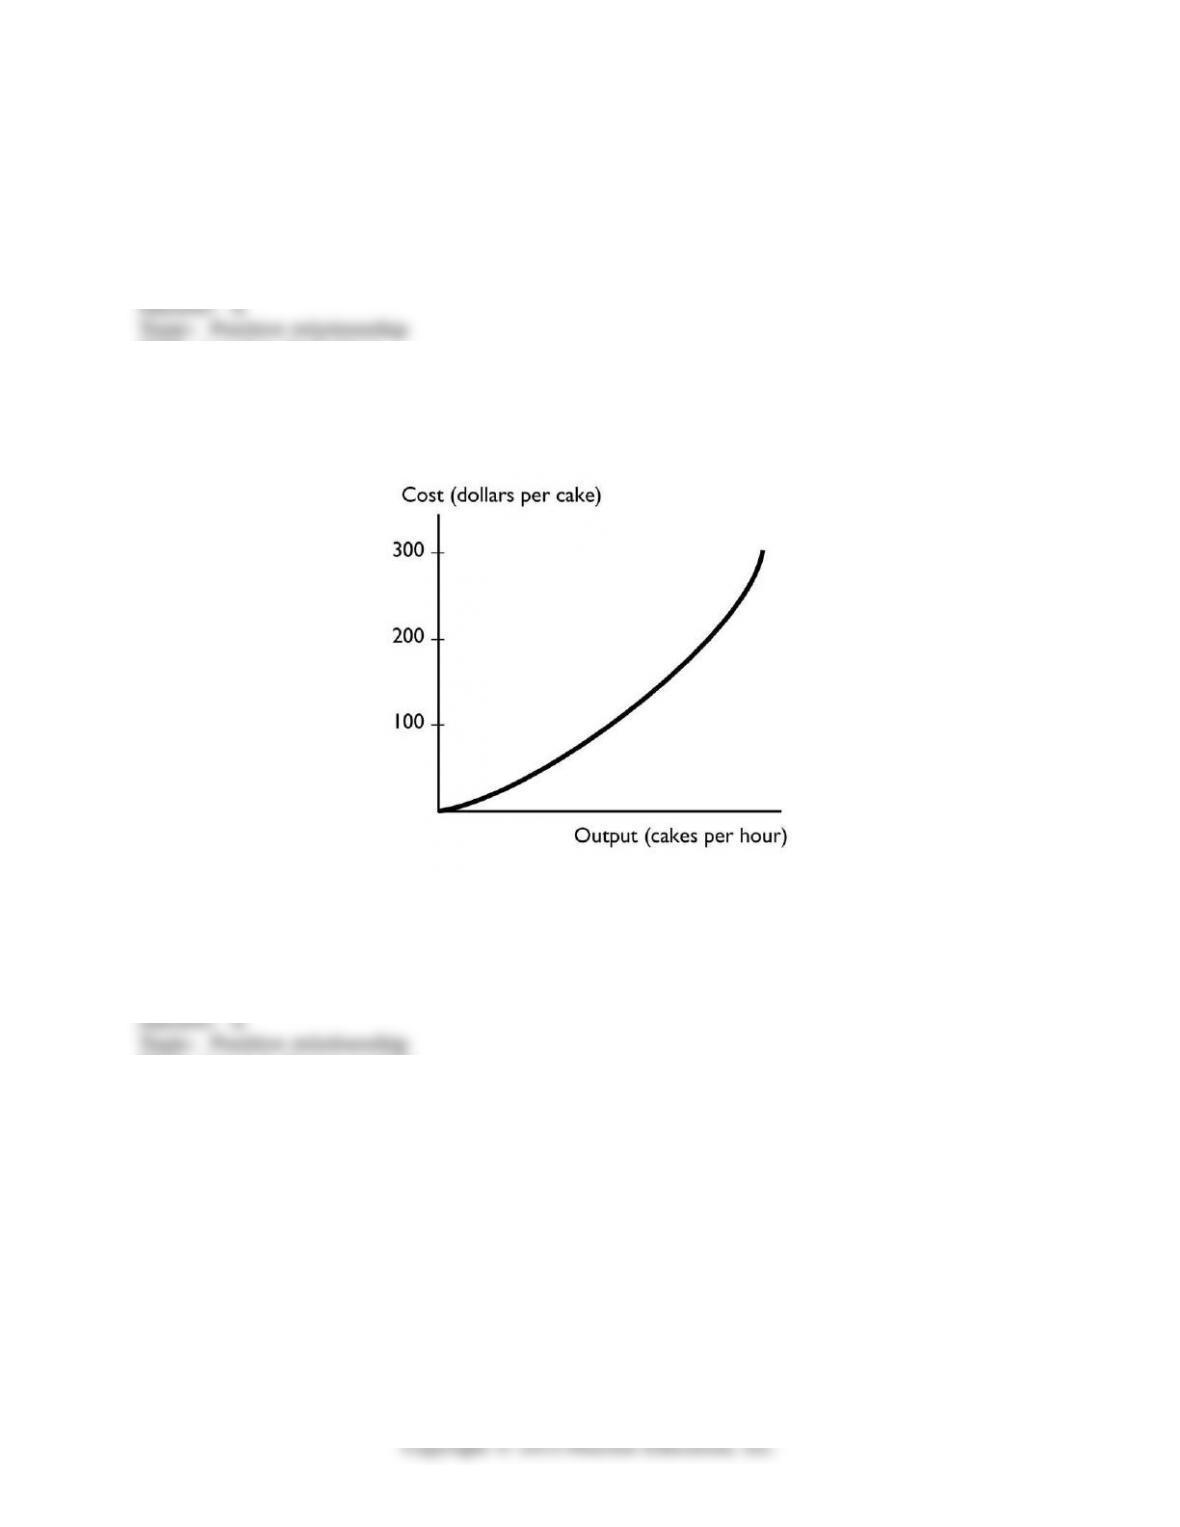
68) The graph shows a
A) positive relationship that becomes steeper.
B) negative relationship that becomes steeper.
C) positive relationship that becomes less steep.
D) negative relationship that become less steep.
E) negative trend between the total cost of a cake and the output of cakes.
Skill: Level 3: Using models
Section: Chapter 1 Appendix – Checkpoint 2
Status: Old
AACSB: Analytical thinking
75
69) A graph of the relationship between two variables is a line that slopes down to the
right. These two variables are ________ related.
A) positively
B) directly
C) negatively
D) not
E) trend-line
Skill: Level 1: Deinition
Section: Chapter 1 Appendix – Checkpoint 2
Status: Old
AACSB: Analytical thinking
70) A graph shows that the number of U.S. tourists visiting a Caribbean island increases as
the temperature in the northeastern United States falls. The graph shows
A) a positive relationship.
B) a direct relationship.
C) a negative relationship.
D) no relationship.
E) an invalid relationship.
Skill: Level 1: Deinition
Section: Chapter 1 Appendix – Checkpoint 2
Status: Old
AACSB: Analytical thinking
76
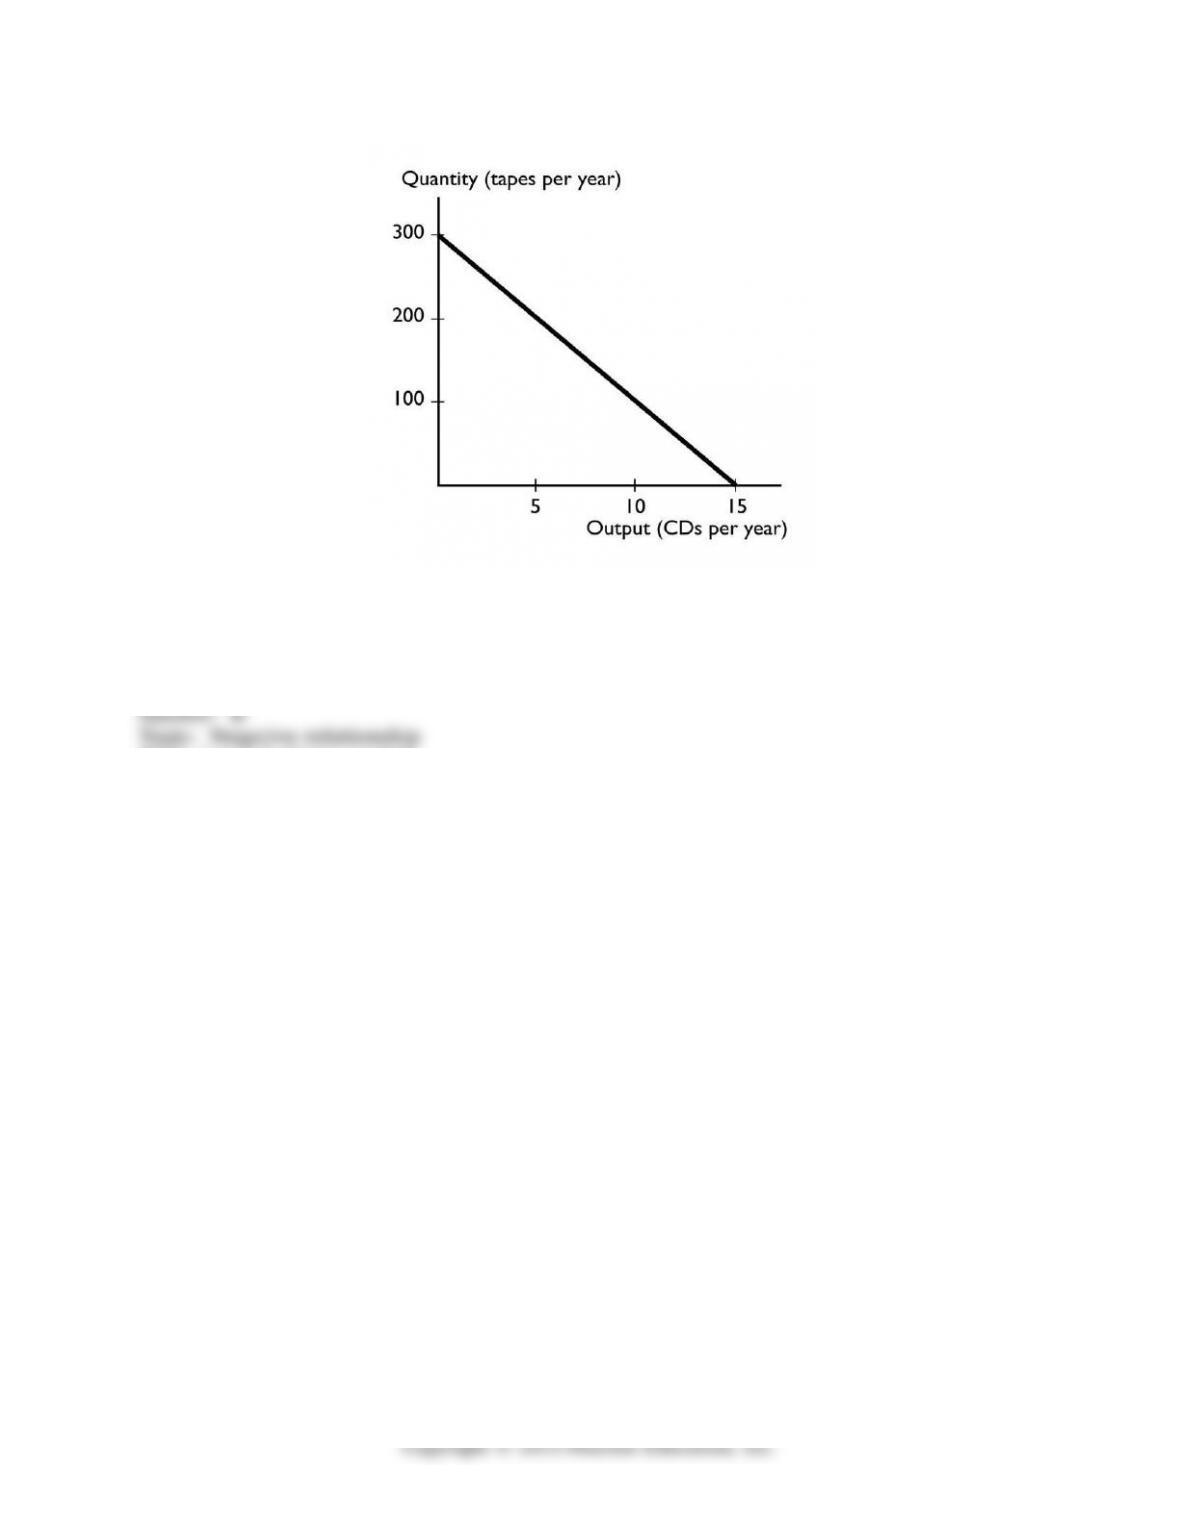
71) The graph shows a
A) positive relationship that becomes less steep.
B) negative relationship that is linear.
C) positive relationship that is linear.
D) negative relationship that become less steep.
E) None of the above answers is correct.
Skill: Level 3: Using models
Section: Chapter 1 Appendix – Checkpoint 2
Status: Old
AACSB: Analytical thinking
77
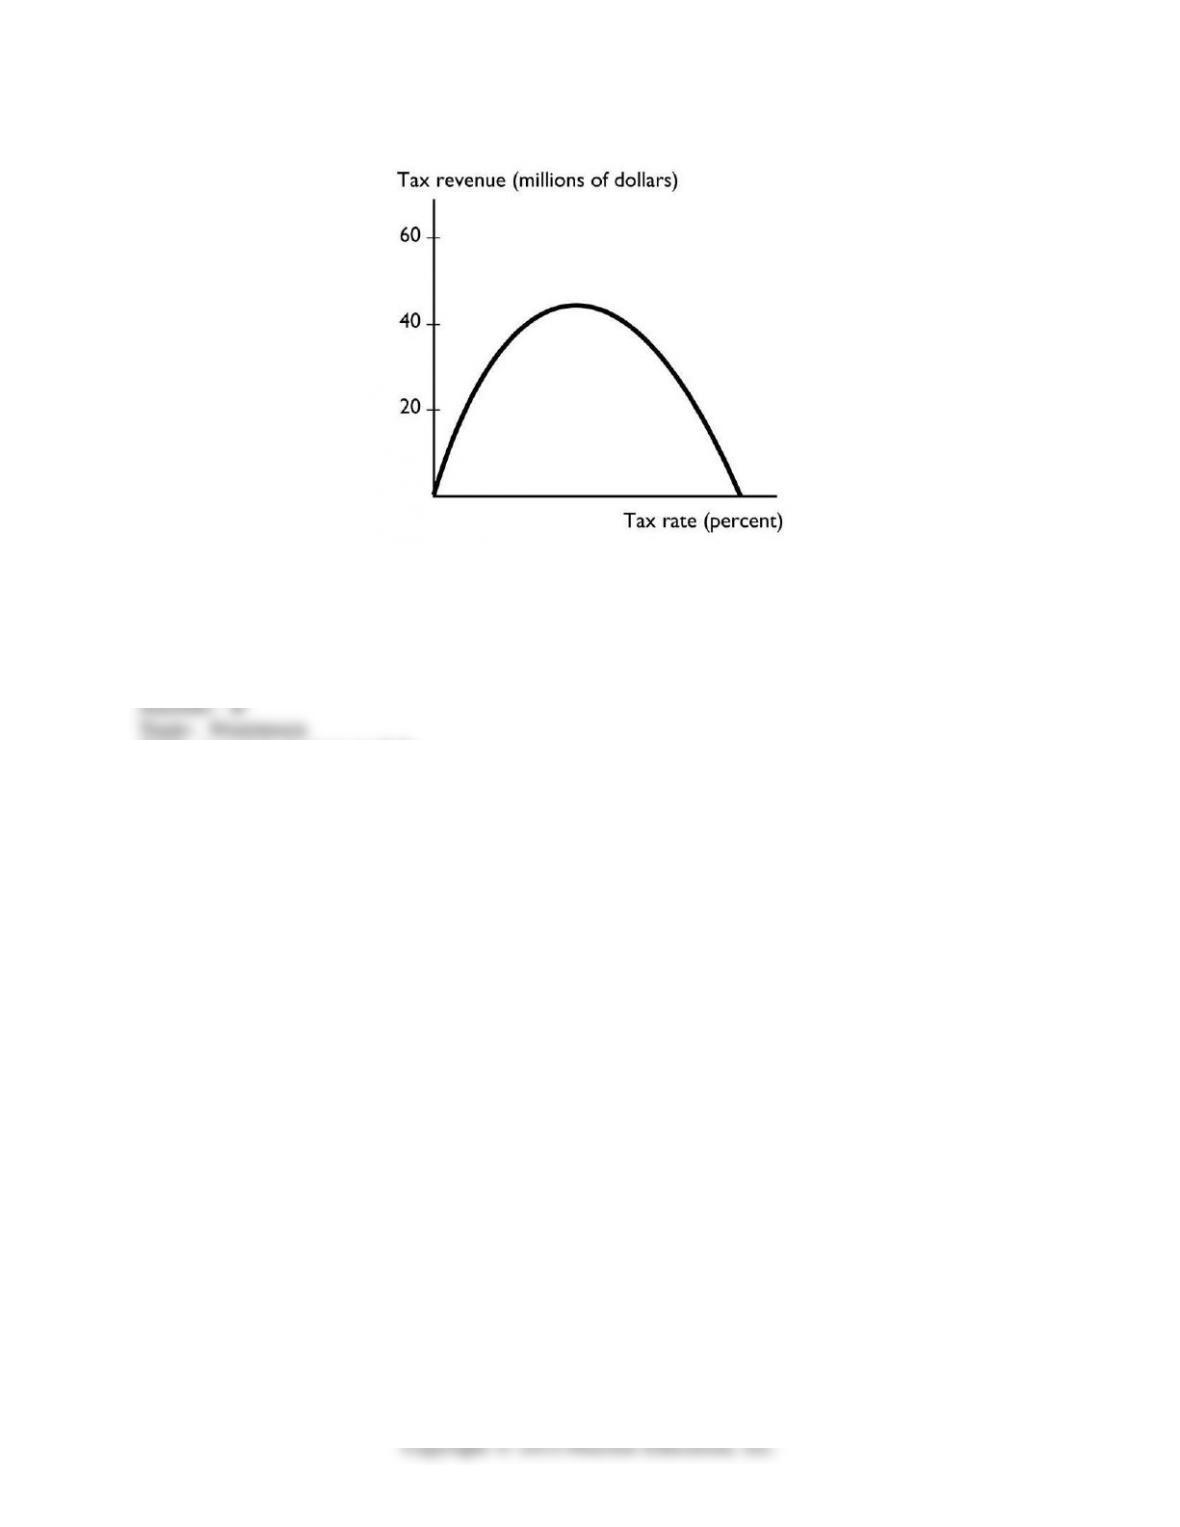
72) The graph shows
A) a relationship with a minimum.
B) a relationship with a maximum.
C) no relationship.
D) a linear relationship.
E) a cross-section relationship.
Skill: Level 3: Using models
Section: Chapter 1 Appendix – Checkpoint 2
Status: Old
AACSB: Analytical thinking
78
73) The graph shows
A) a relationship with a minimum.
B) a relationship with a maximum.
C) no relationship.
D) a relationship that becomes less steep.
E) a cross-section relationship.
Skill: Level 3: Using models
Section: Chapter 1 Appendix – Checkpoint 2
Status: Old
AACSB: Analytical thinking
74) Two variables are unrelated if their graph is
i. a vertical line.
ii. a 45 degree line.
iii. a horizontal line.
A) i only
B) ii only
C) iii only
D) i and iii
E) i, ii, and iii
Skill: Level 1: Deinition
Section: Chapter 1 Appendix – Checkpoint 2
Status: Old
AACSB: Analytical thinking
79
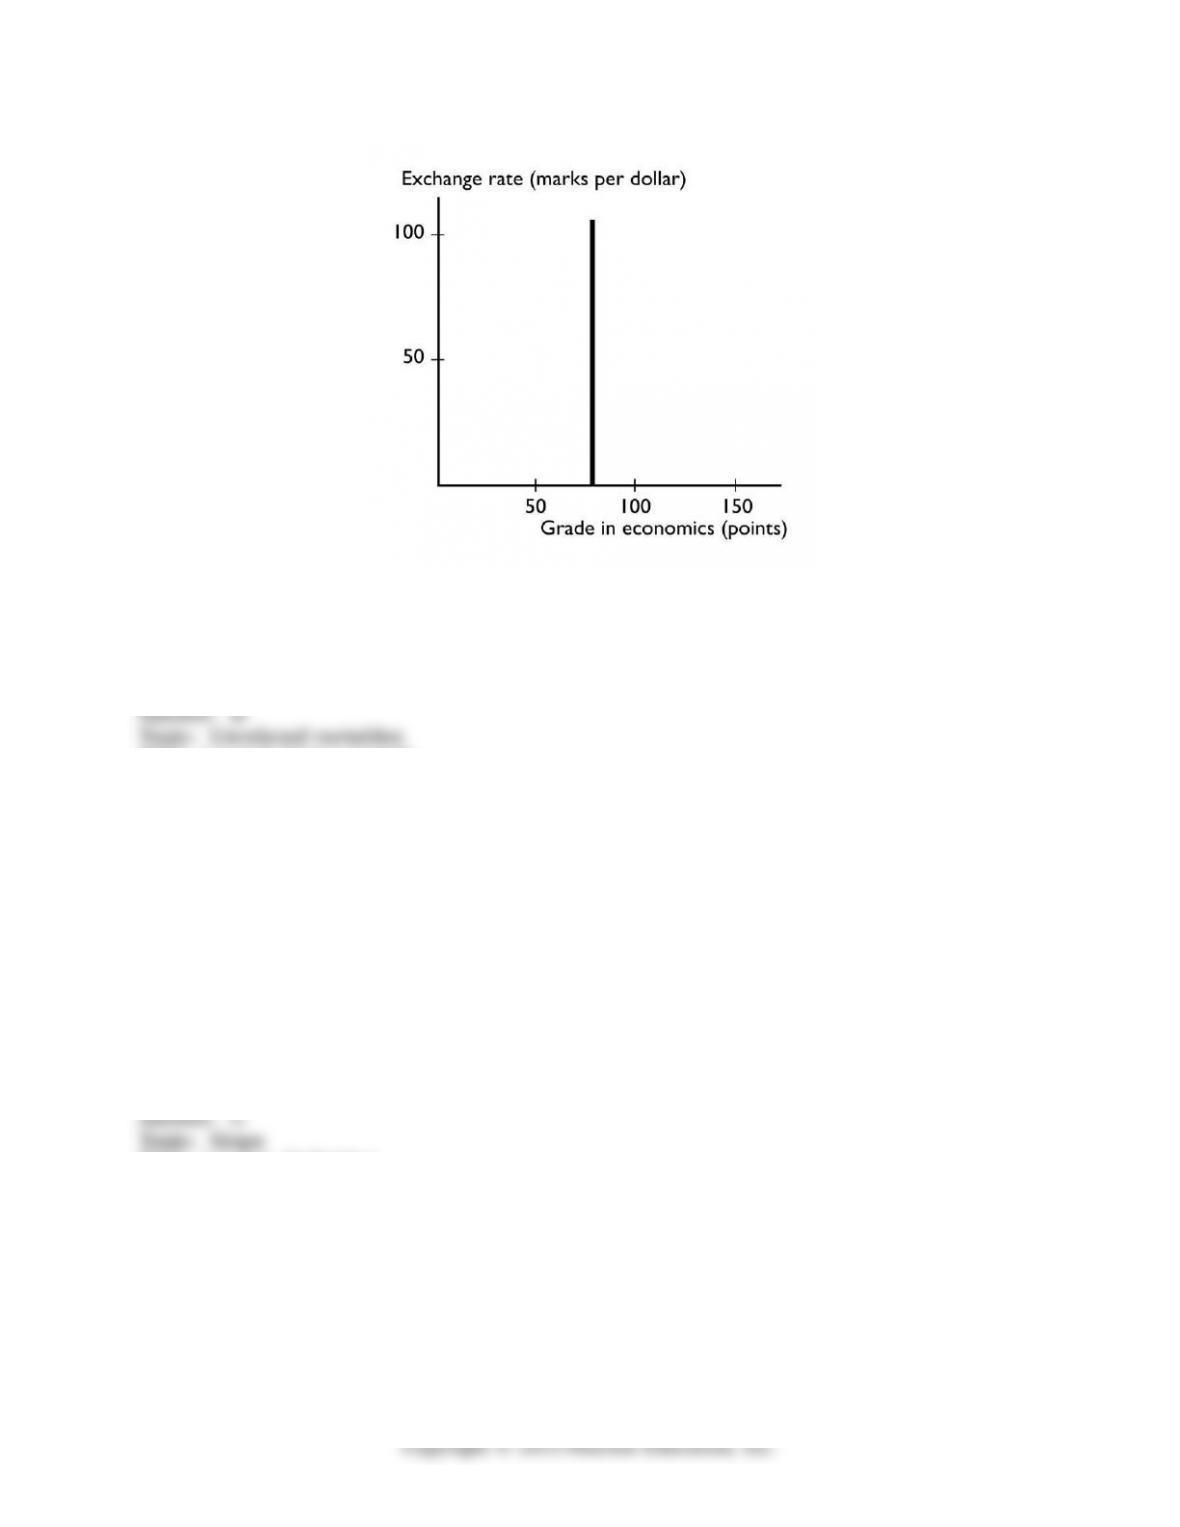
75) The graph shows
A) a positive relationship that becomes less steep.
B) a negative relationship that is linear.
C) a positive relationship that is linear.
D) no relationship between the variables.
E) a trend relationship between the variables.
Skill: Level 3: Using models
Section: Chapter 1 Appendix – Checkpoint 2
Status: Old
AACSB: Analytical thinking
76) A slope is measured as the
A) value of the variable measured on the y-axis divided by the value of the variable
measured on the x-axis.
B) value of the variable measured on the x-axis divided by the value of the variable
measured on the y-axis.
C) change in the value of variable on the y-axis divided by the change in the value of the
variable on the x-axis.
D) value of the variable measured on the y-axis minus the value of the variable measured
on the x-axis.
E) change in the value of variable on the x-axis divided by the change in the value of the
variable on the y-axis.
Skill: Level 1: Deinition
Section: Chapter 1 Appendix – Checkpoint 3
Status: Old
AACSB: Analytical thinking
80