36) As a person increases his or her caloric intake, the person’s weight increases, ceteris
paribus. The relationship between the person’s caloric intake and the person’s weight is an
example of
A) unrelated variables.
B) a positive relationship.
C) a negative relationship.
D) a single point on a graph.
E) a trended relationship.
Skill: Level 2: Using deinitions
Section: Chapter 1 Appendix – Checkpoint 2
Status: Old
AACSB: Analytical thinking
37) If there is a positive relationship between two variables,
A) the graph of the relationship will be upward sloping.
B) the graph of the relationship will be downward sloping.
C) the slope of the line graphing the relationship will be negative.
D) Both answers A and C are correct.
E) Both answers B and C are correct.
Skill: Level 2: Using deinitions
Section: Chapter 1 Appendix – Checkpoint 2
Status: Old
AACSB: Analytical thinking
38) If the change in y = 10 and the change in x = 3, there is
A) a positive relationship between y and x.
B) a negative relationship between y and x.
C) an independent relationship between y and x.
D) no relationship between y and x.
E) a +0.33 relationship between the two variables.
Skill: Level 2: Using deinitions
Section: Chapter 1 Appendix – Checkpoint 2
Status: Old
AACSB: Analytical thinking
61
39) Whenever people’s incomes increase, they buy more guitars. Hence a scatter diagram
shows that the relationship between income and guitars purchased is
A) a positive relationship.
B) a linear relationship.
C) a negative relationship.
D) some sort of relationship, but whether it is positive or negative depends on whether
income is plotted on the vertical or horizontal axis.
E) a U-shaped relationship.
Skill: Level 2: Using deinitions
Section: Chapter 1 Appendix – Checkpoint 2
Status: Old
AACSB: Analytical thinking
40) Which of the following statements is correct?
A) When a line slopes downwards moving to the right, the variable measured on the x-axis
and the variable measured on the y-axis are directly related.
B) When a line slopes upwards moving to the right, the variable measured on the x-axis and
the variable measured on the y-axis are directly related.
C) The higher the temperature, the more ice cream people consume. Thus the temperature
and ice cream consumption are inversely related.
D) If two variables are directly related, a graph of the two variables has a negative slope.
E) None of the above statements is correct.
Skill: Level 1: Deinition
Section: Chapter 1 Appendix – Checkpoint 2
Status: Old
AACSB: Analytical thinking
41) If x increases whenever y decreases, then x and y are
A) not related.
B) positively related.
C) directly related.
D) negatively related.
E) related but whether positively or negatively related depends on whether the x variable
or the y variable is plotted on the vertical axis.
Skill: Level 1: Deinition
Section: Chapter 1 Appendix – Checkpoint 2
Status: Old
AACSB: Analytical thinking
62
42) Whenever one variable increases, another variable decreases. The two variables are
A) deinitely related through a third variable.
B) negatively related.
C) positively related.
D) unrelated to each other.
E) related but whether positively or negatively related depends on which variable is plotted
on the vertical axis.
Skill: Level 1: Deinition
Section: Chapter 1 Appendix – Checkpoint 2
Status: Old
AACSB: Analytical thinking
43) If x increases and as a result y decreases, then x and y are
A) not related because the relationship is a causal one.
B) positively related.
C) negatively related.
D) directly related.
E) trend-line related.
Skill: Level 1: Deinition
Section: Chapter 1 Appendix – Checkpoint 2
Status: Old
AACSB: Analytical thinking
44) “As the price of gasoline increases, fewer people buy cars that are gas guzzlers.” A
graph showing this relationship would
A) have a negative slope.
B) have a positive relationship.
C) have a direct relationship.
D) be a horizontal line.
E) be a vertical line.
Skill: Level 2: Using deinitions
Section: Chapter 1 Appendix – Checkpoint 2
Status: Old
AACSB: Analytical thinking
63
45) As the number of days without rain increases, the amount of wheat grown per acre
declines. A graph showing this relationship shows
A) a horizontal line.
B) a vertical line.
C) a positive relationship.
D) a line with a positive slope.
E) None of the above answers is correct.
Skill: Level 2: Using deinitions
Section: Chapter 1 Appendix – Checkpoint 2
Status: Old
AACSB: Analytical thinking
46) As the price of home heating oil rises, families buy less home heating oil. Hence a
scatter diagram with the price of home heating oil on the vertical axis and the quantity
purchased on the horizontal axis reveals a ________ relationship.
A) positive
B) linear
C) time-series
D) negative
E) cross-sectional
Skill: Level 2: Using deinitions
Section: Chapter 1 Appendix – Checkpoint 2
Status: Old
AACSB: Analytical thinking
47) If the change in y = -4 and the change in x = 2, there is
A) an independent relationship between y and x.
B) a positive relationship between y and x.
C) a negative relationship between y and x.
D) no relationship between y and x.
E) a relationship between x and y but more information is needed to determine if it is a
negative or positive relationship.
Skill: Level 2: Using deinitions
Section: Chapter 1 Appendix – Checkpoint 2
Status: Old
AACSB: Analytical thinking
64

48) An independent relationship between two variables is shown in a graph by
A) an upward-sloping line.
B) a horizontal or a vertical line.
C) a downward-sloping line.
D) a steeply sloped line.
E) any straight line curve.
Skill: Level 1: Deinition
Section: Chapter 1 Appendix – Checkpoint 2
Status: Old
AACSB: Analytical thinking
49) If two variables are unrelated, their graph is
A) either a horizontal or a vertical line.
B) a downward-sloping line.
C) an upward-sloping line.
D) a curved line.
E) None of the above answers is correct because it is not possible to graph unrelated
variables.
Skill: Level 1: Deinition
Section: Chapter 1 Appendix – Checkpoint 2
Status: Old
AACSB: Analytical thinking
50) Consider a diagram in which the variable measured on the y-axis remains constant
while the variable measured on the x-axis increases. The graph of these two variables is
A) a vertical line.
B) a horizontal line.
C) a line that has positive slope.
D) a line that has a negative slope.
E) non-existent because the two variables are not related.
Skill: Level 2: Using deinitions
Section: Chapter 1 Appendix – Checkpoint 2
Status: Old
AACSB: Analytical thinking
65
51) A graph shows the price of a pound of cucumbers on the vertical axis and the quantity
of new cars sold by Honda on the horizontal axis. The price of a pound of cucumbers
remains constant as the quantity of new cars sold increases. The graph of these data is a
A) horizontal line.
B) vertical line.
C) curve with a maximum.
D) positively sloped line.
E) negatively sloped line.
Skill: Level 2: Using deinitions
Section: Chapter 1 Appendix – Checkpoint 2
Status: Old
AACSB: Analytical thinking
52) Matt pays a $50 a month membership fee at Bruno’s Gym. He can exercise at the gym
as many times as he wishes. If the membership fee is measured along the vertical axis and
the number of times he exercises is measured along the horizontal axis, the graph between
his membership fee and the number of times he exercises will
A) be a horizontal line.
B) be positively sloped.
C) be negatively sloped.
D) be a vertical line.
E) start out positively sloped and then, as Matt loses interest, become negatively sloped.
Skill: Level 3: Using models
Section: Chapter 1 Appendix – Checkpoint 2
Status: Old
AACSB: Analytical thinking
66
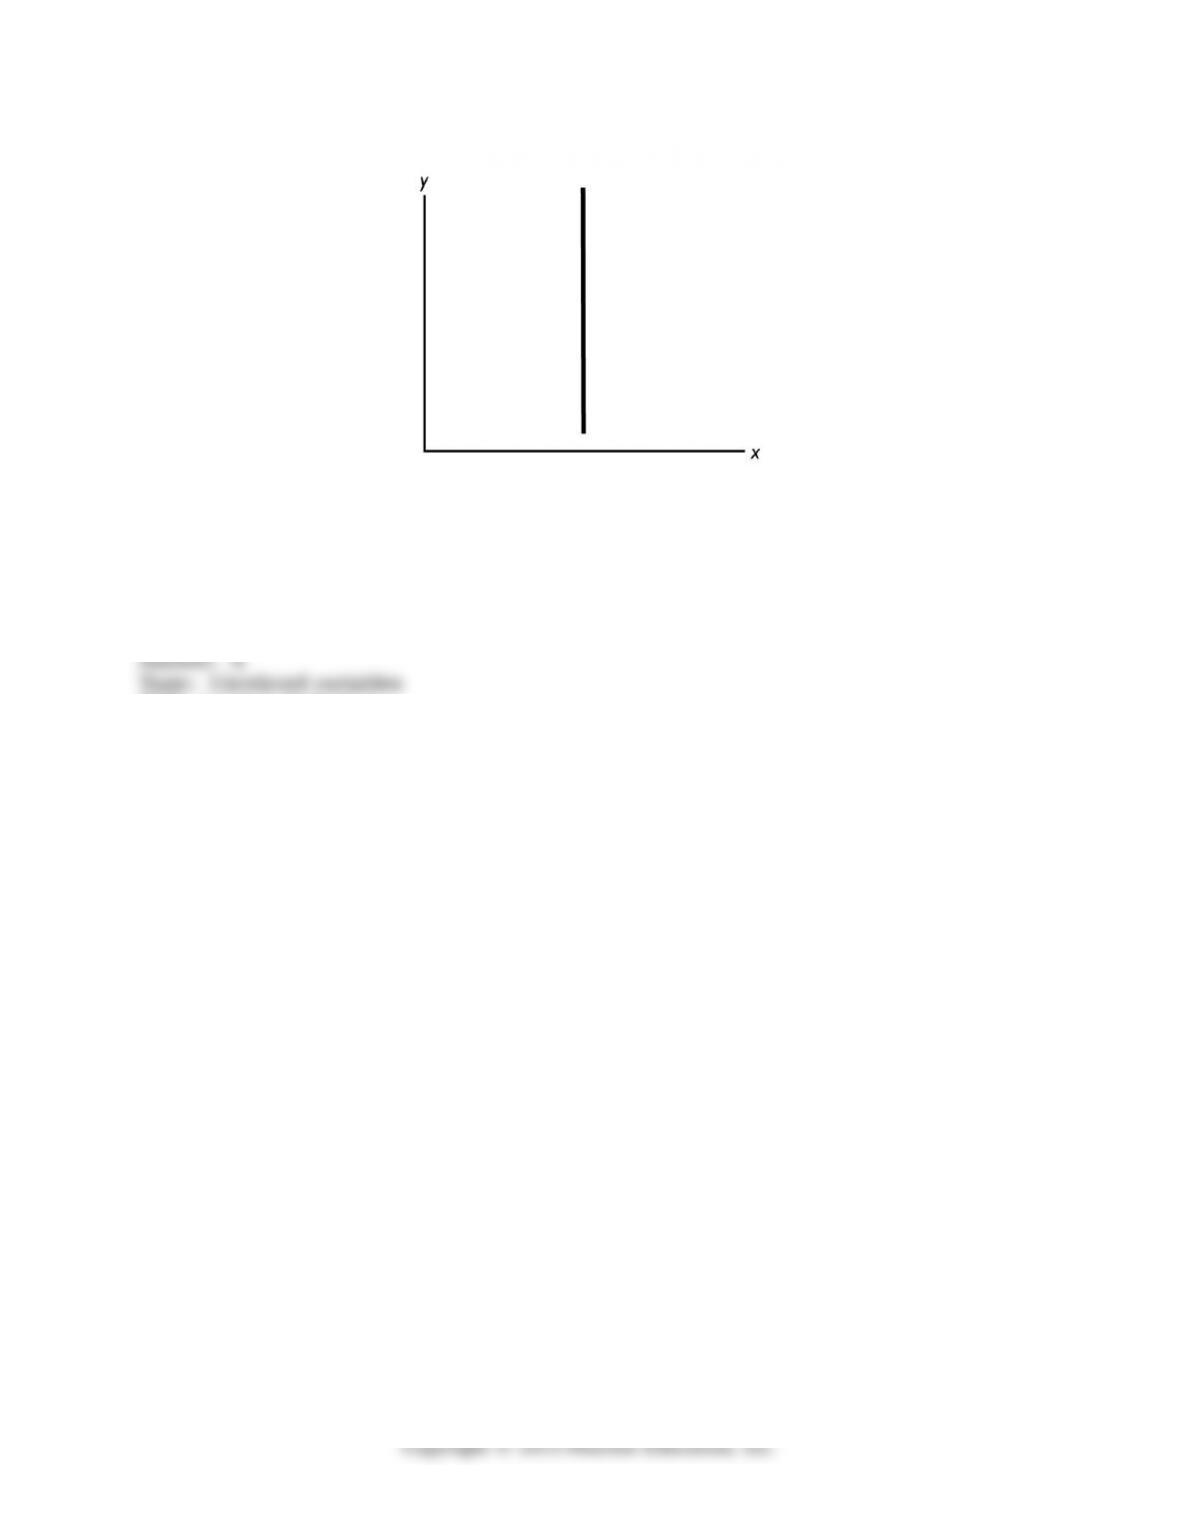
53) In the above igure, as the y variable increases,
A) the x variable is constant.
B) the x variable increases.
C) the x variable decreases.
D) the x variable at irst increases but then decreases.
E) the x variable probably changes, but more information is needed to determine if it
increases, decreases, or stays the same.
Skill: Level 1: Deinition
Section: Chapter 1 Appendix – Checkpoint 2
Status: Old
AACSB: Analytical thinking
67
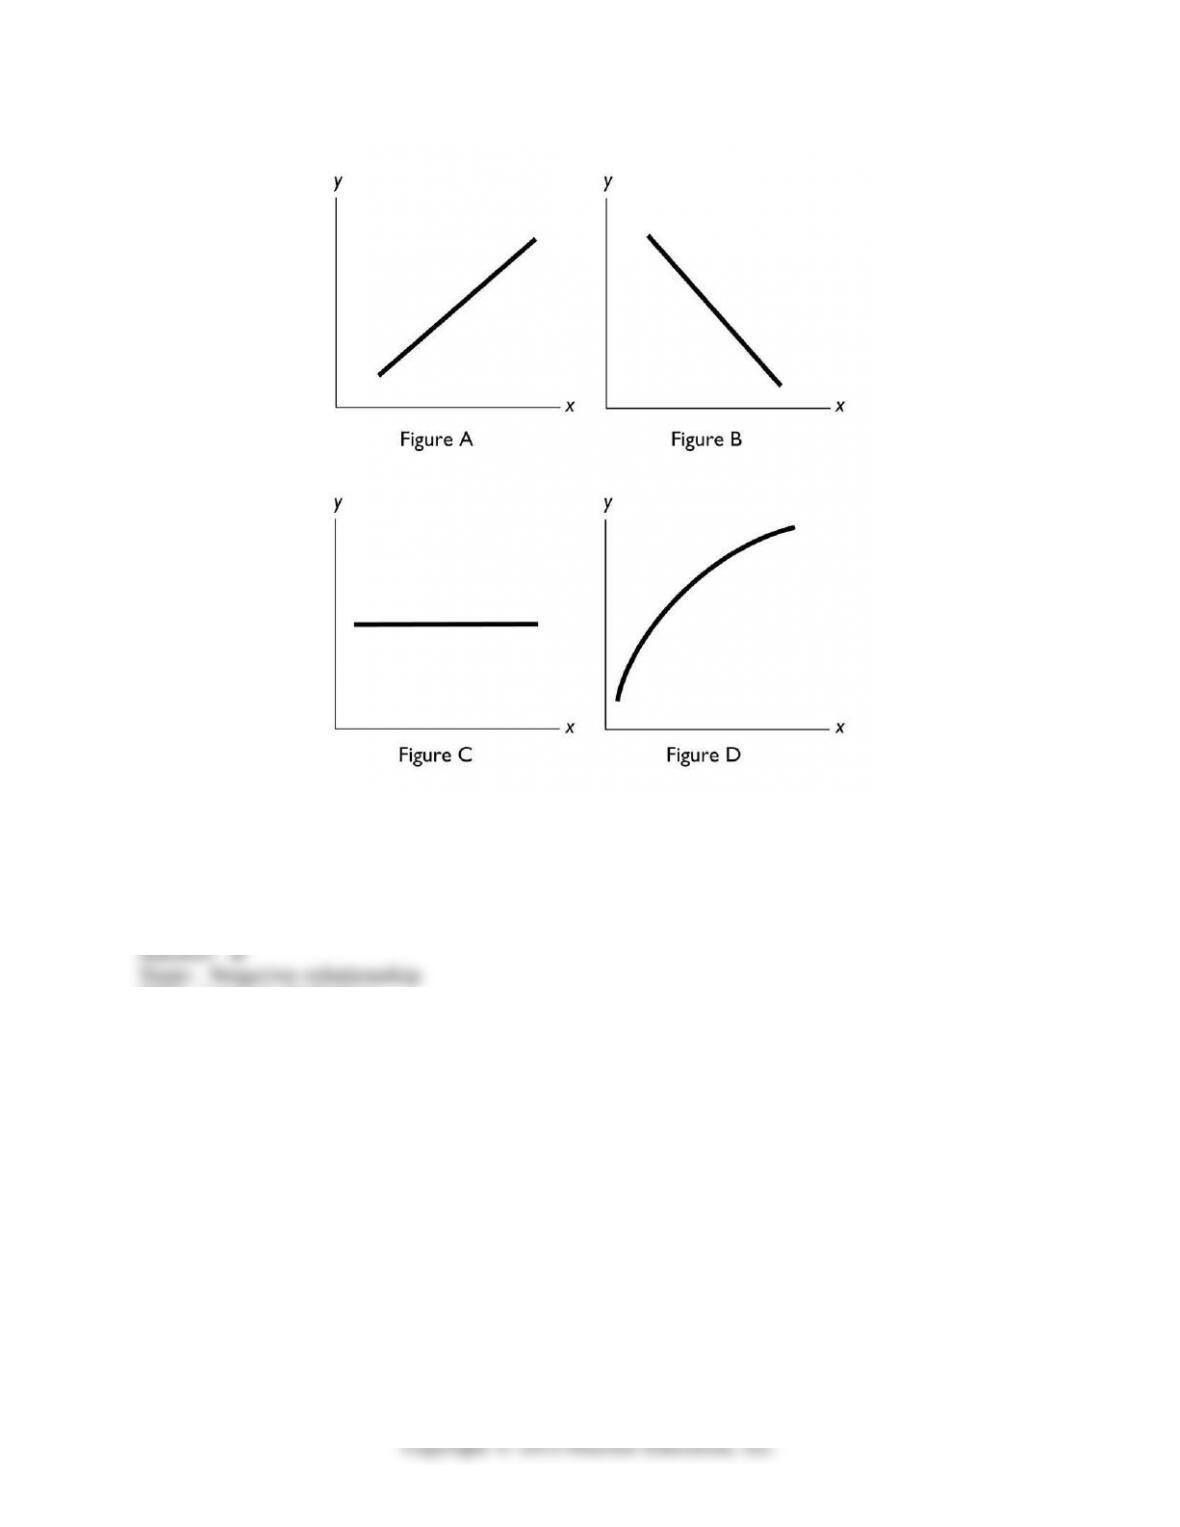
54) In the above igure, a negative relationship between x and y is shown in Figure
A) A.
B) B.
C) C.
D) D.
E) B and Figure C.
Skill: Level 1: Deinition
Section: Chapter 1 Appendix – Checkpoint 2
Status: Old
AACSB: Analytical thinking
68

55) In the above igure, no relationship between x and y is shown in Figure
A) A.
B) B.
C) C.
D) D.
E) A and Figure B.
Skill: Level 1: Deinition
Section: Chapter 1 Appendix – Checkpoint 2
Status: Old
AACSB: Analytical thinking
69
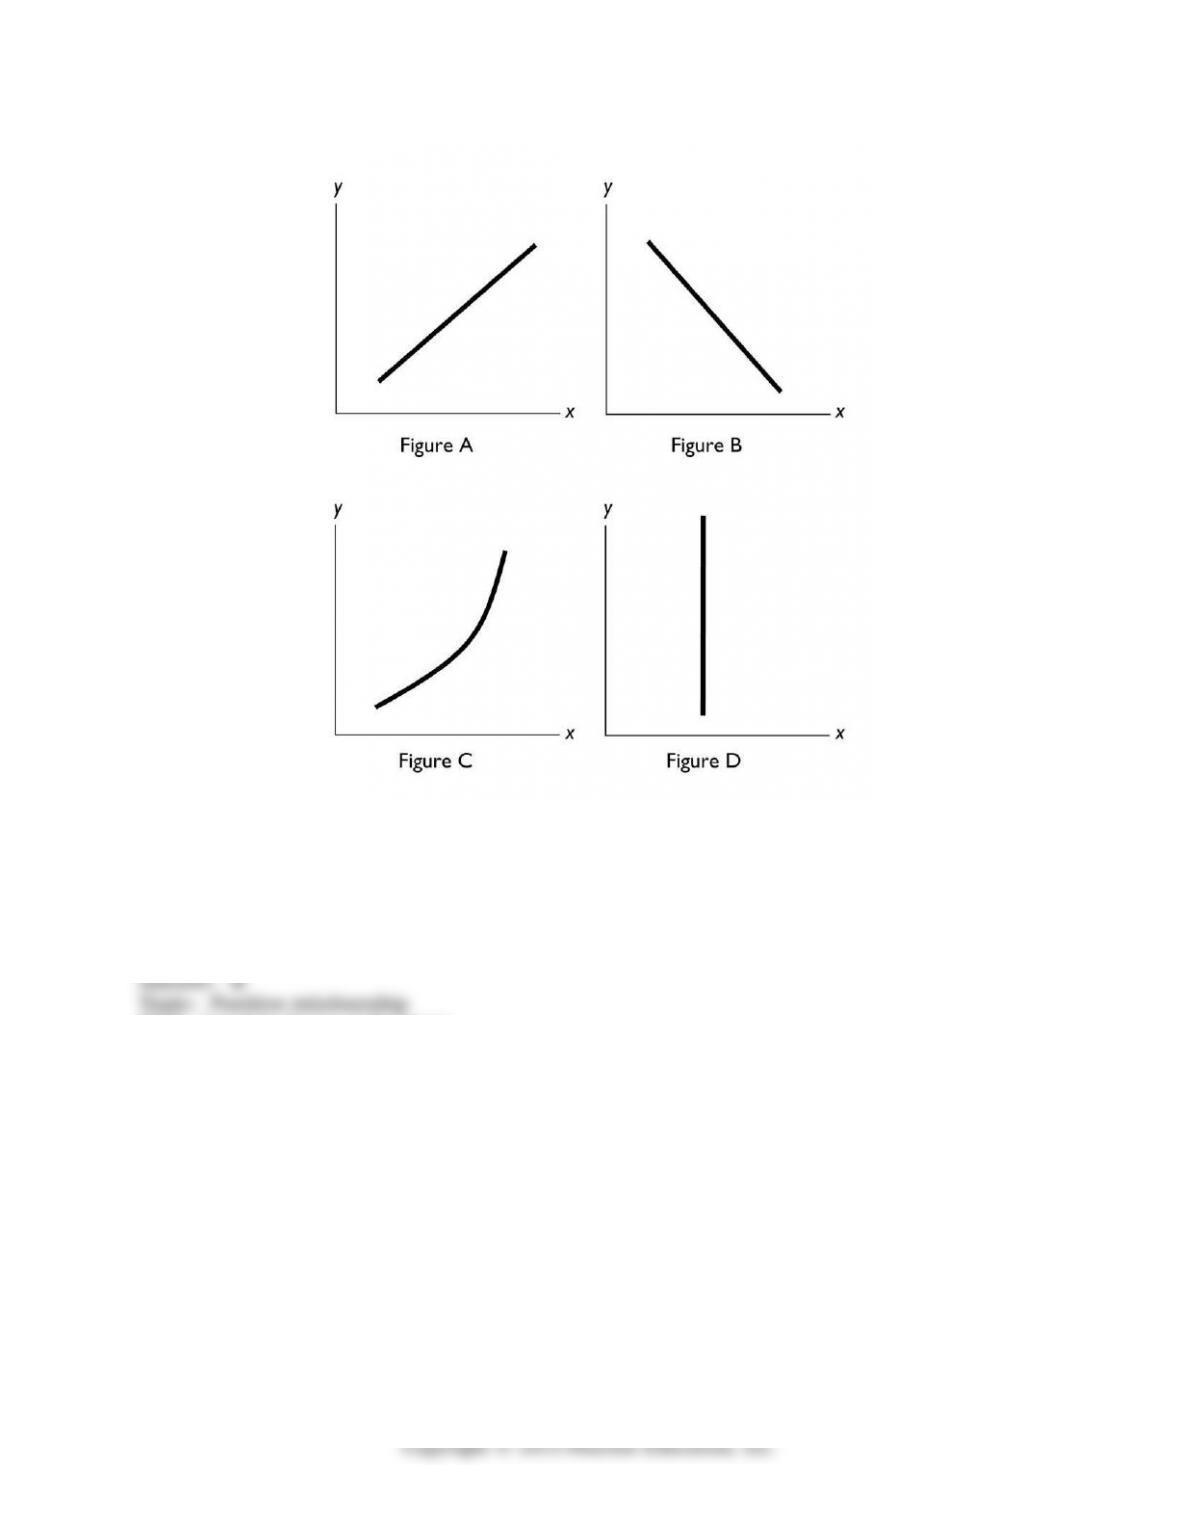
56) In the diagram above, which igure(s) show(s) a direct relationship between the
variables?
A) both B and C
B) both A and C
C) only A
D) only D
E) only B
Skill: Level 2: Using deinitions
Section: Chapter 1 Appendix – Checkpoint 2
Status: Old
AACSB: Analytical thinking
70