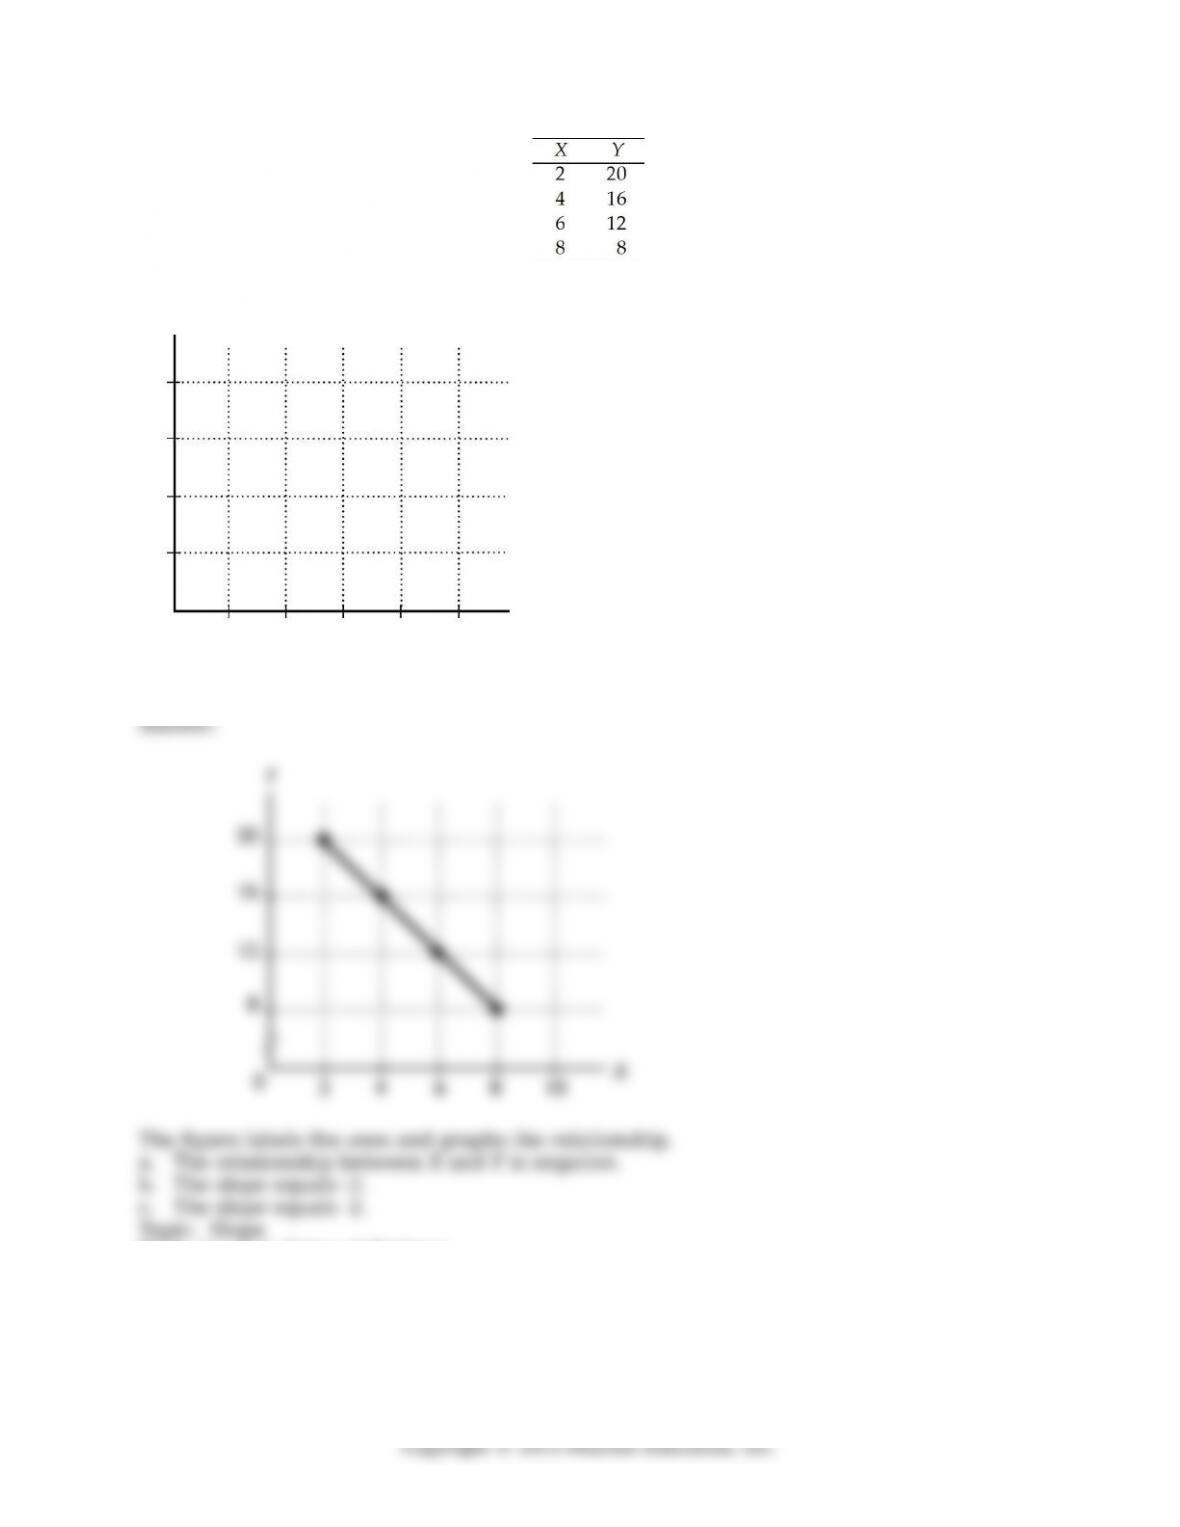
15) Graph the data in the table above in the igure. Label the axes.
a. Is the relationship between X and Y positive or negative?
b. What is the slope when X = 4?
c. What is the slope when X = 8?
Skill: Level 2: Using deinitions
Section: Chapter 1 Appendix – Checkpoint 3
Status: Old
AACSB: Analytical thinking
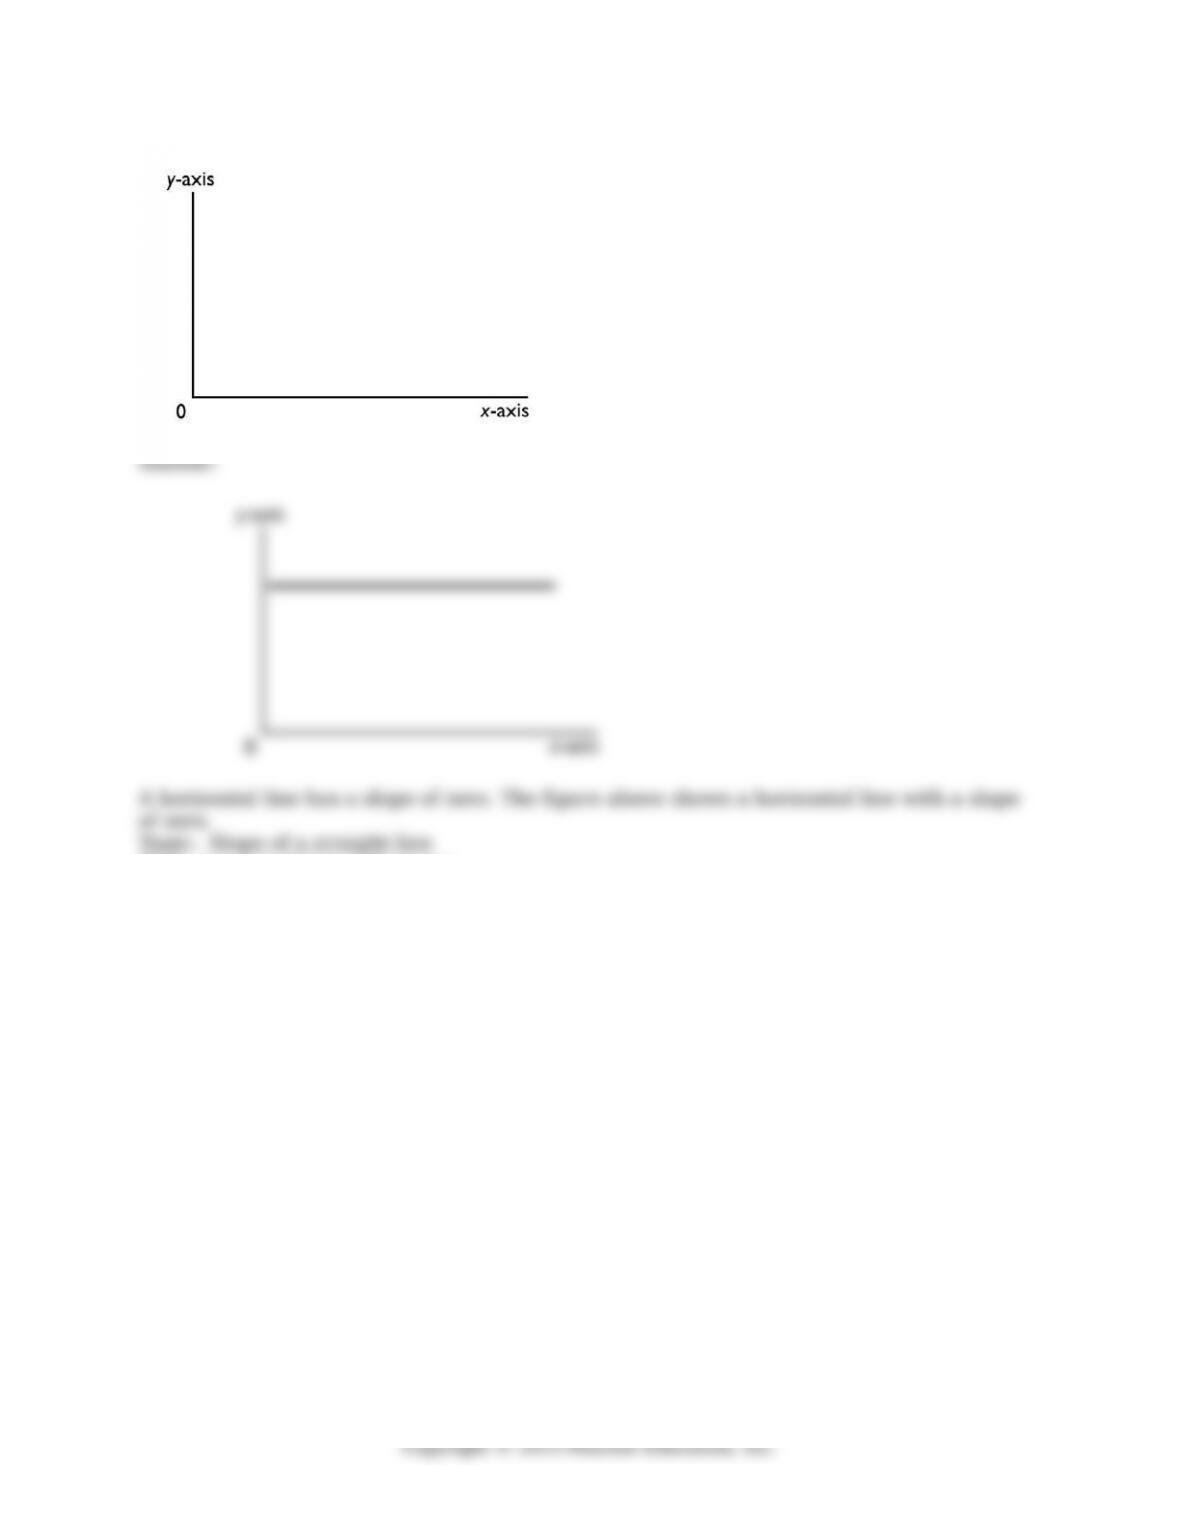
16) In the diagram below, draw a straight line with a slope of zero.
138
Skill: Level 2: Using deinitions
Section: Chapter 1 Appendix – Checkpoint 3
Status: Old
AACSB: Analytical thinking
139
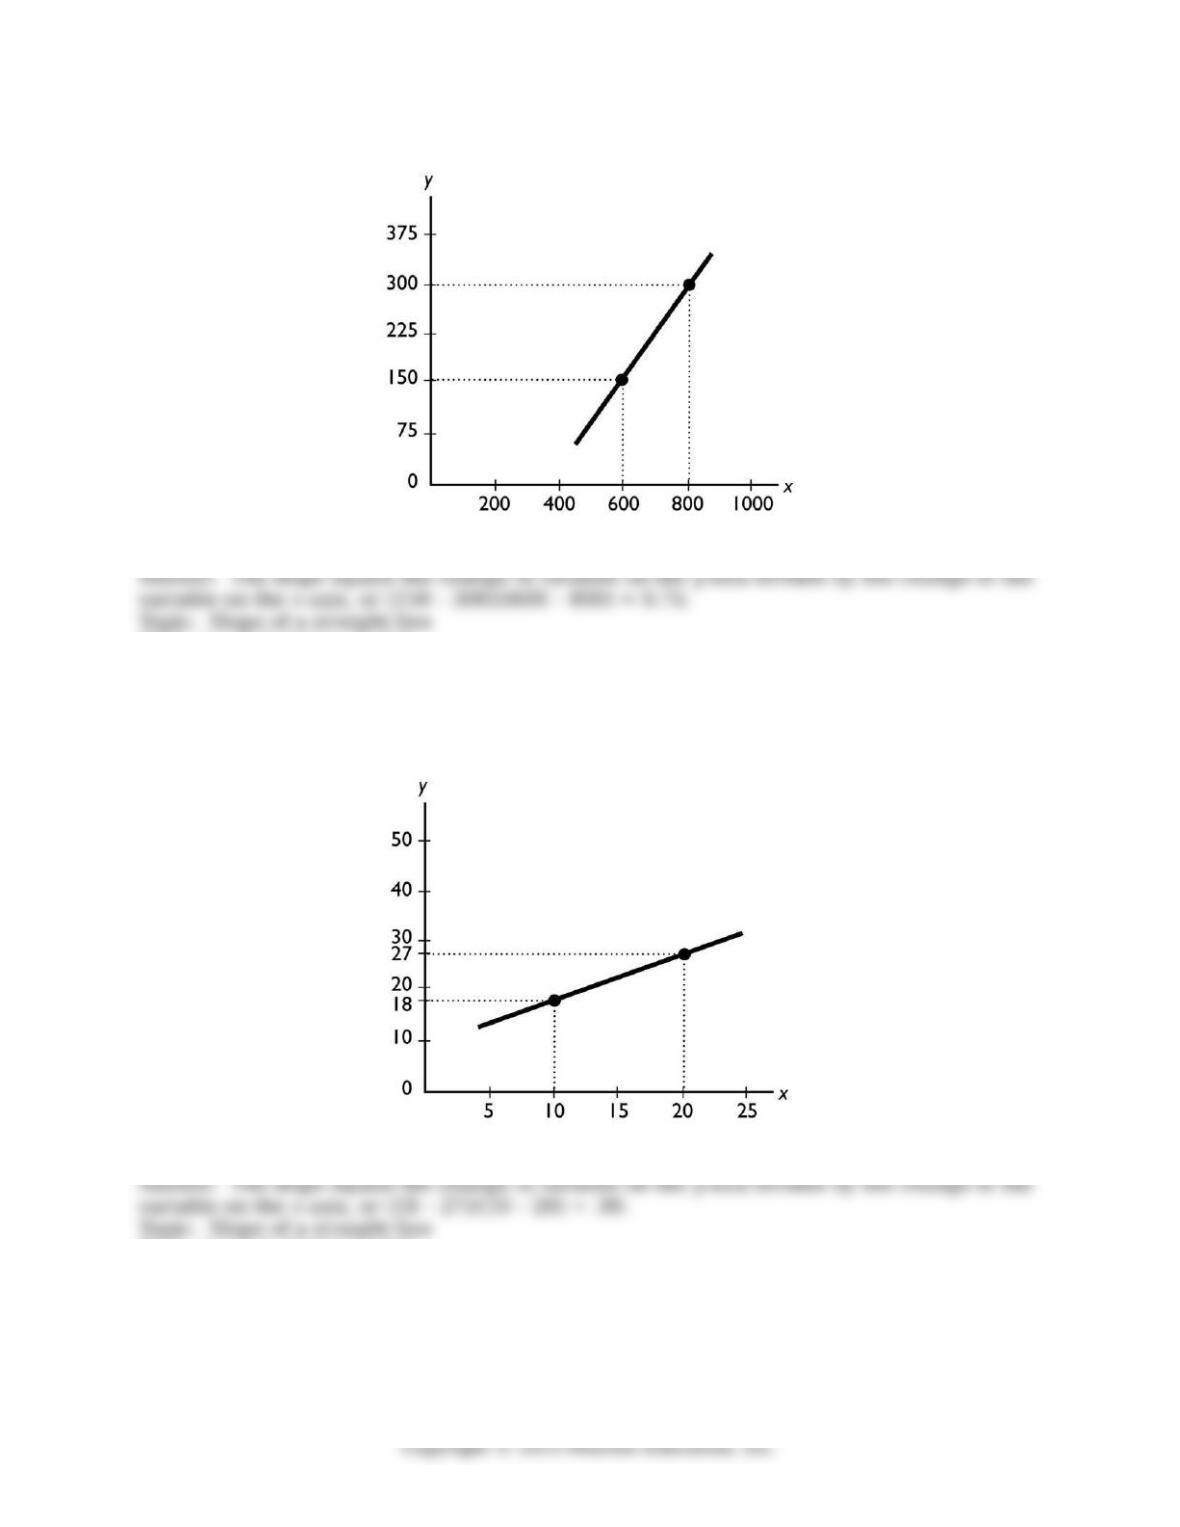
17) What does the slope of the line shown in the above igure equal?
Skill: Level 3: Using models
Section: Chapter 1 Appendix – Checkpoint 3
Status: Old
AACSB: Analytical thinking
18) What does the slope of the line shown in the above igure equal?
Skill: Level 3: Using models
Section: Chapter 1 Appendix – Checkpoint 3
Status: Old
AACSB: Analytical thinking
140
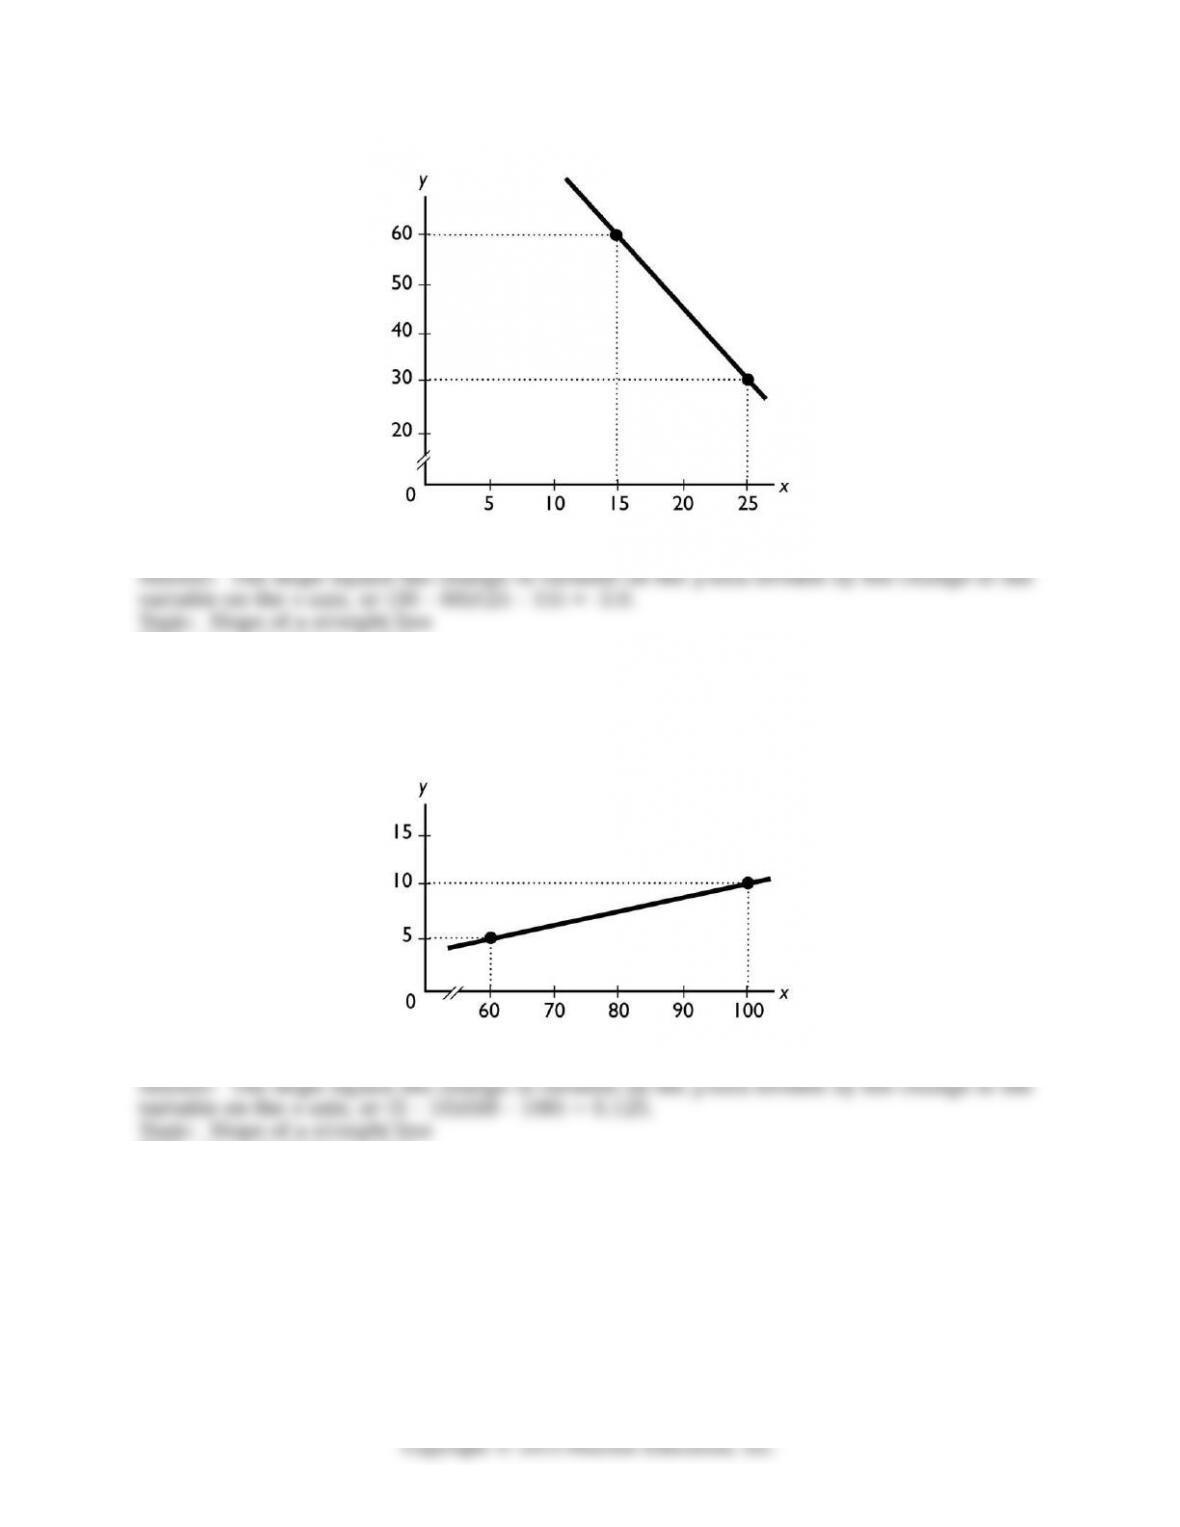
19) What does the slope of the line shown in the above igure equal?
Skill: Level 3: Using models
Section: Chapter 1 Appendix – Checkpoint 3
Status: Old
AACSB: Analytical thinking
20) What does the slope of the line shown in the above igure equal?
Skill: Level 3: Using models
Section: Chapter 1 Appendix – Checkpoint 3
Status: Old
AACSB: Analytical thinking
141
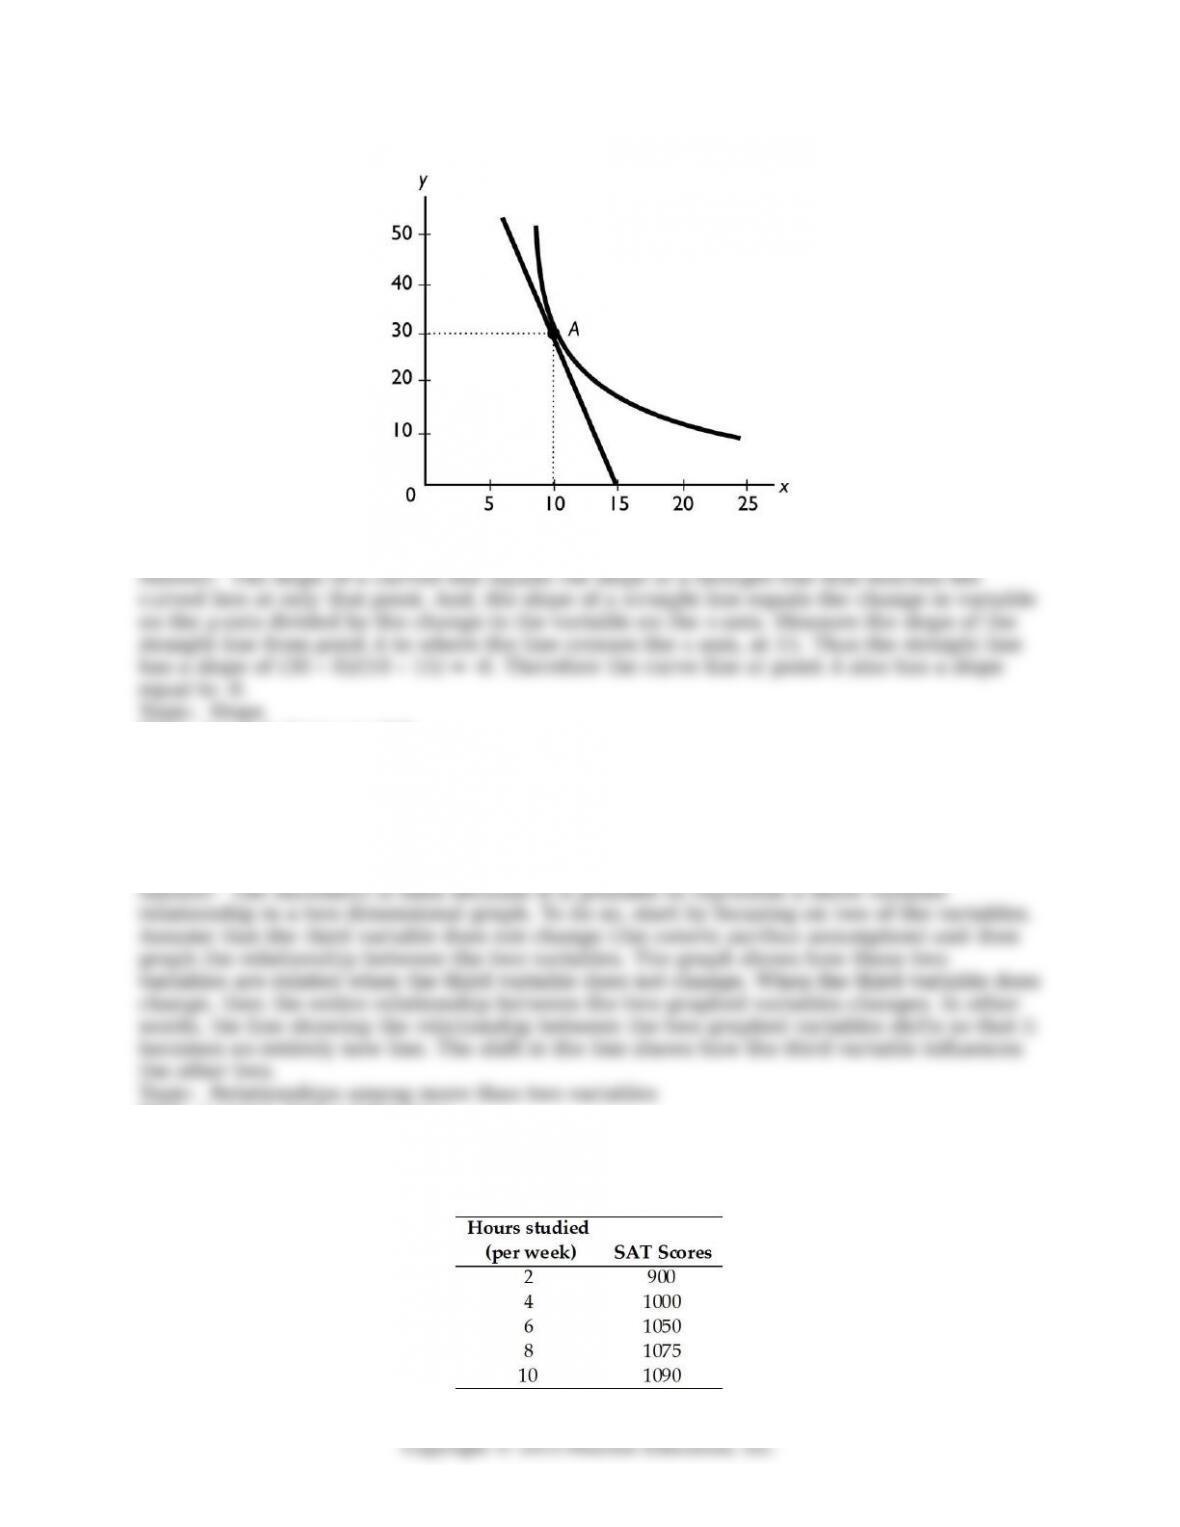
21) What does the slope of the curved line at point A shown in the above igure equal?
Skill: Level 3: Using models
Section: Chapter 1 Appendix – Checkpoint 3
Status: Old
AACSB: Analytical thinking
22) “It is impossible to represent a three variable relationship in a two-dimensional graph.”
Is this statement true or false? Explain your answer.
Skill: Level 2: Using deinitions
Section: Chapter 1 Appendix – Checkpoint 4
Status: Old
AACSB: Analytical thinking
142
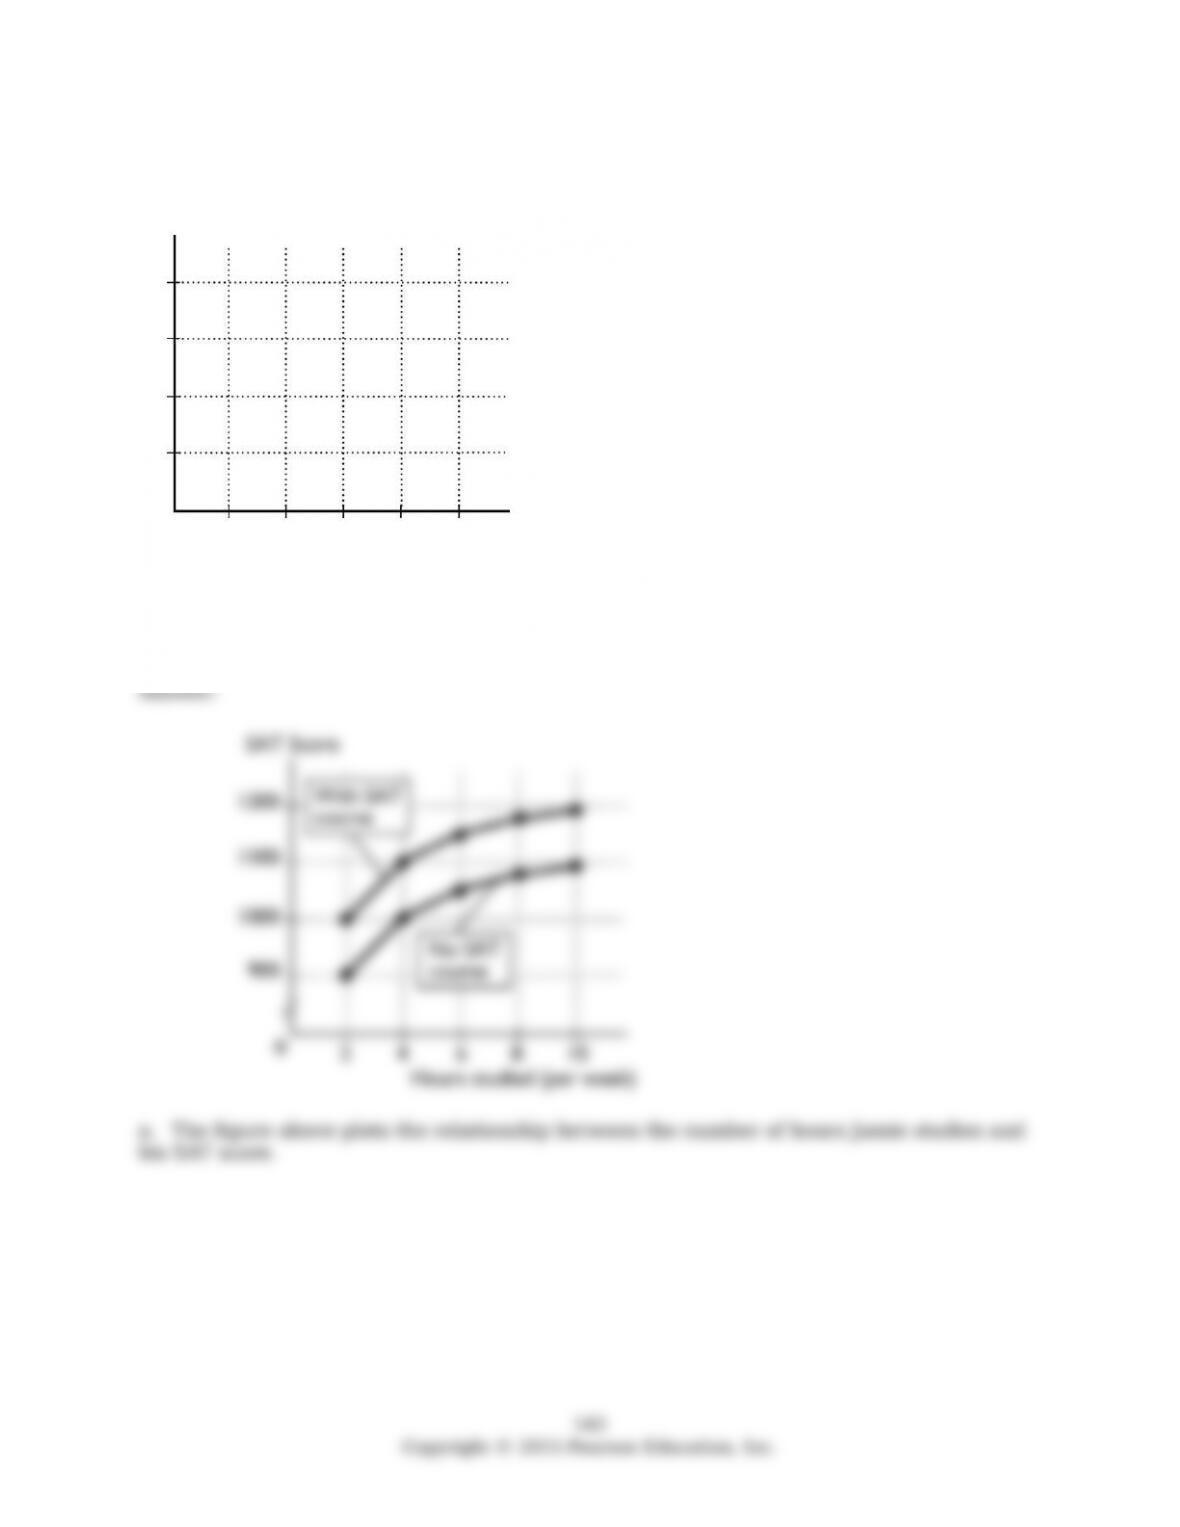
23) Jamie is preparing to take his SAT tests. The table above shows how Jamie’s score
depends on the number of hours a week Jamie studies
a. Plot the relationship in the igure, putting the hours studied on the horizontal axis.
b. Is the relationship you plotted positive or negative?
c. What happens to the slope of the relationship as hours studied increase?
d. Suppose Jamie can enroll in an SAT prep course and, by so doing, for every possible
number of hours he studies, his score will be 100 points higher. Plot the new relationship
between the number of hours studied and Jamie’s SAT score in the igure.
e. How many variables are involved in the igure you just completed?

b. The relationship is positive: As Jamie increases the hours he studies, his SAT score
increases.
c. The relationship is nonlinear, so the slope of the relationship changes as the number of
hours studied changes. In the igure, the slope of the relationship decreases in size as the
number of hours studied increases.
d. The igure above also plots the relationship between the hours Jamie studies and his
SAT score if Jamie takes an SAT preparation course.
e. There are three variables: The number of hours Jamie studies, whether or not he takes
an SAT preparation course, and his SAT score.
Skill: Level 3: Using models
Section: Chapter 1 Appendix – Checkpoint 4
Status: Old
AACSB: Analytical thinking
144