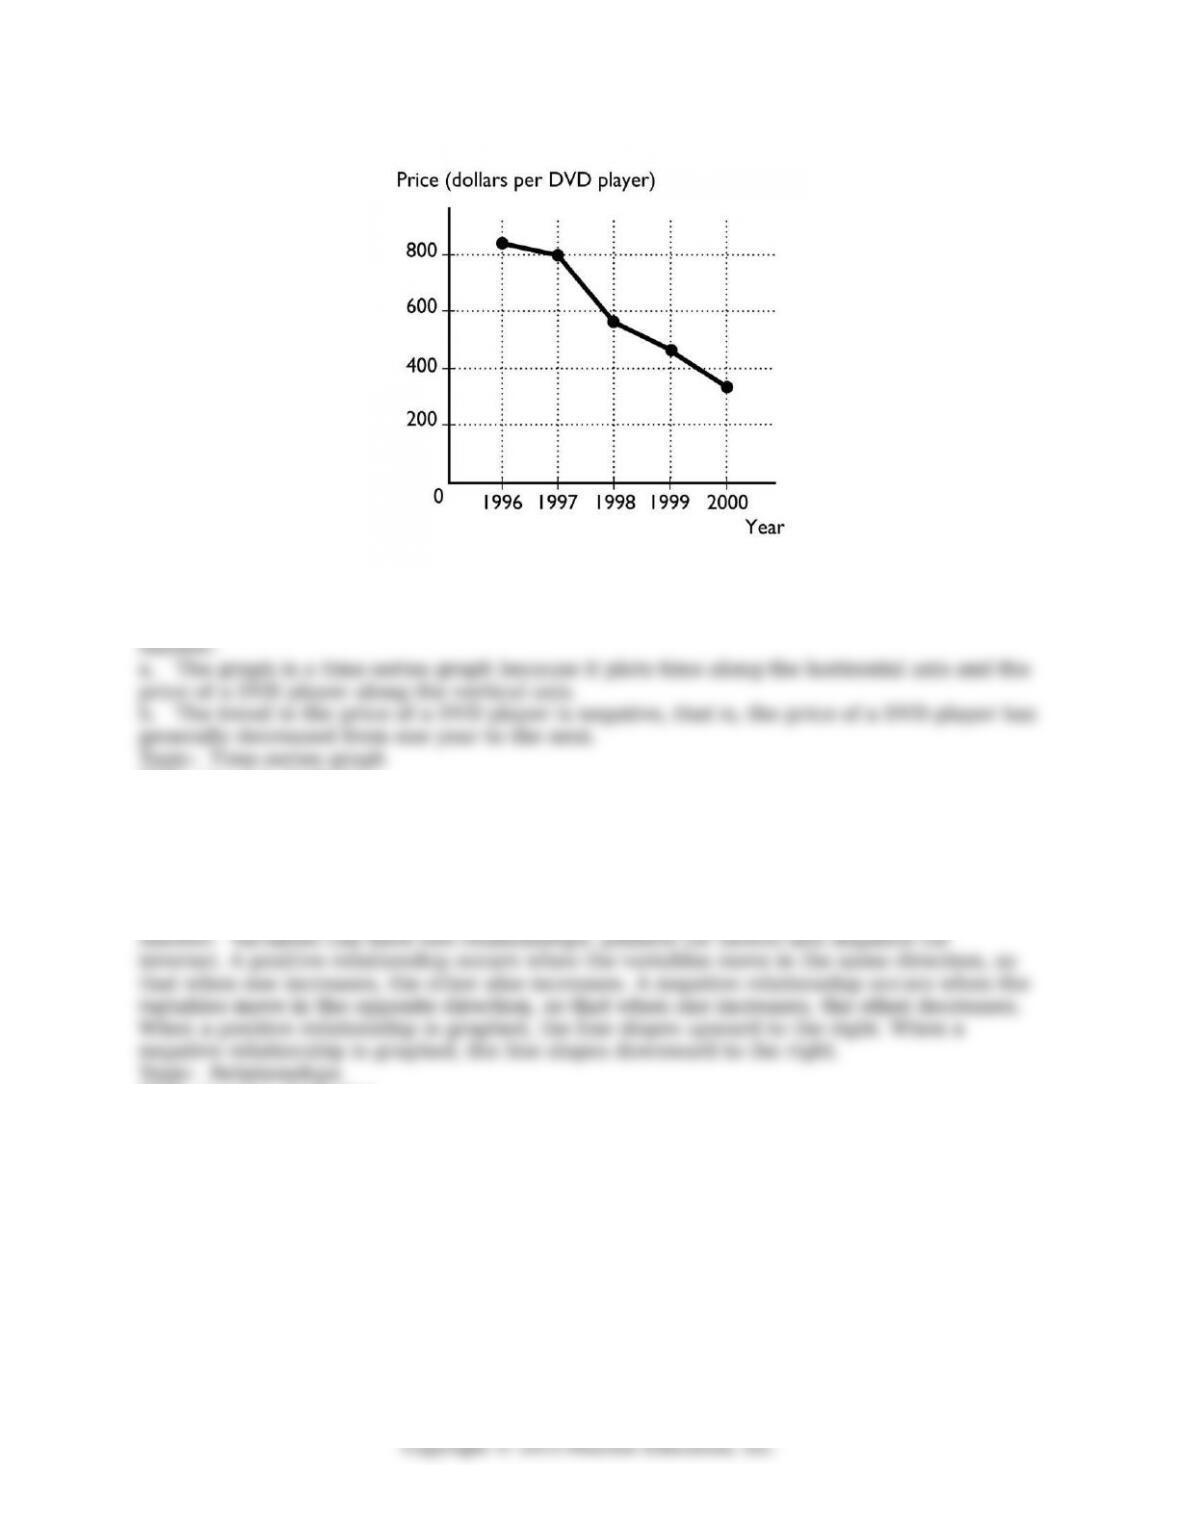
5) The igure above shows the price of a DVD player from 1996 to 2000.
a. What type of graph is illustrated above?
b. What is the trend in the price of a DVD player?
Skill: Level 1: Deinition
Section: Chapter 1 Appendix – Checkpoint 1
Status: Old
AACSB: Analytical thinking
6) What are the two diferent types of relationships that variables can have? Explain each.
What do these relationships look like when they are graphed?
Skill: Level 1: Deinition
Section: Chapter 1 Appendix – Checkpoint 2
Status: Old
AACSB: Analytical thinking
131
7) What is the diference between a positive and a negative relationship?
Skill: Level 1: Deinition
Section: Chapter 1 Appendix – Checkpoint 2
Status: Old
AACSB: Analytical thinking
8) A graph of two variables is a vertical line. What is the interpretation of this result?
Skill: Level 1: Deinition
Section: Chapter 1 Appendix – Checkpoint 2
Status: Old
AACSB: Analytical thinking
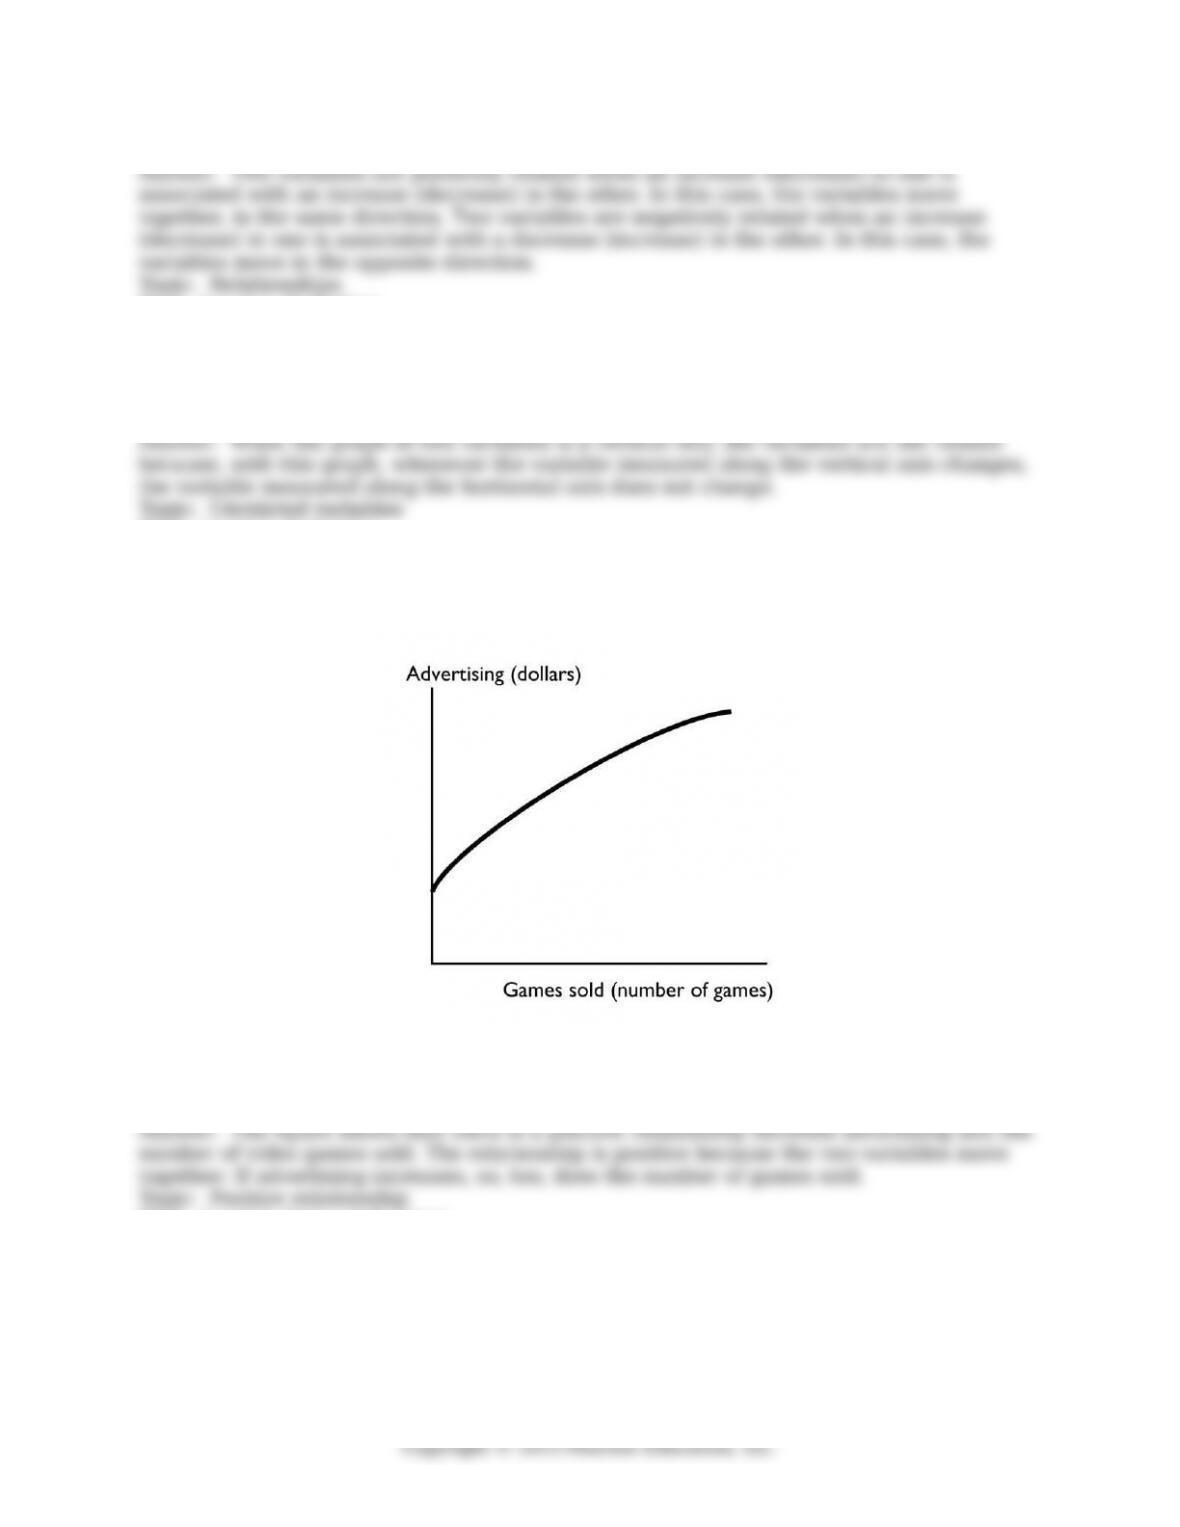
9) The igure above shows how the sales of the video game “Tomb Raider—Lara Retires”
change when the advertising spent on the game changes. Is the relationship between
advertising and the number of games sold positive, negative, or neither? Explain your
answer.
Skill: Level 2: Using deinitions
Section: Chapter 1 Appendix – Checkpoint 2
Status: Old
AACSB: Analytical thinking
132
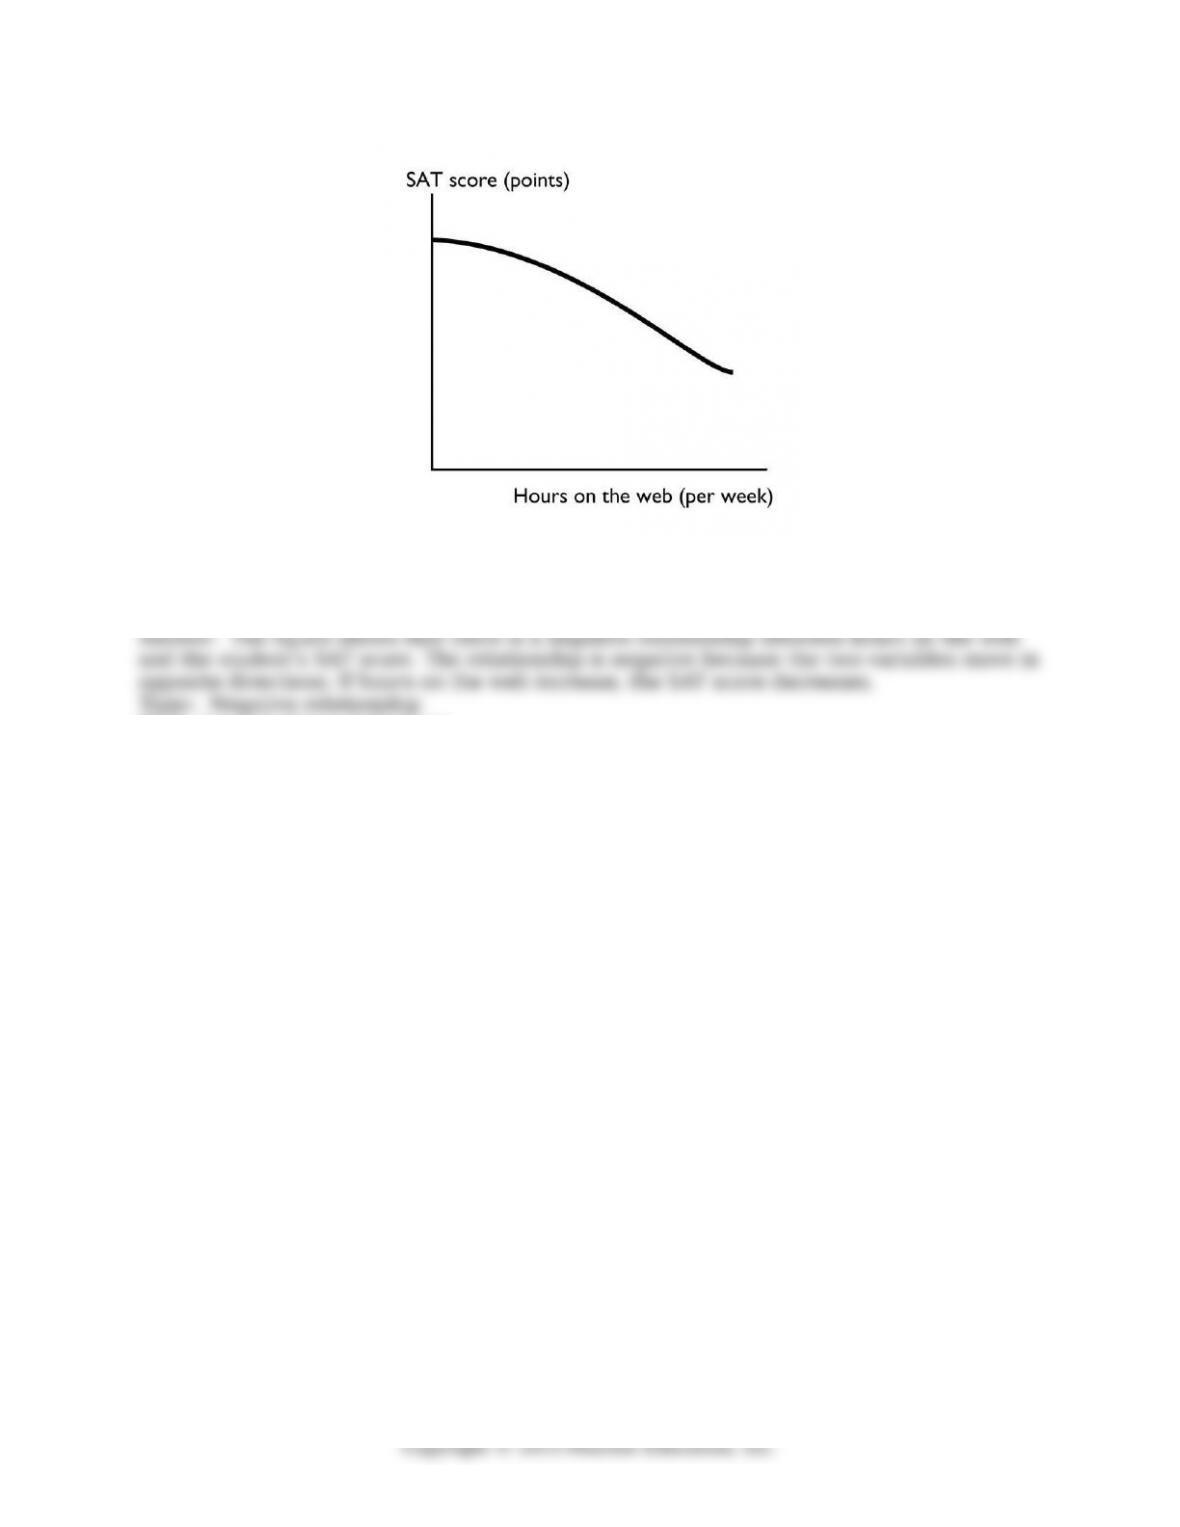
10) The igure above shows how the relationship between the number of hours per week a
high school student spends on the web and the student’s SAT score. Is the relationship
between hours on the web and the SAT score positive, negative, neither? Explain your
answer.
Skill: Level 2: Using deinitions
Section: Chapter 1 Appendix – Checkpoint 2
Status: Old
AACSB: Analytical thinking
133
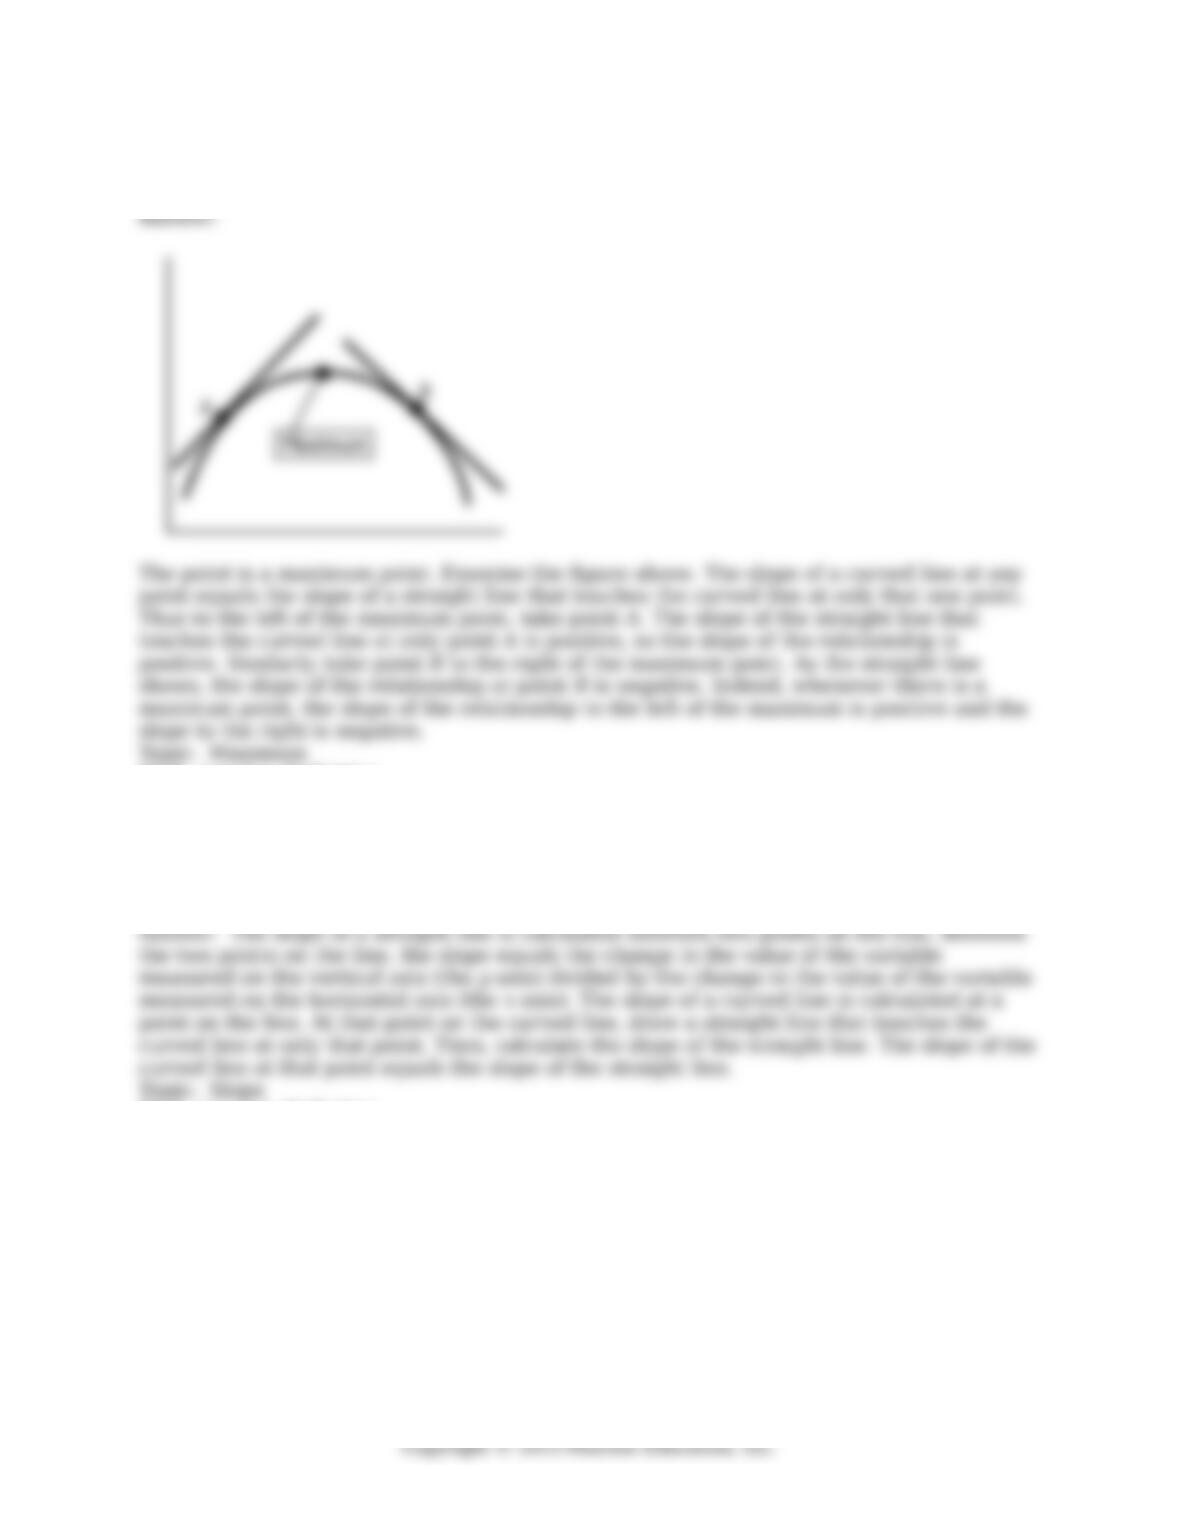
11) A graph has a point that is either a maximum or a minimum. To the left of the point, the
slope of relationship is positive. To the right of the point, the slope is negative. Is the point
a maximum point or a minimum point? Be sure to draw a igure that supports your answer.
Skill: Level 1: Deinition
Section: Chapter 1 Appendix – Checkpoint 2
Status: Old
AACSB: Analytical thinking
12) What does the slope of a straight line equal? How is the slope of a curved line
calculated?
Skill: Level 1: Deinition
Section: Chapter 1 Appendix – Checkpoint 3
Status: Old
AACSB: Analytical thinking
134
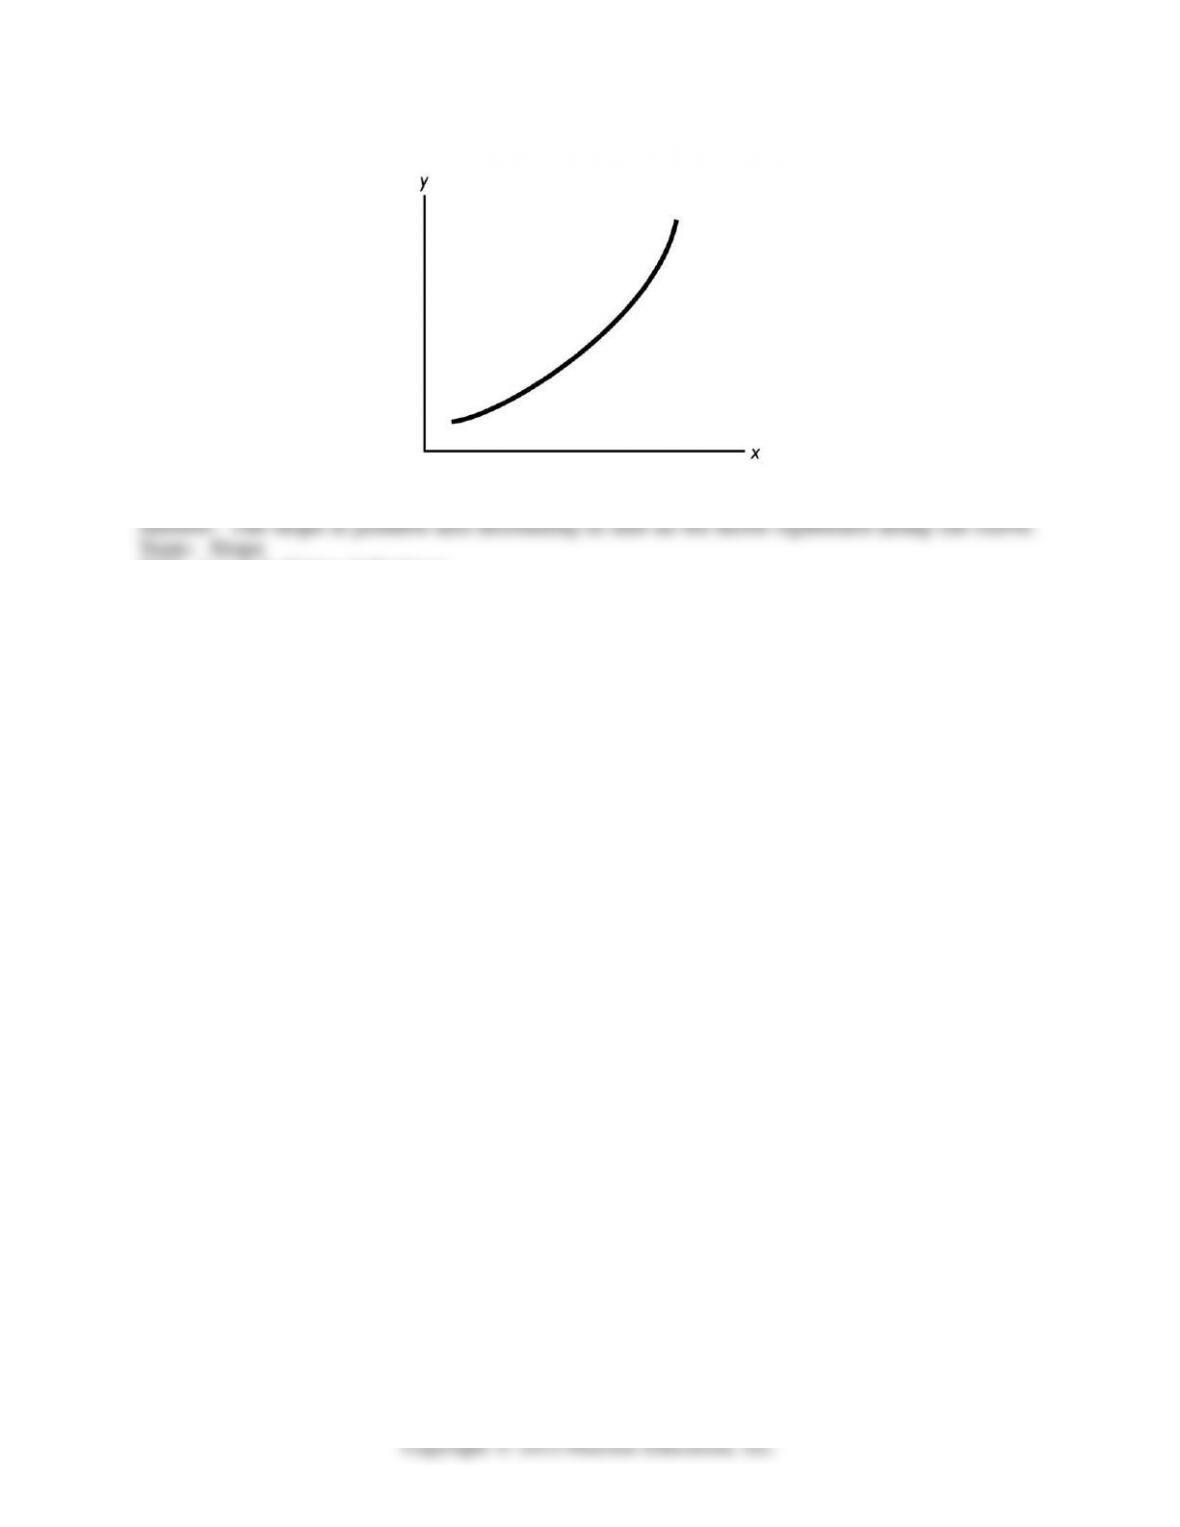
13) In the igure above, what can you deduce about the slope of the curve?
Skill: Level 2: Using deinitions
Section: Chapter 1 Appendix – Checkpoint 3
Status: Old
AACSB: Analytical thinking
135
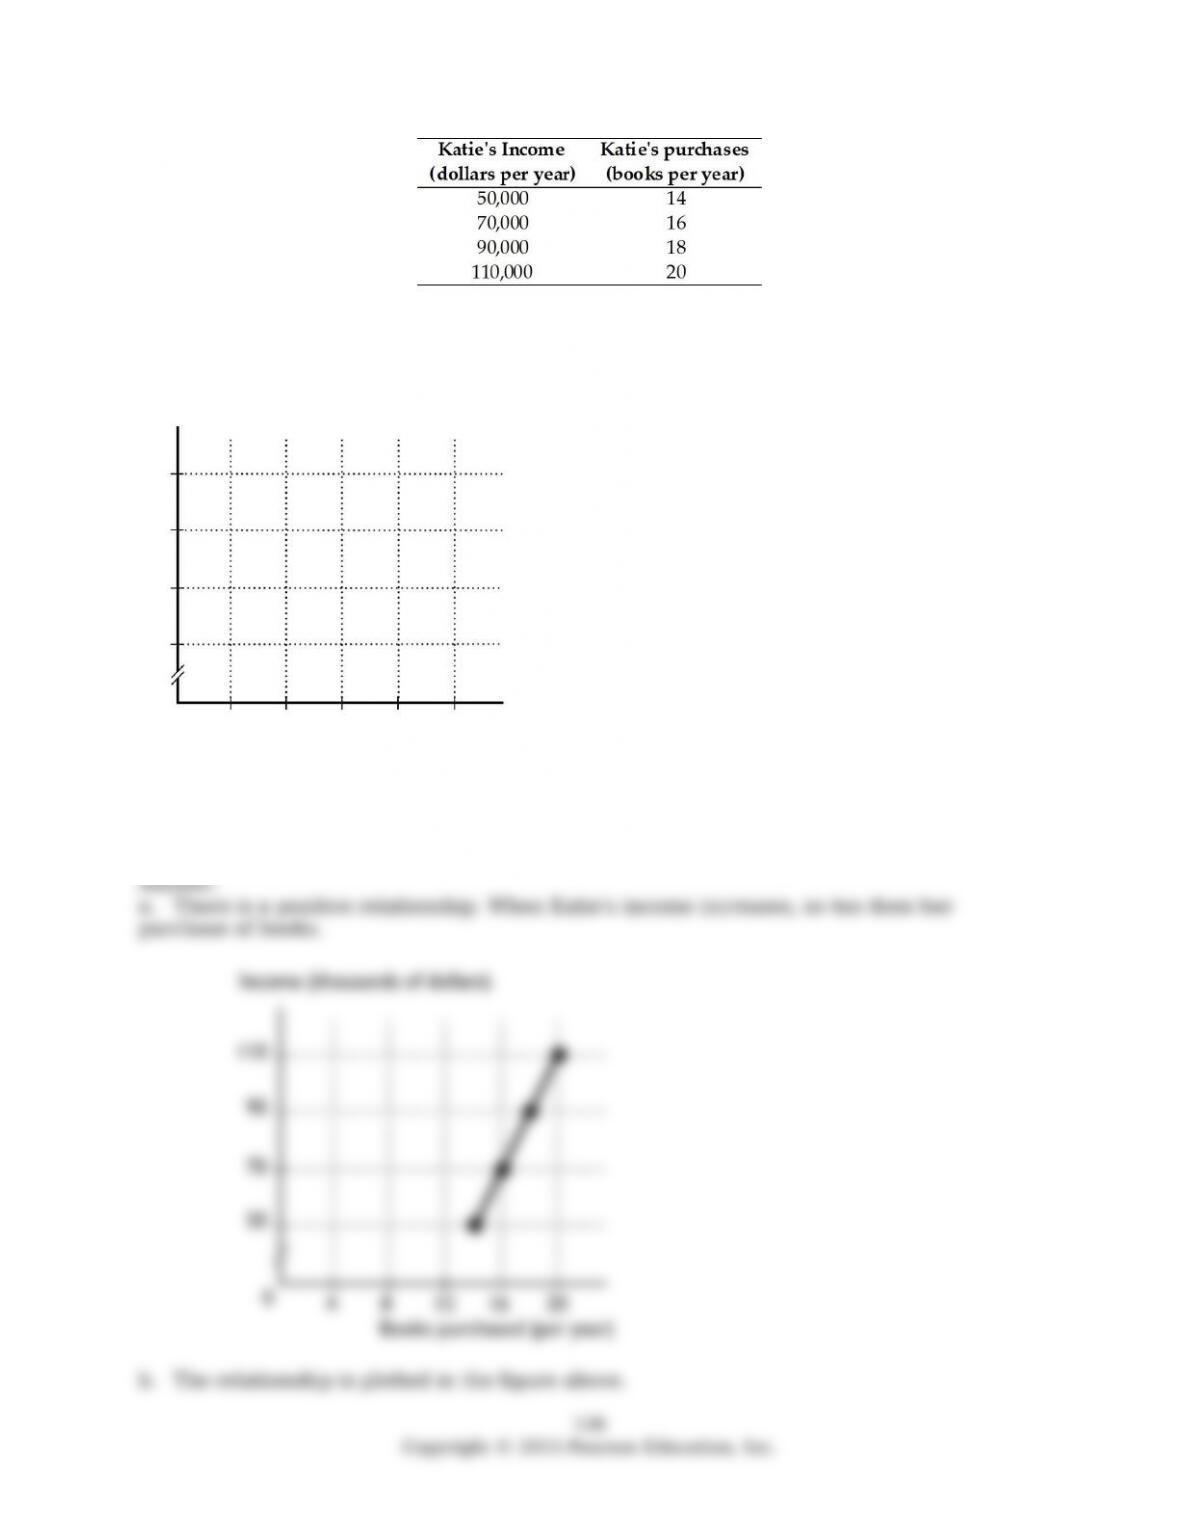
14) The table above shows how the number of books Katie buys each year depends on her
income.
a. What kind of relationship exists between Katie’s income and the number of books she
purchases?
b. Plot the relationship between Katie’s income and the number of books she purchases in
the above igure. Measure income along the vertical axis and the number of books along
the horizontal axis. Be sure to label the axes.
c. What is the slope of the relationship between $50,000 and $70,000 of income?
d. What is the slope of the relationship between $90,000 and $110,000 of income?
e. Comment on the similarity or dissimilarity of your answers to parts (c) and (d).
c. The slope equals the change in the value of the variable measured on the vertical axis,
income, divided by the change in the value of the variable measured along the horizontal
axis, the number of books. Between $50,000 and $70,000 of income, the number of books
purchased increases from 14 to 16. Hence income increases by $20,000 and the number of
books increases by 2, so the slope equals
$20,000/2 = 10,000.
d. As with the previous answer, the slope equals the change in income divided by the
change in books. Between $90,000 and $110,000 of income, the number of books
purchased increases from 18 to 20. Hence income increases by $20,000 and the number of
books increases by 2, so the slope equals $20,000/2 = 10,000.
e. The slopes in parts (c) and (d) are equal. But, they must be equal because the
relationship between Katie’s income and the number of books she purchases is linear. For a
linear relationship, the slope is the same regardless of where it is measured.
Skill: Level 3: Using models
Section: Chapter 1 Appendix – Checkpoint 3
Status: Old
AACSB: Analytical thinking
137