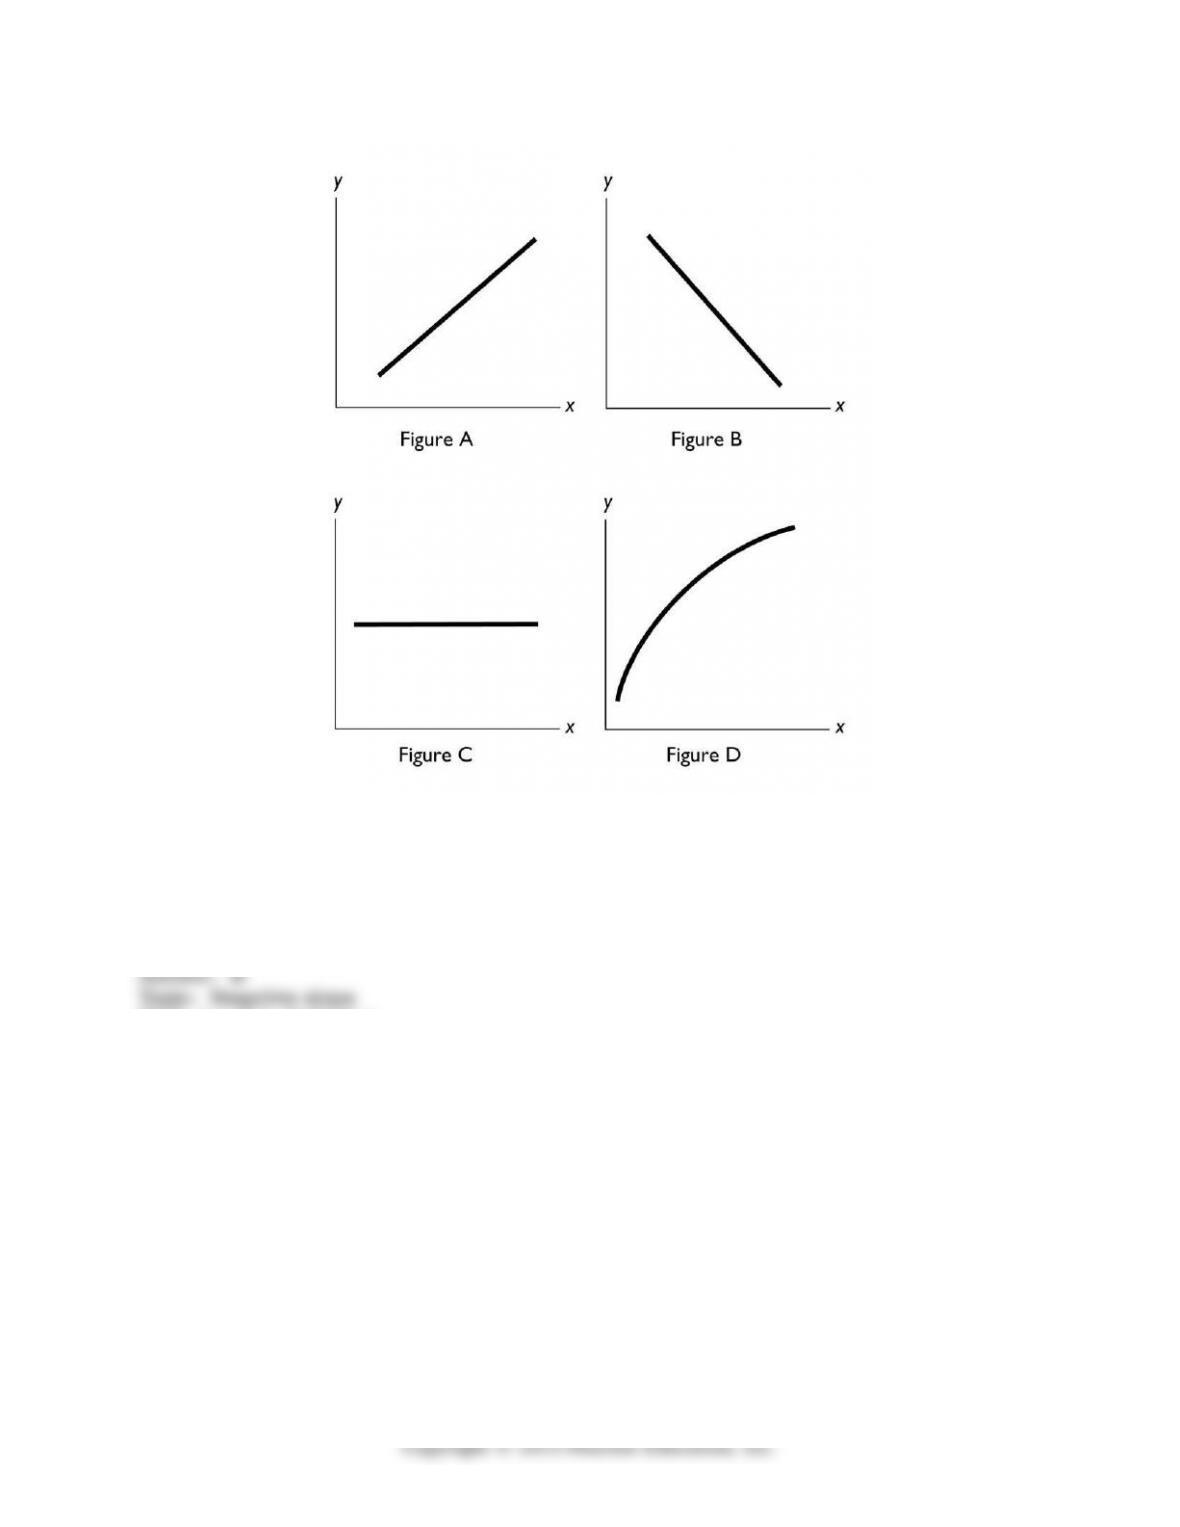
99) In the above igure, which of the igures shows a relationship between x and y with a
negative slope?
A) Figure A
B) Figure B
C) Figure C
D) Figure D
E) Both Figure A and Figure B
Skill: Level 1: Deinition
Section: Chapter 1 Appendix – Checkpoint 3
Status: Old
AACSB: Analytical thinking
91
100) In the above igure, which of the igures show(s) a relationships between x and y with
a positive slope?
A) Figure A and Figure D
B) Figure B and Figure C
C) Figure C only
D) Figure D only
E) Figure A and Figure B
Skill: Level 2: Using deinitions
Section: Chapter 1 Appendix – Checkpoint 3
Status: Old
AACSB: Analytical thinking
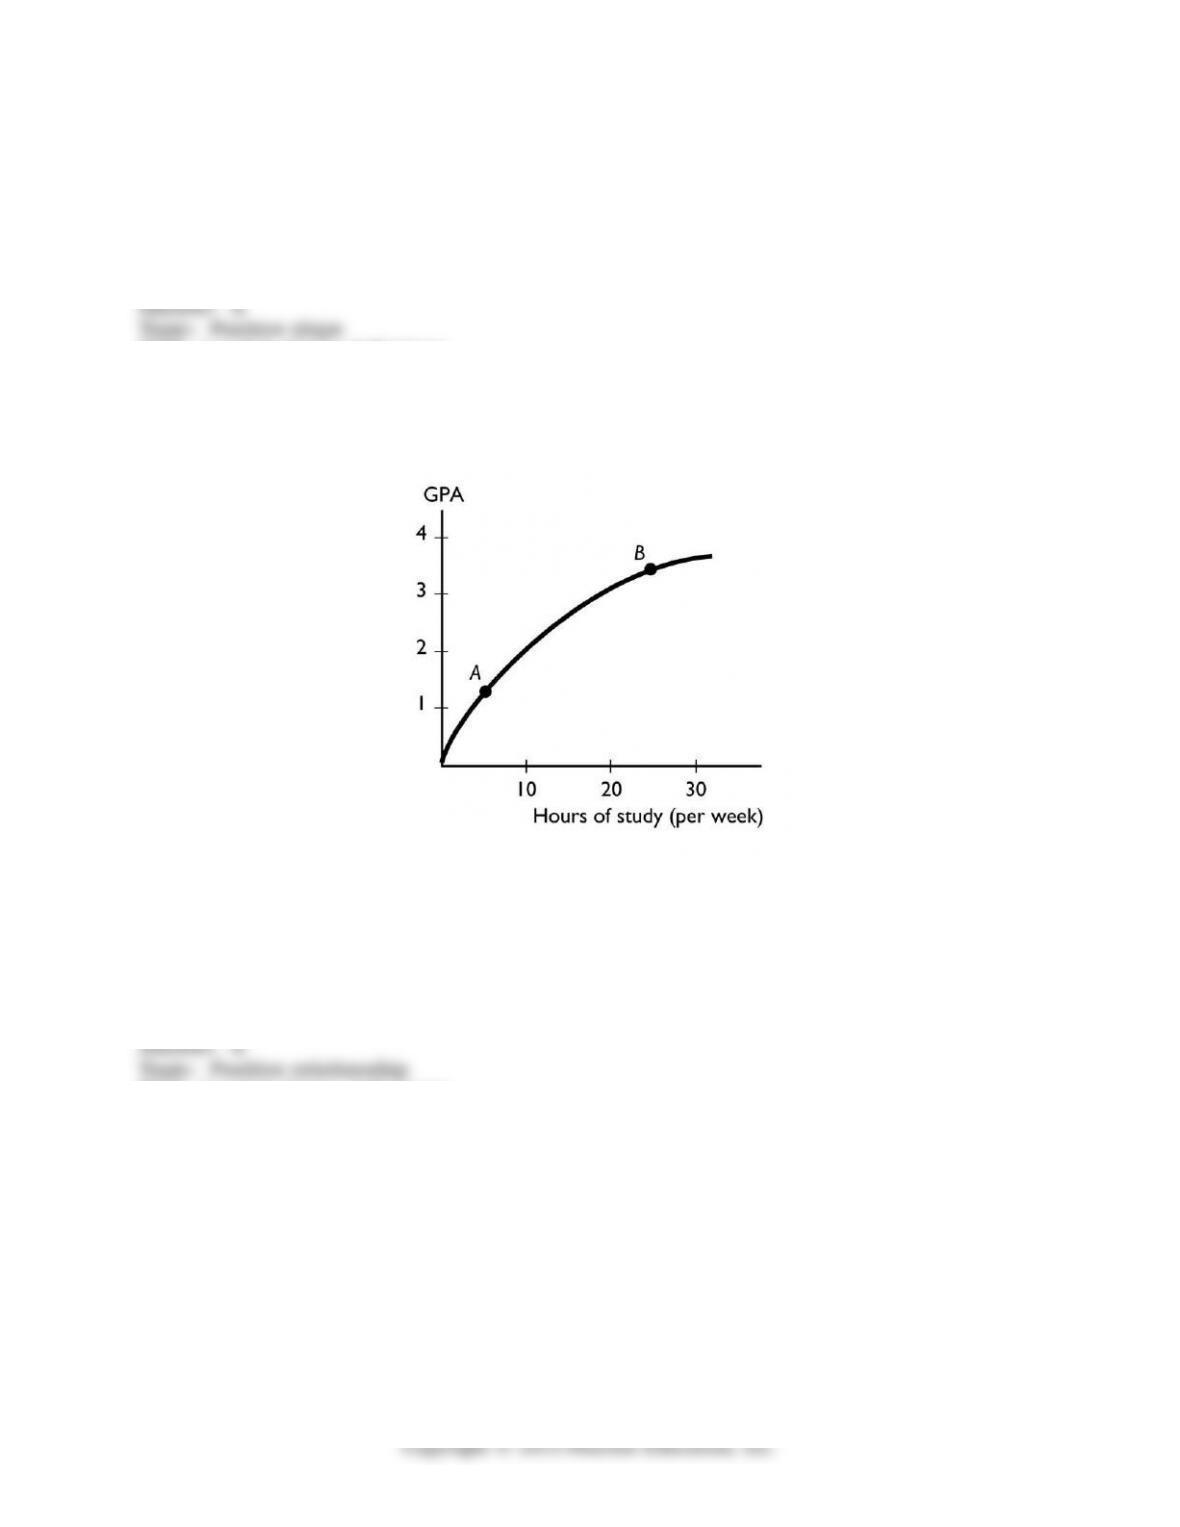
101) The igure above shows the relationship between the time a student spends studying
and the student’s GPA that semester. This igure shows ________ relationship between the
time spent studying and the GPA.
A) a positive but not linear
B) a negative
C) no
D) a positive, linear
E) a cross-sectionally trended
Skill: Level 2: Using deinitions
Section: Chapter 1 Appendix – Checkpoint 3
Status: Old
AACSB: Analytical thinking
92

102) The igure above shows the relationship between the time a student spends studying
and the student’s GPA that semester. The slope of the relationship at point A ________ the
slope at point B.
A) is greater than
B) is less than
C) is equal to
D) cannot be compared to
E) can be compared but more information is needed to determine whether the slope is
greater than, less than, or equal to
Skill: Level 3: Using models
Section: Chapter 1 Appendix – Checkpoint 3
Status: Old
AACSB: Analytical thinking
93
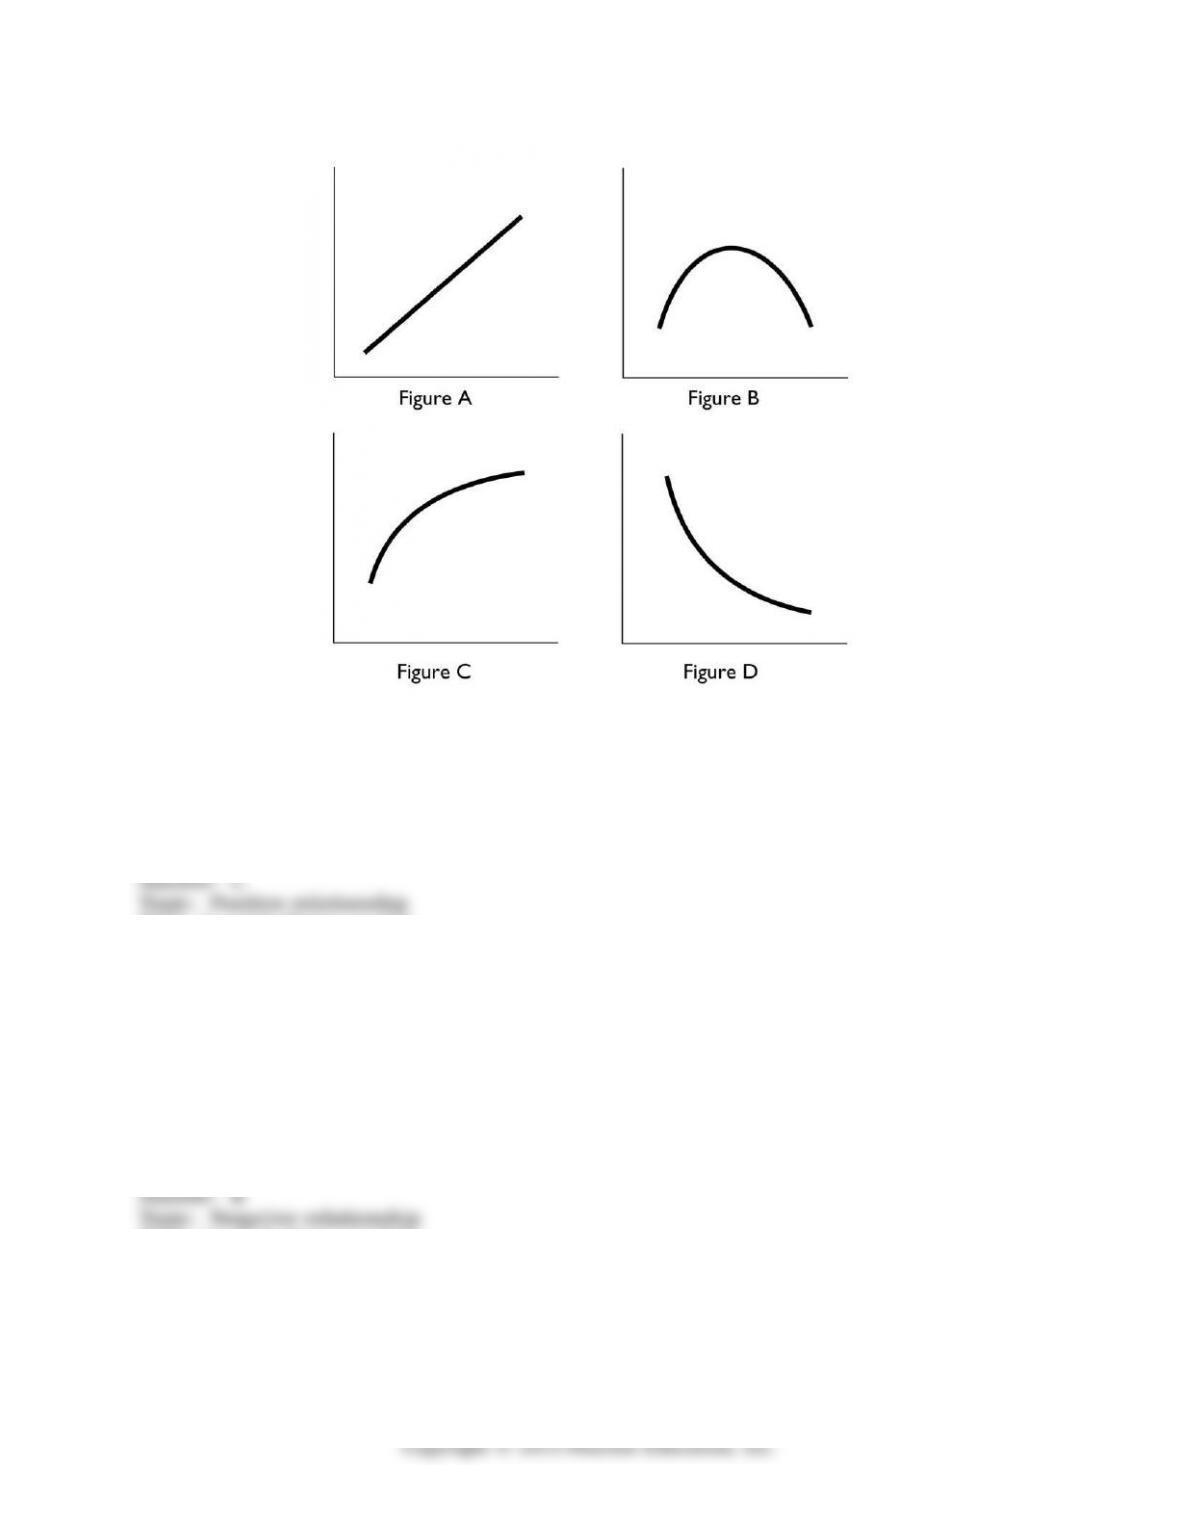
103) In the above, which igure(s) show relationship between the variables that is always
positive?
A) Figure A only
B) Figures C and D
C) Figures A and C
D) Figures A, C, and D
E) Figures A and B
Skill: Level 3: Using models
Section: Chapter 1 Appendix – Checkpoint 3
Status: Old
AACSB: Analytical thinking
104) In the above, which igure(s) show a relationship between the variables that is always
negative?
A) Figure A only
B) Figure D only
C) Figures A and C
D) Figures A, C, and D
E) Figure B only
Skill: Level 3: Using models
Section: Chapter 1 Appendix – Checkpoint 3
Status: Old
AACSB: Analytical thinking
105) In the above, which igure shows both a positive and a negative relationship between
the variables?
A) Figure A
94
B) Figure B
C) Figure C
D) Figure D
E) Figure A, B, and D
Skill: Level 3: Using models
Section: Chapter 1 Appendix – Checkpoint 3
Status: Old
AACSB: Analytical thinking
106) In the above, which igure(s) has (have) at least one point at which the slope equals
zero?
A) Figure B only
B) Figures A and C
C) Figure D only
D) Figures A, C, and D
E) Figures A and D
Skill: Level 3: Using models
Section: Chapter 1 Appendix – Checkpoint 3
Status: Old
AACSB: Analytical thinking
107) In the above, in which igure(s) is the slope the same at every point?
A) Figure A only
B) Figures A and C
C) Figure B only
D) Figures A, C, and D
E) Figures C and D
Skill: Level 3: Using models
Section: Chapter 1 Appendix – Checkpoint 3
Status: Old
AACSB: Analytical thinking
95
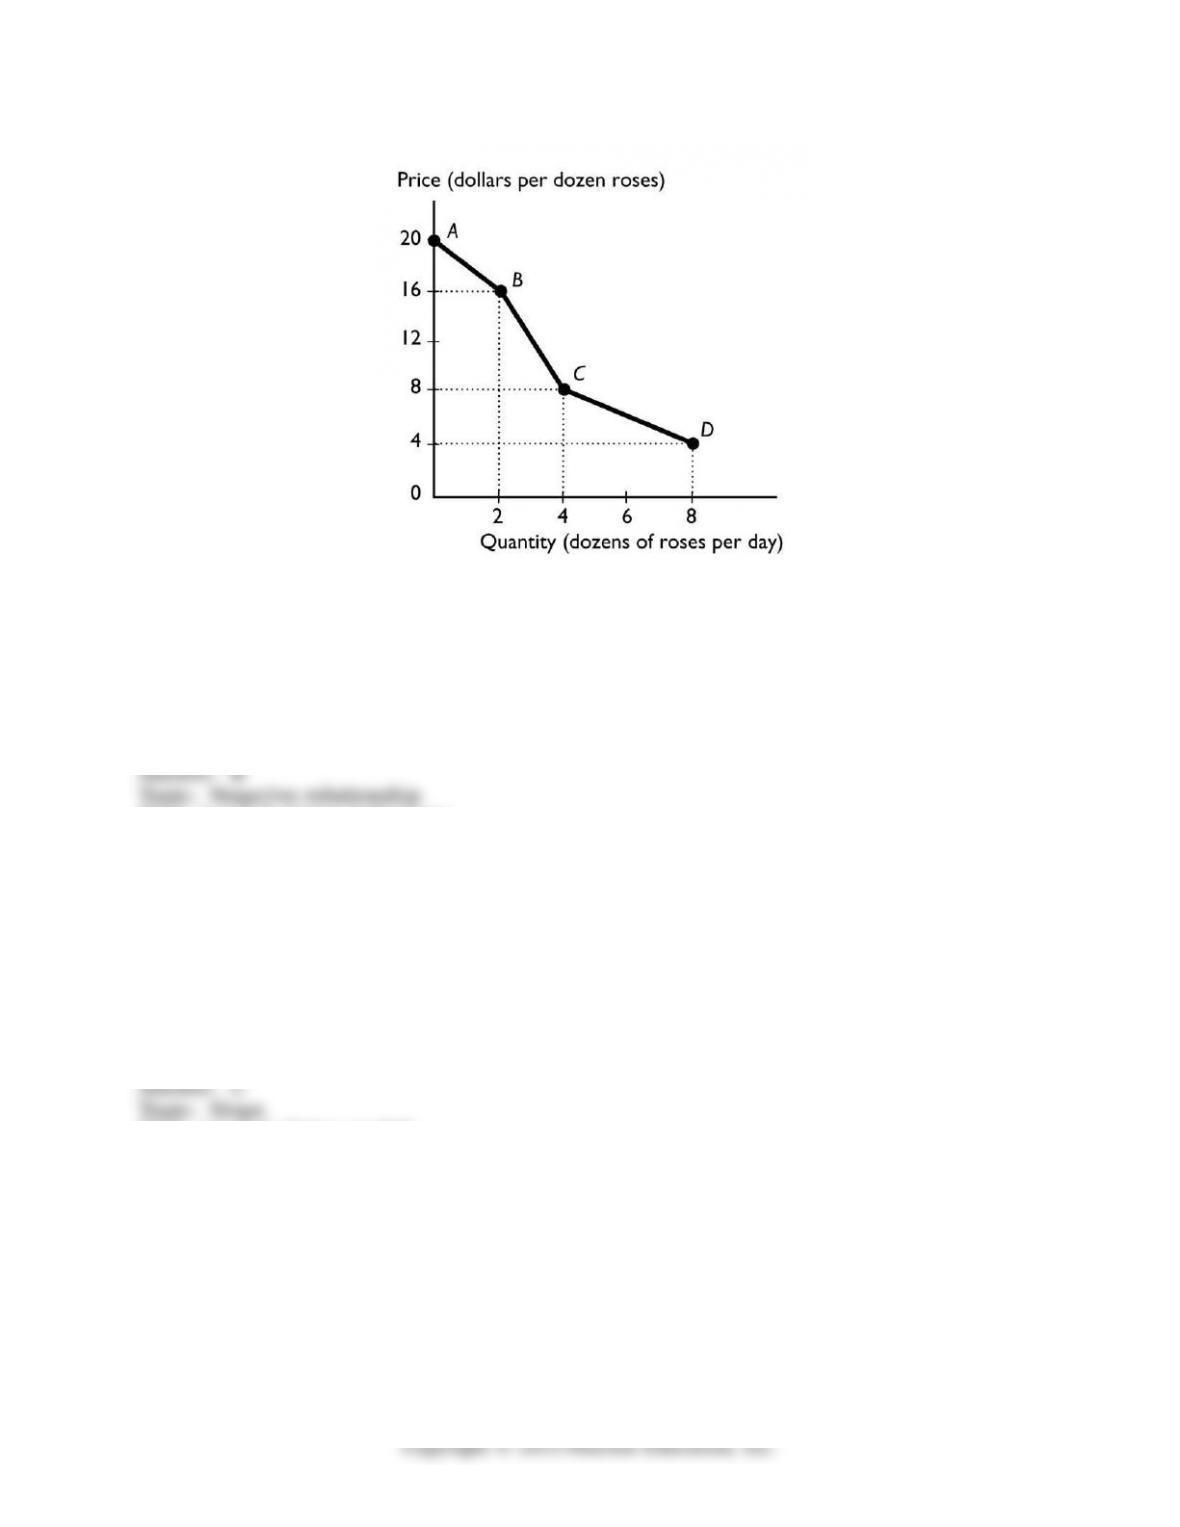
108) The igure above shows the relationship between the price of a dozen roses and the
quantity of roses a lorist can sell. The relationship between the price and the quantity the
lorist can sell is
A) positive.
B) negative.
C) nonexistent.
D) linear.
E) cross-sectionally trended.
Skill: Level 2: Using deinitions
Section: Chapter 1 Appendix – Checkpoint 3
Status: Old
AACSB: Analytical thinking
109) The igure above shows the relationship between the price of a dozen roses and the
quantity of roses a lorist can sell. The slope between points A and B is
A) 20.
B) 16.
C) 2.
D) 4
E) nonexistent because at point A, no roses are sold.
Skill: Level 3: Using models
Section: Chapter 1 Appendix – Checkpoint 3
Status: Old
AACSB: Analytical thinking
96
110) The igure above shows the relationship between the price of a dozen roses and the
quantity of roses a lorist can sell. The slope between points B and C equals
A) 16.
B) 8.
C) 4.
D) 2.
E) 14.
Skill: Level 3: Using models
Section: Chapter 1 Appendix – Checkpoint 3
Status: Old
AACSB: Analytical thinking
111) The igure above shows the relationship between the price of a dozen roses and the
quantity of roses a lorist can sell. The slope between points C and D equals
A) 8.
B) 4.
C) 2.
D) 1.
E) 12
Skill: Level 3: Using models
Section: Chapter 1 Appendix – Checkpoint 3
Status: Old
AACSB: Analytical thinking
97
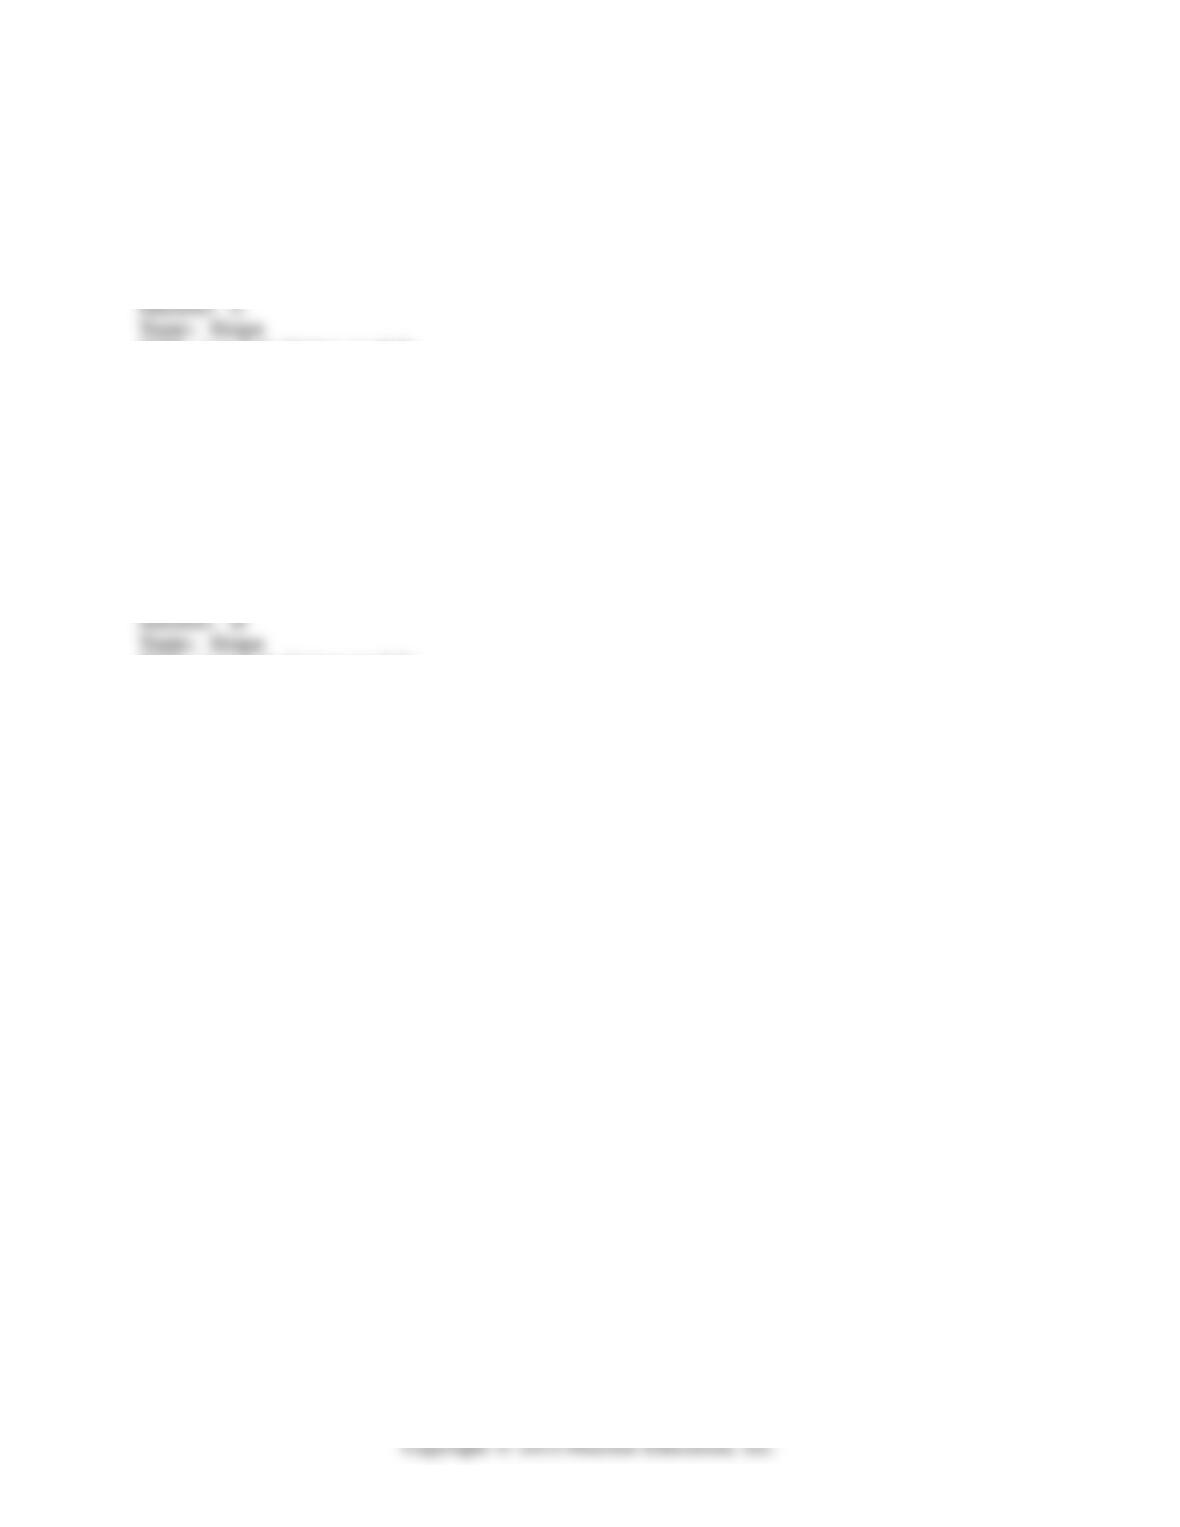
112) In the igure above, between points A and B, what is the slope of the line?
A) 4
B) 1
C) 3
D) -3
E) 0
Skill: Level 3: Using models
Section: Chapter 1 Appendix – Checkpoint 3
Status: Old
AACSB: Analytical thinking
98
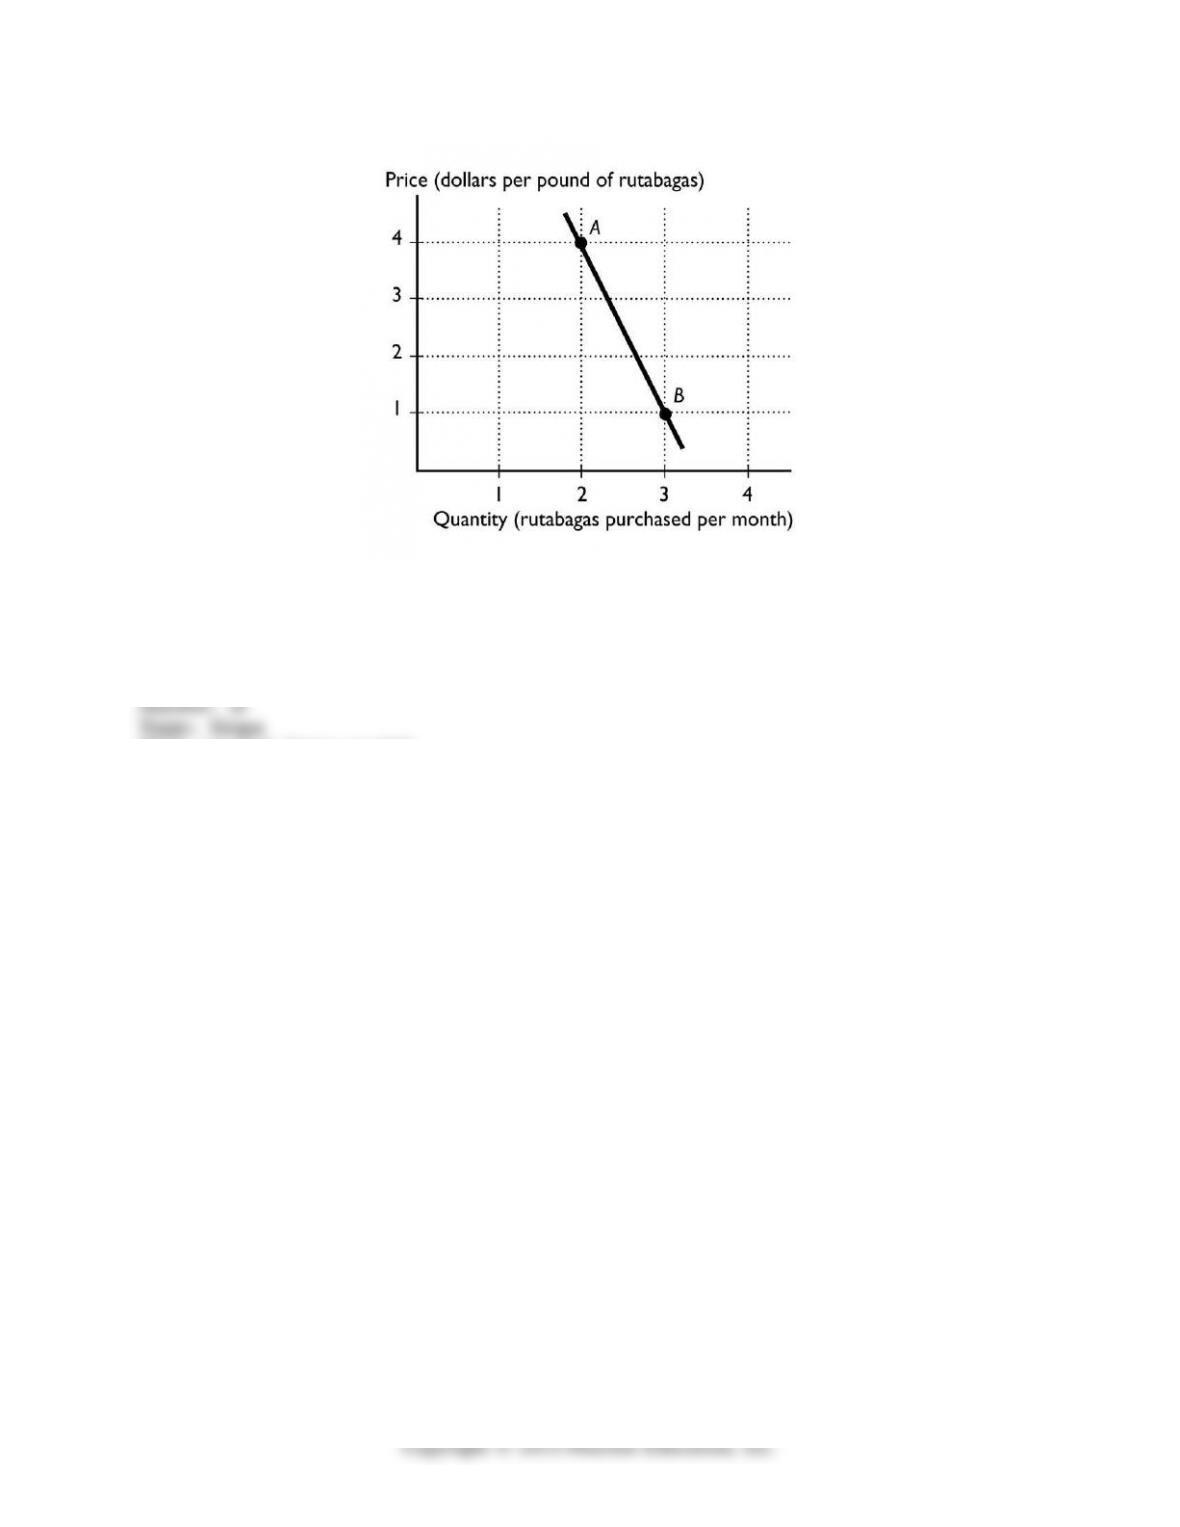
113) What is the slope of the line in the graph?
A) +1/2
B) -1/2
C) + 2
D) -2
E) -3/4
Skill: Level 2: Using deinitions
Section: Chapter 1 Appendix – Checkpoint 3
Status: Old
AACSB: Analytical thinking
99
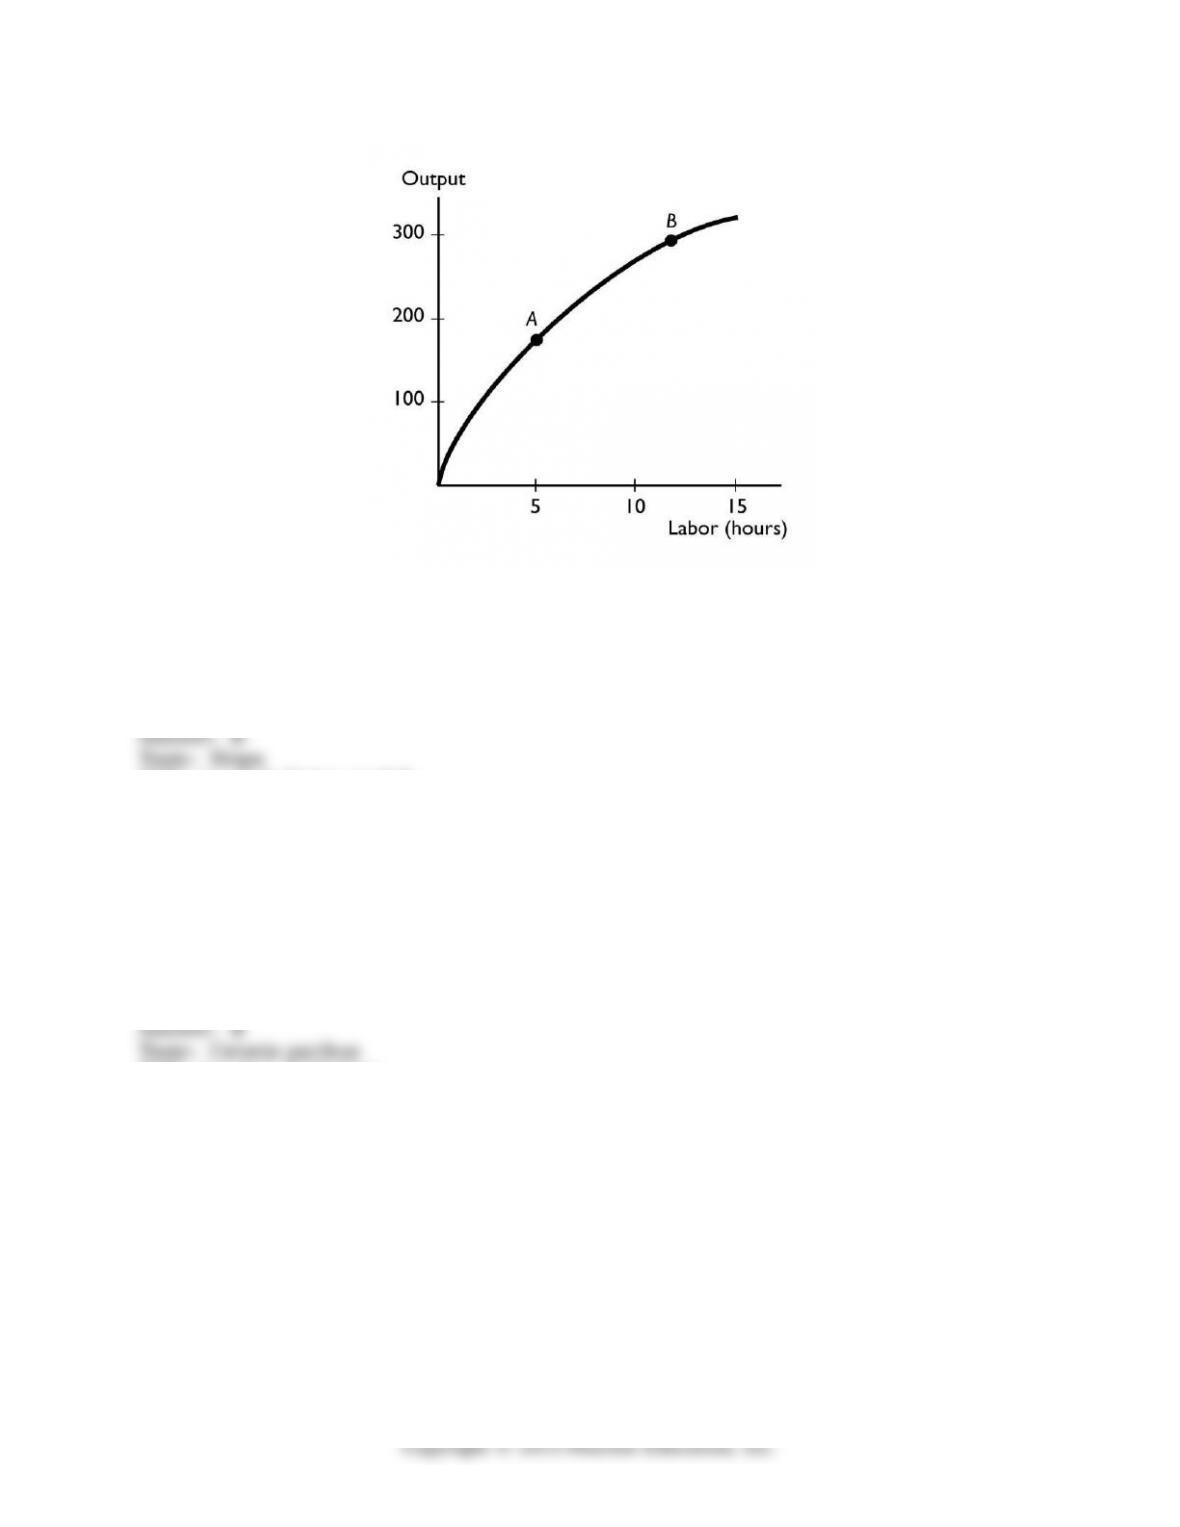
114) The slope of the curve at point B
A) is greater than the slope at point A.
B) is less than the slope at point A.
C) is equal to the slope at point A.
D) cannot be compared with the slope at point A.
E) can be compared with the slope at point A, but more information is needed to determine
if the slope is greater than, less than, or equal to the slope at point A.
Skill: Level 3: Using models
Section: Chapter 1 Appendix – Checkpoint 3
Status: Old
AACSB: Analytical thinking
115) The Latin term “ceteris paribus“ means
A) “false unless proven true.”
B) “other things remaining the same.”
C) “after this, therefore because of this.”
D) “what is true of the whole is not necessarily true of the parts.”
E) “obviously true.”
Skill: Level 1: Deinition
Section: Chapter 1 Appendix – Checkpoint 4
Status: Old
AACSB: Relective thinking
100