
Table 4
Hokie Corporation Comparative Balance Sheet
For the Years Ending March 31, 1995 and 1996
(Millions of Dollars)
Assets 1995 1996
Current assets:
Cash $2 $10
Accounts receivable 16 10
Inventory 22 26
Total current assets $40 $46
Gross fixed assets: $120 $124
Less accumulated depreciation 60 64
Net fixed assets 60 60
Total assets $100 $106
Liabilities and Owners’ Equity
Current liabilities:
Accounts payable $16 $18
Notes payable 10 10
Total current liabilities $26 $28
Long-term debt 20 18
Owners’ equity:
Common stock 40 40
Retained earnings 14 20
Total liabilities and owners’ equity $100 $106
Hokie had net income of $26 million for 1996 and paid total cash dividends of $20 million to
their common stockholders.
96) Calculate the following financial ratios for the Hokie Corporation using the information
given in Table 4 and 1996 information.
current ratio
acid test ratio
debt ratio
long-term debt to total capitalization
return on total assets
return on common equity
Topic: 4.3 Using Financial Ratios
Keywords: financial ratios
Principles: Principle 3: Cash Flows Are the Source of Value
31
97) McKinny Enterprises must raise $580,000 to pay off a bank loan at the end of the year. The
firm expects sales of $5,200,000 for the year. Depreciation for the year is $315,000. The
company’s net profit margin is 5%. Can the company pay off its loan through the retention of
earnings?
Topic: 4.3 Using Financial Ratios
Keywords: cash flow
Principles: Principle 3: Cash Flows Are the Source of Value
98) S.M., Inc. had total sales of $400,000 in 1996 (70 percent of its sales are credit). The
company’s gross profit margin is 10%, its ending inventory is $80,000, and its accounts
receivable is $25,000. What amount of funds can be generated by the company if it increases its
inventory turnover ratio to 10.0 and reduces its average collection period to 20 days?
20 days = (accounts receivable)/[(400,000)(.70)/360 days]
Accounts receivable = (20 × $280,000)/(360) = $15,556
Funds generated by reducing accounts receivable = $25,000 – $15,556 = $9,444
10.0 = [($400,000)(1 – .10)]/(ending inventory)
Ending inventory = ($360,000)/(10.0) = $36,000
Funds generated by reducing inventory = $80,000 – $36,000 = $44,000
Total funds generated = $9,444 + $44,000 = $53,444
Topic: 4.3 Using Financial Ratios
Keywords: financial ratios
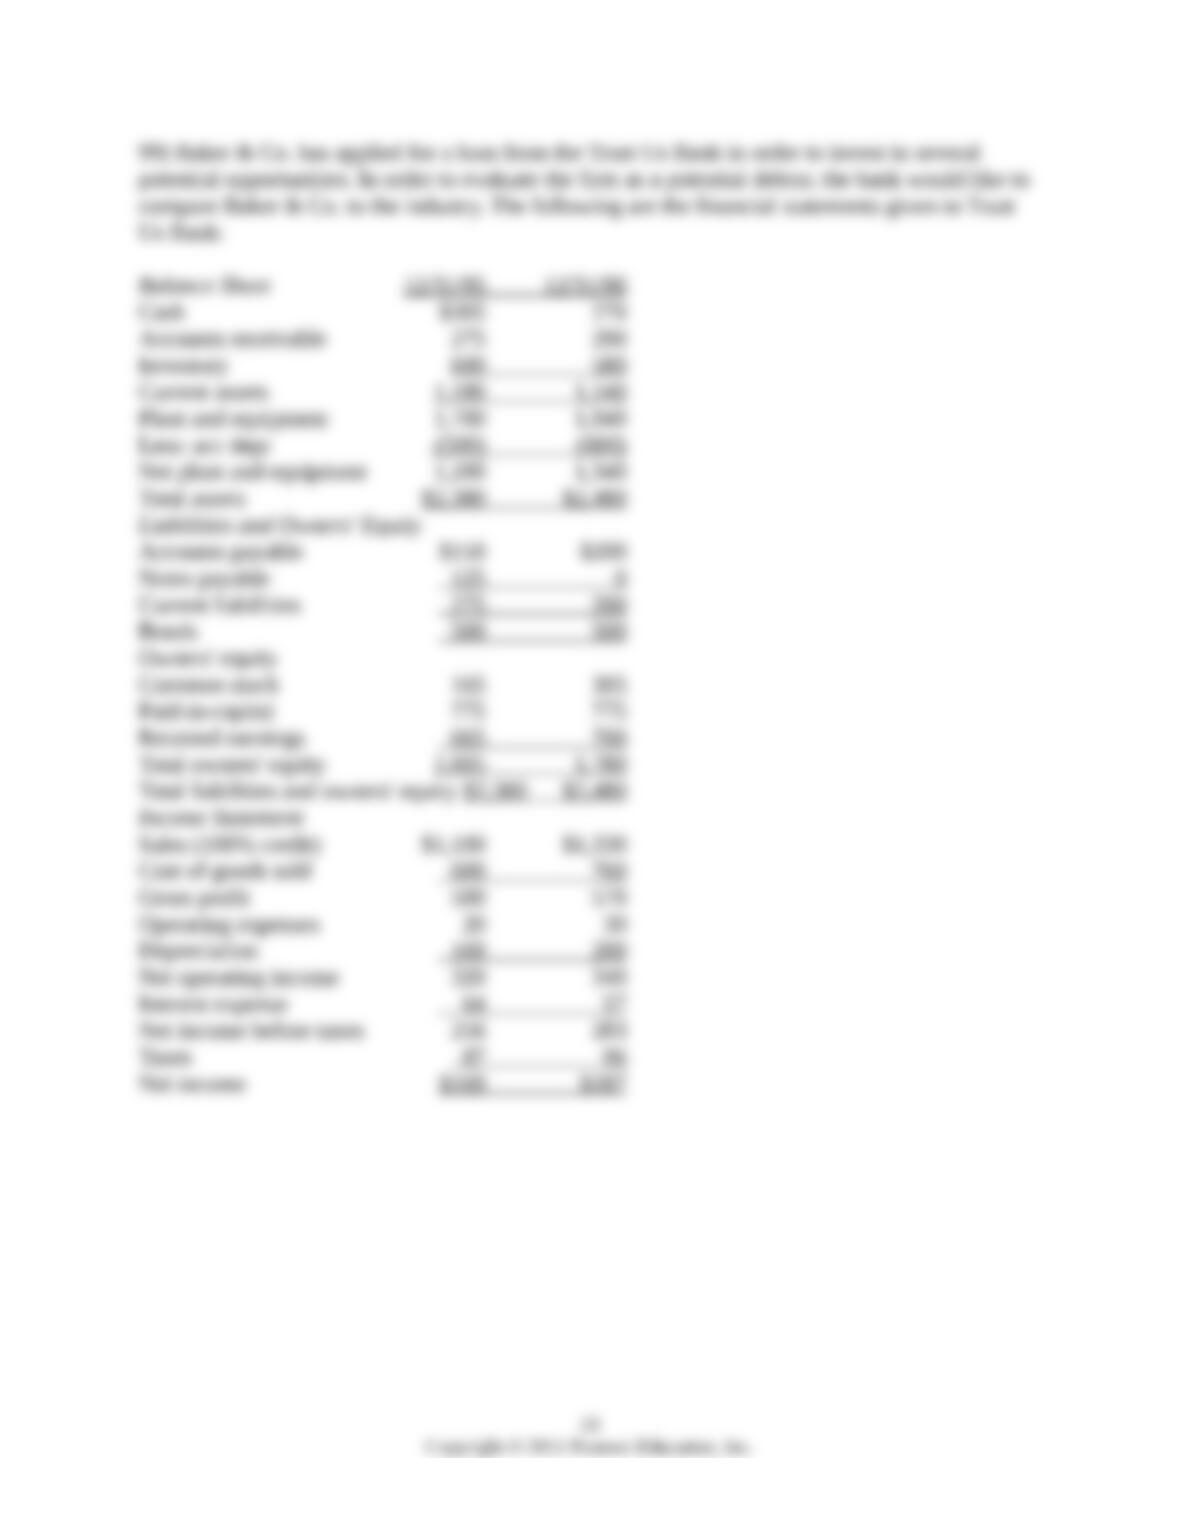
99) Baker & Co. has applied for a loan from the Trust Us Bank in order to invest in several
potential opportunities. In order to evaluate the firm as a potential debtor, the bank would like to
compare Baker & Co. to the industry. The following are the financial statements given to Trust
Us Bank:
Balance Sheet 12/31/95 12/31/96
Cash $305 270
Accounts receivable 275 290
Inventory 600 580
Current assets 1,180 1,140
Plant and equipment 1,700 1,940
Less: acc depr (500) (600)
Net plant and equipment 1,200 1,340
Total assets $2,380 $2,480
Liabilities and Owners’ Equity
Accounts payable $150 $200
Notes payable 125 0
Current liabilities 275 200
Bonds 500 500
Owners’ equity
Common stock 165 305
Paid-in-capital 775 775
Retained earnings 665 700
Total owners’ equity 1,605 1,780
Total liabilities and owners’ equity $2,380 $2,480
Income Statement
Sales (100% credit) $1,100 $1,330
Cost of goods sold 600 760
Gross profit 500 570
Operating expenses 20 30
Depreciation 160 200
Net operating income 320 340
Interest expense 64 57
Net income before taxes 256 283
Taxes 87 96
33
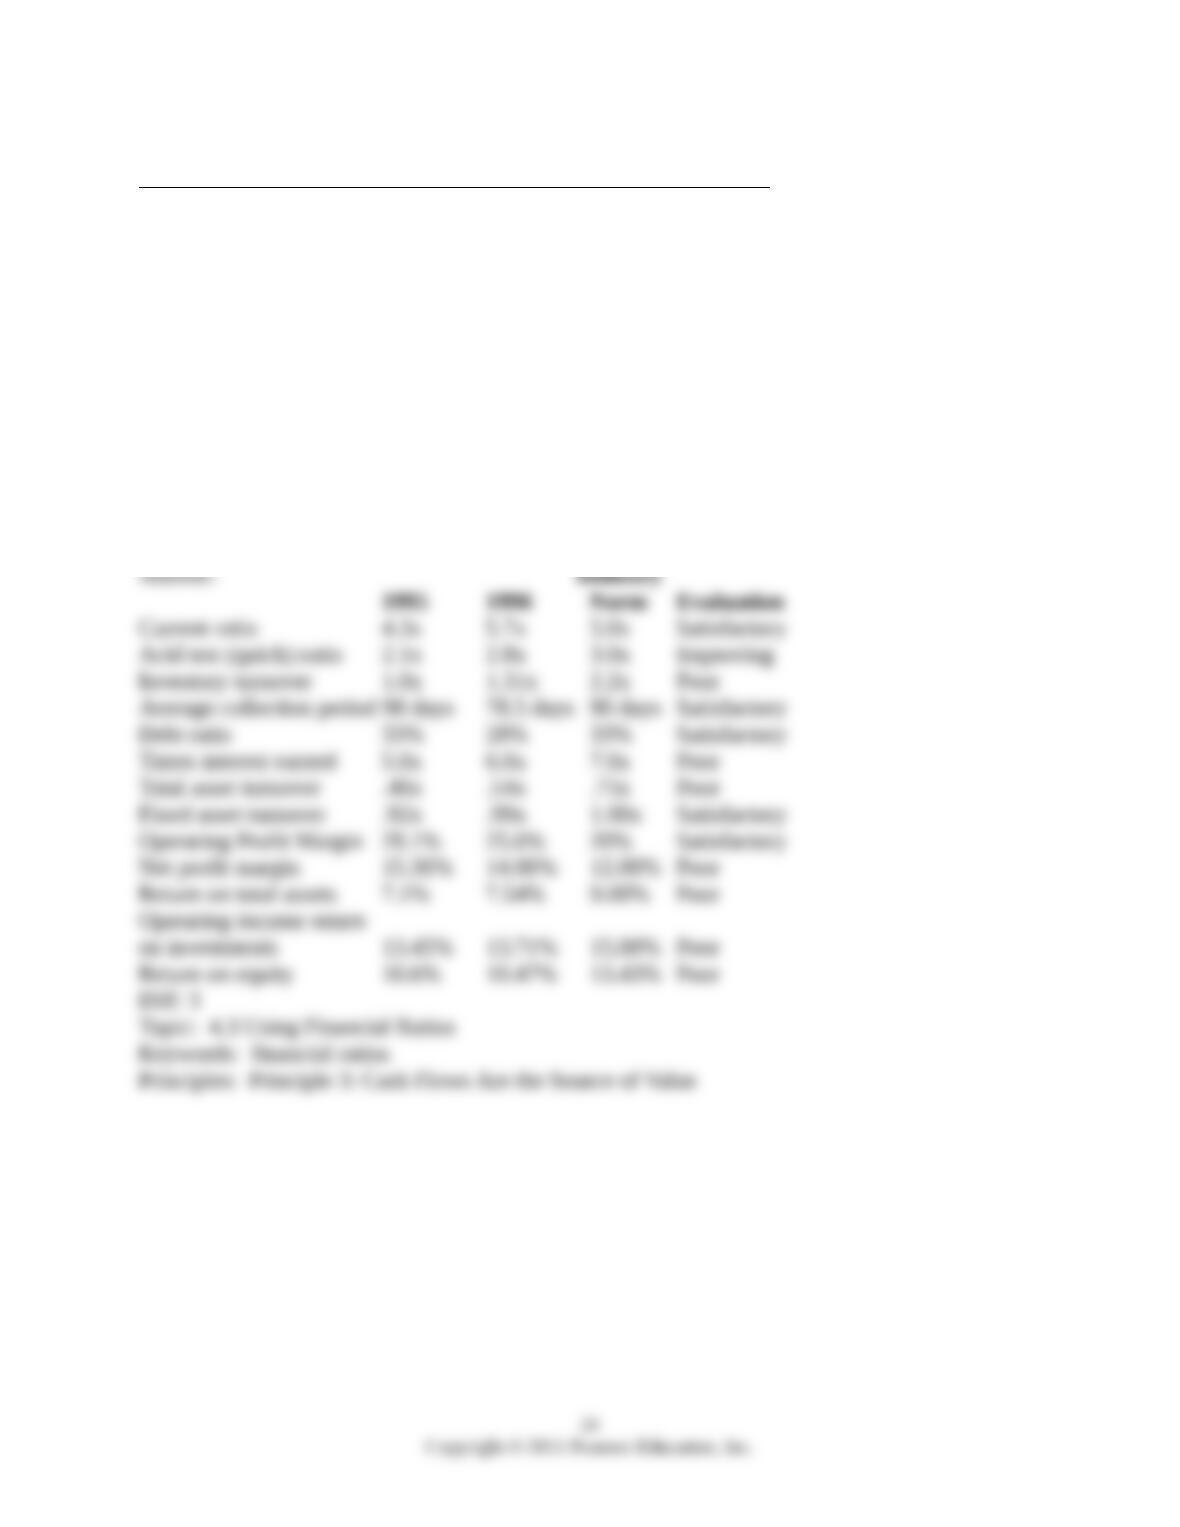
Compute the following ratios:
1995 1996 Industry Norms
Current ratio 5.0
Acid test ratio 3.0
Inventory turnover 2.2
Average collection period 90 days
Debt ratio .33
Times interest earned 7.0
Total asset turnover .75
Fixed asset turnover 1.0
Operating profit margin 20%
Net profit margin 12%
Return on total assets 9.00%
Operating income return on investments 15.00%
Return on equity 10.43%
Topic: 4.3 Using Financial Ratios
Keywords: financial ratios
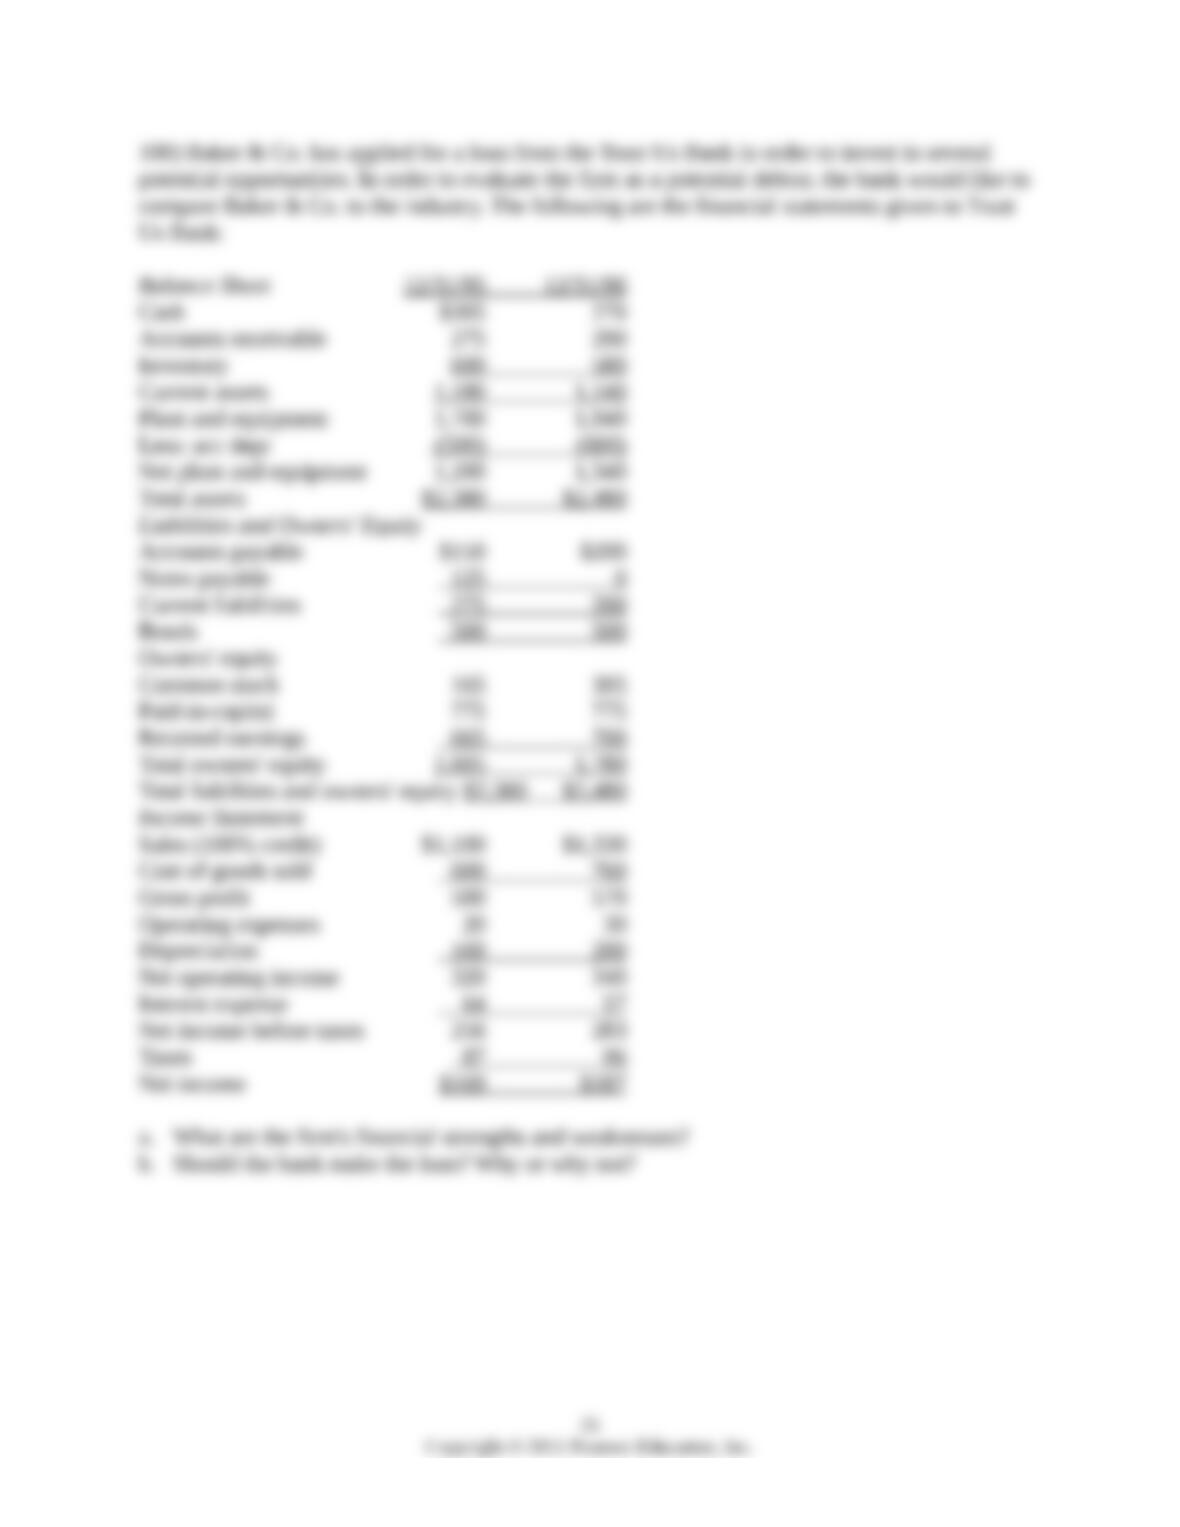
100) Baker & Co. has applied for a loan from the Trust Us Bank in order to invest in several
potential opportunities. In order to evaluate the firm as a potential debtor, the bank would like to
compare Baker & Co. to the industry. The following are the financial statements given to Trust
Us Bank:
Balance Sheet 12/31/95 12/31/96
Cash $305 270
Accounts receivable 275 290
Inventory 600 580
Current assets 1,180 1,140
Plant and equipment 1,700 1,940
Less: acc depr (500) (600)
Net plant and equipment 1,200 1,340
Total assets $2,380 $2,480
Liabilities and Owners’ Equity
Accounts payable $150 $200
Notes payable 125 0
Current liabilities 275 200
Bonds 500 500
Owners’ equity
Common stock 165 305
Paid-in-capital 775 775
Retained earnings 665 700
Total owners’ equity 1,605 1,780
Total liabilities and owners’ equity $2,380 $2,480
Income Statement
Sales (100% credit) $1,100 $1,330
Cost of goods sold 600 760
Gross profit 500 570
Operating expenses 20 30
Depreciation 160 200
Net operating income 320 340
Interest expense 64 57
Net income before taxes 256 283
Taxes 87 96
Net income $169 $187
a. What are the firm’s financial strengths and weaknesses?
b. Should the bank make the loan? Why or why not?
35
1) Which of the following industries has the highest average inventory turnover ratio?
A) Retail clothing stores
B) Jewelry stores
C) Automobile dealerships
D) Supermarkets
Topic: 4.4 Selecting a Performance Benchmark
Keywords: benchmarks
Principles: Principle 3: Cash Flows Are the Source of Value
36

2) Which of the following would be most responsible for a company’s average collection period
being higher than the industry average?
A) If a company’s growth in sales is greater than the growth of sales in the industry.
B) Being more aggressive in collecting its accounts receivable than its competitors.
C) Having credit policy standards that are more restrictive than its competitors.
D) Being more lenient in extending credit to its customers than its competitors.
E) None of the above.
Topic: 4.4 Selecting a Performance Benchmark
Keywords: financial ratios
Principles: Principle 3: Cash Flows Are the Source of Value
3) When the present financial ratios of a firm are compared with similar ratios for another firm in
the same industry, it is called trend analysis.
Topic: 4.4 Selecting a Performance Benchmark
Keywords: benchmarks
Principles: Principle 3: Cash Flows Are the Source of Value
4) Firms that engage in multiple lines of business make it difficult to assign them to an industry
category for ratio analysis.
Topic: 4.4 Selecting a Performance Benchmark
Keywords: benchmarks
Principles: Principle 3: Cash Flows Are the Source of Value
1) Which of the following is NOT a reason why financial analysts use ratio analysis?
A) Ratios help to pinpoint a firm’s strengths.
B) Ratios restate accounting data in relative terms.
C) Ratios are ideal for smoothing out the differences that may exist when comparing firms that
use different accounting practices.
D) Some of a firm’s weaknesses can be identified through the usage of ratios.
Topic: 4.5 Limitations of Ratio Analysis
Keywords: financial ratios
Principles: Principle 3: Cash Flows Are the Source of Value
37

2) Which of the following is NOT a limitation related to the usage of ratios when reviewing a
firm’s performance?
A) Many firms experience seasonality in their operations.
B) Ratios cannot be used to compare firms that are in the same industry if one firm’s sales are
higher than another firm’s.
C) Some firms operate in a variety of business lines, which makes it difficult to make
comparisons.
D) Accounting practices differ widely among firms.
Topic: 4.5 Limitations of Ratio Analysis
Keywords: financial ratios
Principles: Principle 3: Cash Flows Are the Source of Value
3) Which of the following statements is FALSE?
A) The calculation of the accounts receivable average collection period (ACP) would generally
produce a more realistic assessment of how a firm is managing its accounts receivable if the
analyst were to calculate the ACP for each month and average the results, than if the analyst were
to solely use the fiscal year-end accounts receivable value.
B) If an analyst were to compare the inventory turnover of one firm to that of another, the
comparison can be distorted if the two firms use different methods of valuing ending inventory.
C) Assume that two firms are in the same industry and one reports a higher debt ratio than the
other. We can safely say that the firm that has the highest debt ratio is the riskier of the two firms.
D) A firm that has a current ratio that is significantly above the industry norm will, as a direct
consequence, also have a significantly better return on assets than if its current ratio was below
the industry norm.
E) All of the above statements are true.
Topic: 4.5 Limitations of Ratio Analysis
Keywords: financial ratios
Principles: Principle 3: Cash Flows Are the Source of Value
4) A serious pitfall in the interpretation of financial ratios arises when a company, whose
business is seasonal, ends its accounting year on March 31, while most companies in the same
industry end their accounting period on December 31.
Topic: 4.5 Limitations of Ratio Analysis
Keywords: financial ratios
Principles: Principle 3: Cash Flows Are the Source of Value
38
5) Differences in accounting practices limit the use of ratio analysis.
Topic: 4.5 Limitations of Ratio Analysis
Keywords: financial ratios
Principles: Principle 3: Cash Flows Are the Source of Value
6) Discuss the limitations of ratio analysis.
Topic: 4.5 Limitations of Ratio Analysis
Keywords: financial ratios
Principles: Principle 3: Cash Flows Are the Source of Value
39