Chapter 10 – Forecasting
10-1
True / False Questions
1. Forecasts are rarely perfect.
2. Once accepted by managers, forecasts should not be overridden.
3. Statistical models to forecast economic trends are called econometric models.
5. The mean absolute deviation is the sum of the absolute value of forecasting errors divided
by the number of forecasts.
6. The mean square error is the square of the mean of the absolute deviations.

Chapter 10 – Forecasting
7. The mean absolute deviation is more sensitive to large deviations than the mean square
error.
8. The seasonal factor for any period of a year measures how that period compares to the
same period last year.
9. Removing the seasonal component from a time-series can be accomplished by dividing
each value by its appropriate seasonal factor.
10. The last-value forecasting method requires a linear trend line.
11. The last-value forecasting method is most useful when conditions are stable over time.
12. The averaging method uses all the data points in the time-series.
13. A moving-average forecast tends to be more responsive to changes in the time-series data
when more values are included in the average.
14. The moving-average forecasting method assigns equal weights to each value that is
represented by the average.

10-3
15. The moving-average forecasting method is a very good one when conditions remain pretty
much the same over the time period being considered.
16. An advantage of the exponential smoothing forecasting method is that more recent
experience is given more weight than less recent experience.
17. A smoothing constant of 0.1 will cause an exponential smoothing forecast to react more
quickly to a sudden change than a value of 0.3 will.
18. If significant changes in conditions are occurring relatively frequently, then a smaller
smoothing constant is needed.
19. Exponential smoothing with trend requires selection of two smoothing constants.
20. Exponential smoothing with trend was designed for time-series that have great variability
both up and down.
21. Forecasting techniques such as moving-average, exponential smoothing, and the last-value
method all represent averaged values of time-series data.


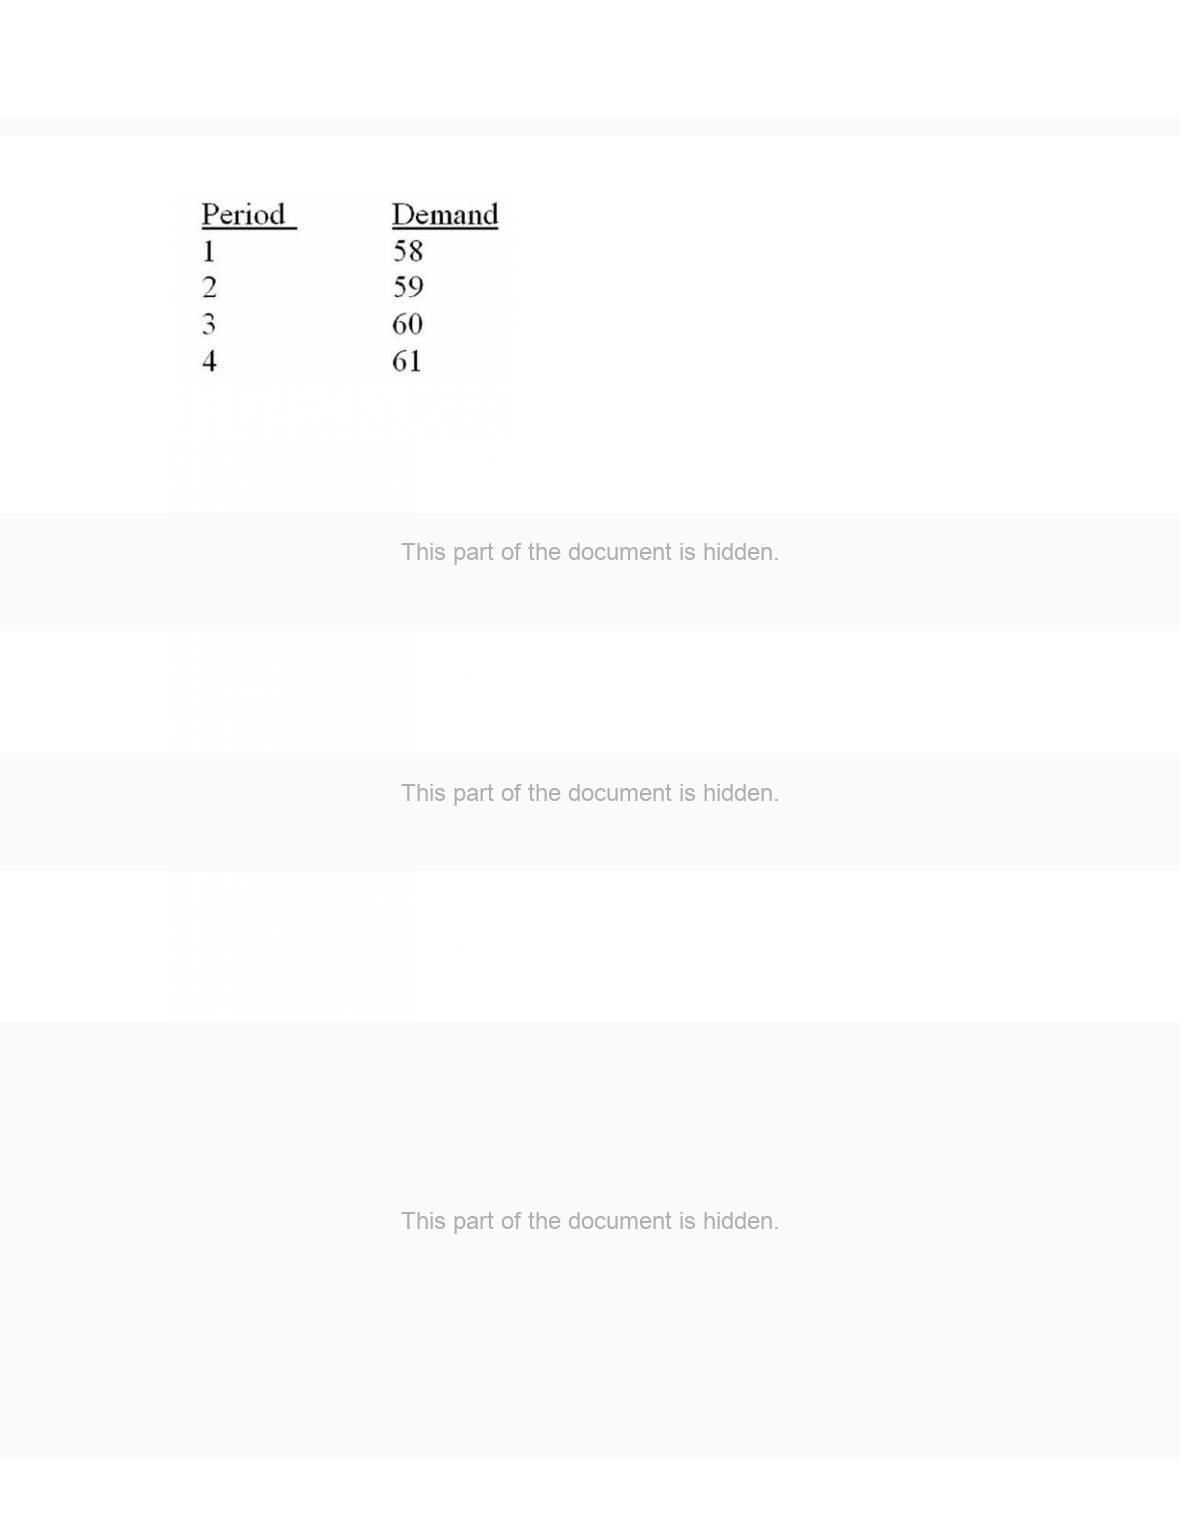
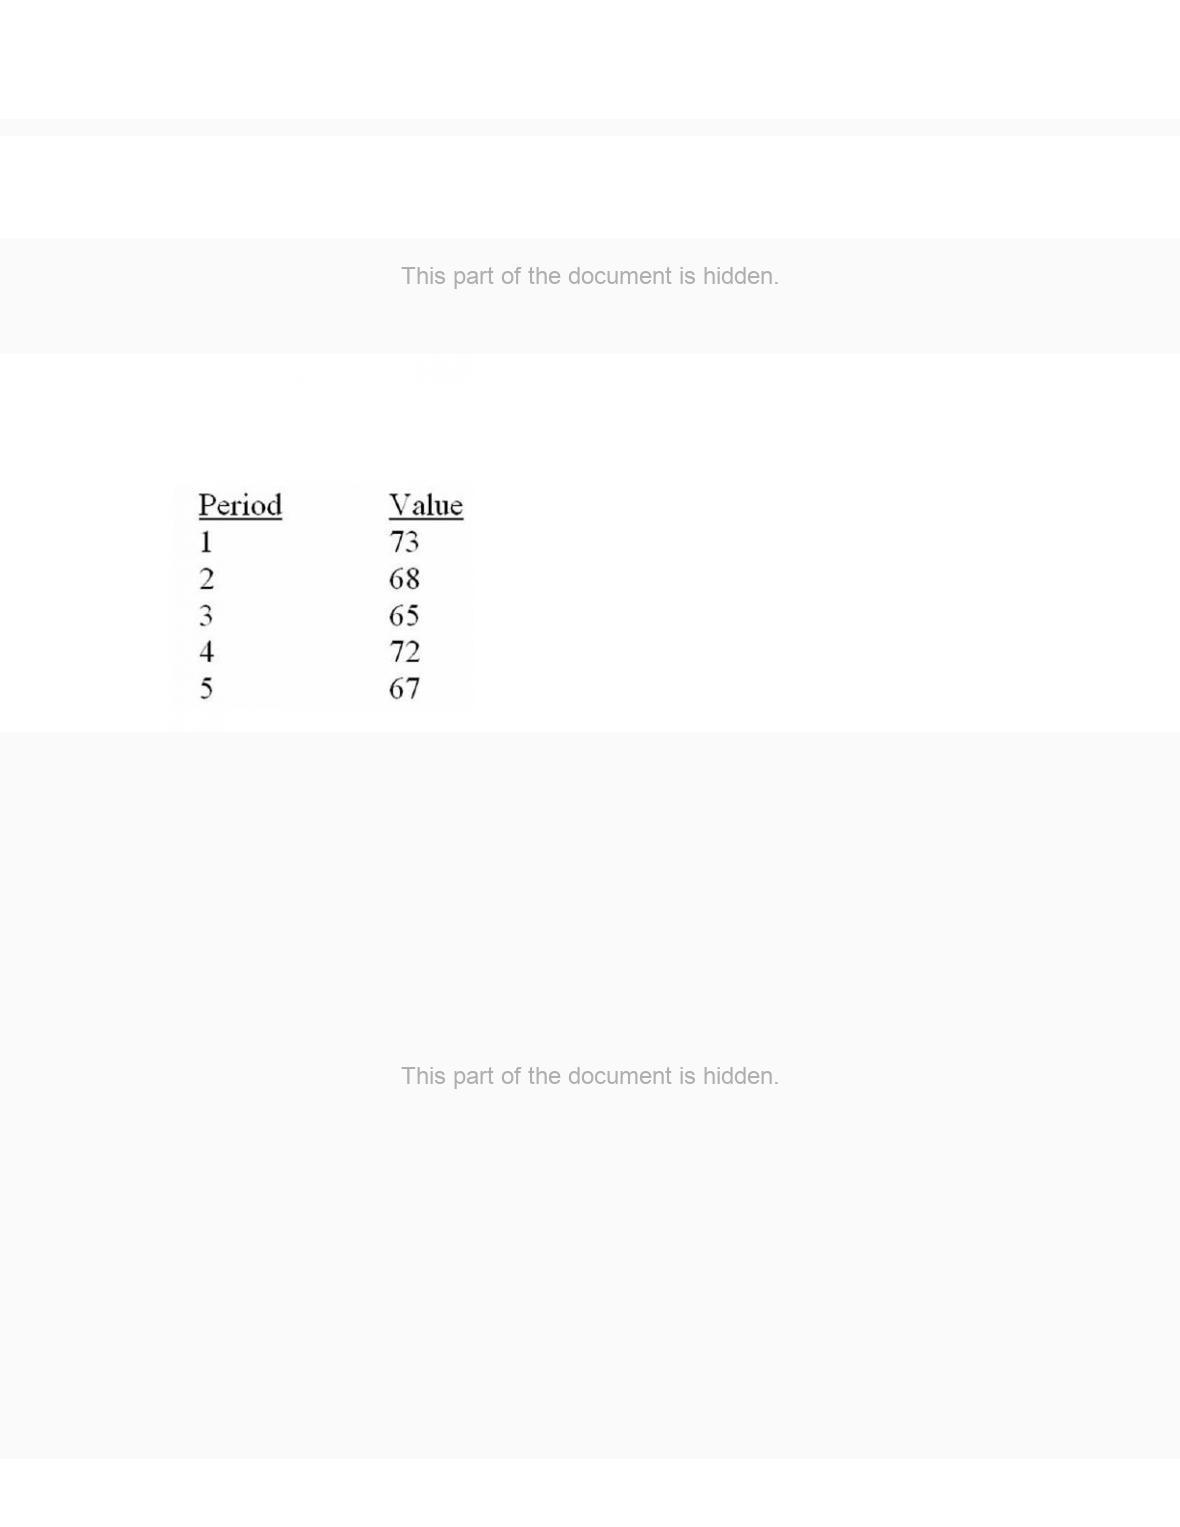
10–11
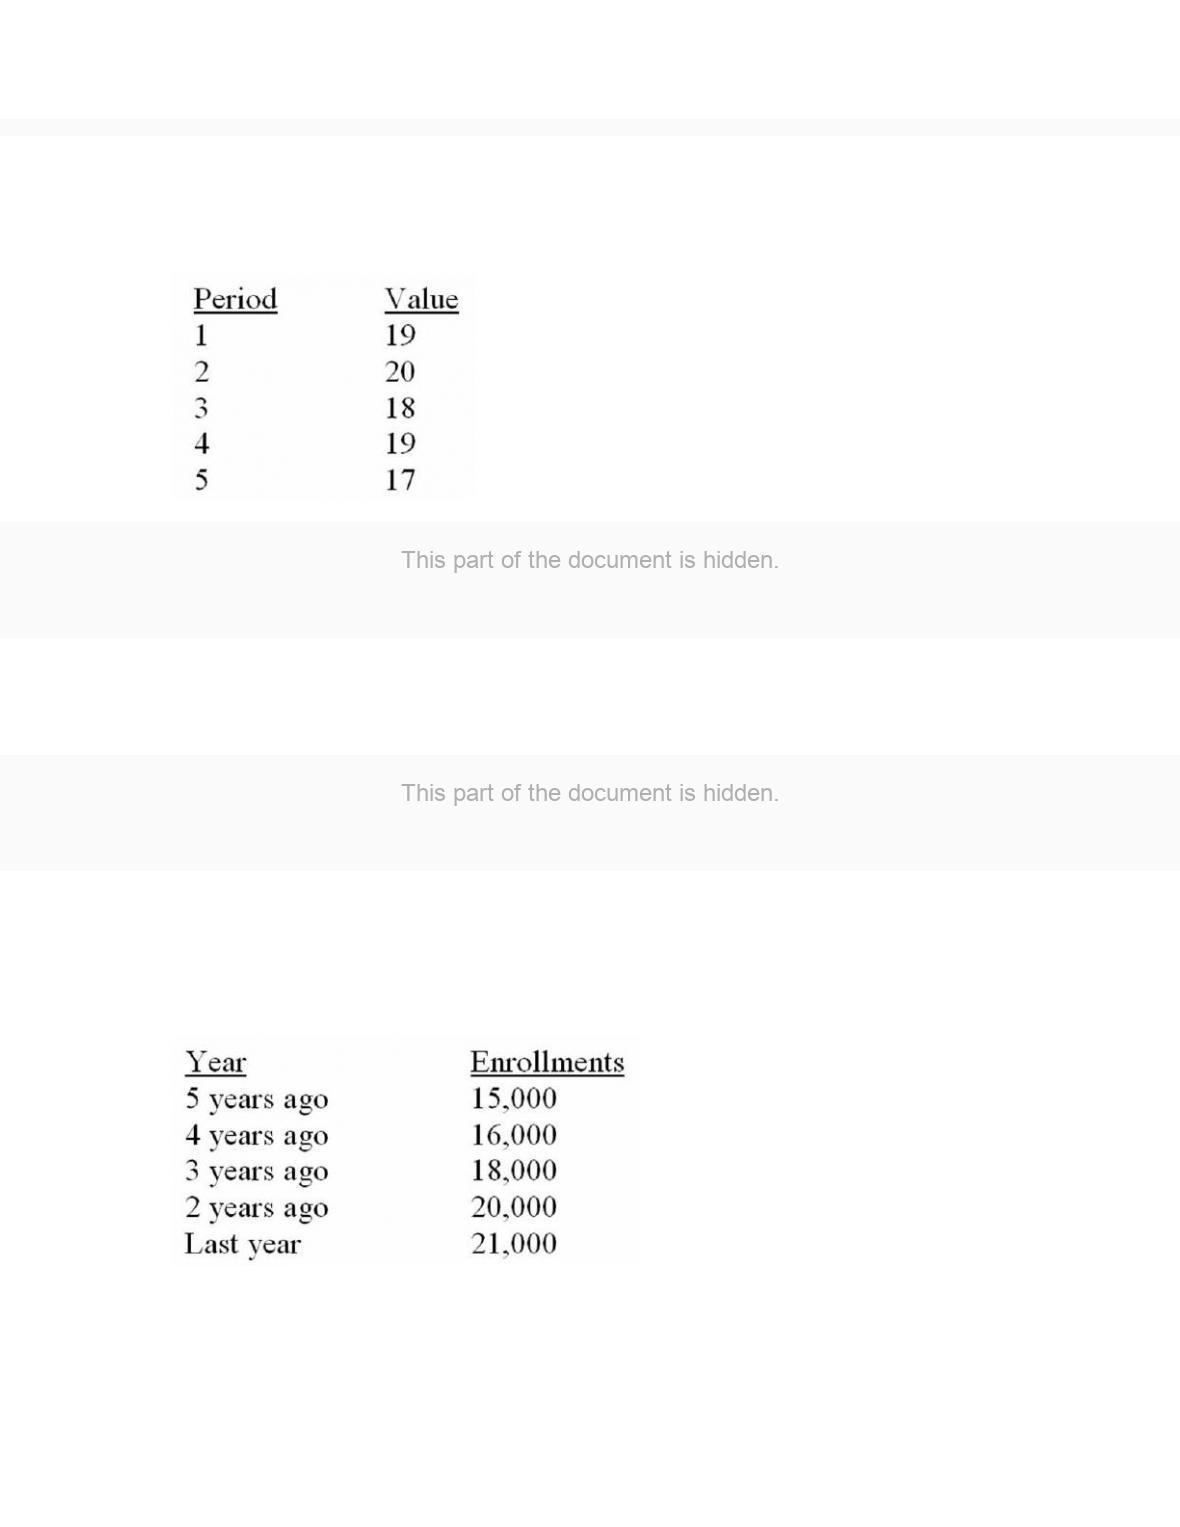
53. Given the following historical data, what is the moving-average forecast for period 6
based on the last three periods?
54. Given forecast errors of -5, -10, and 15, what is the mean absolute deviation?
E. None of the above.
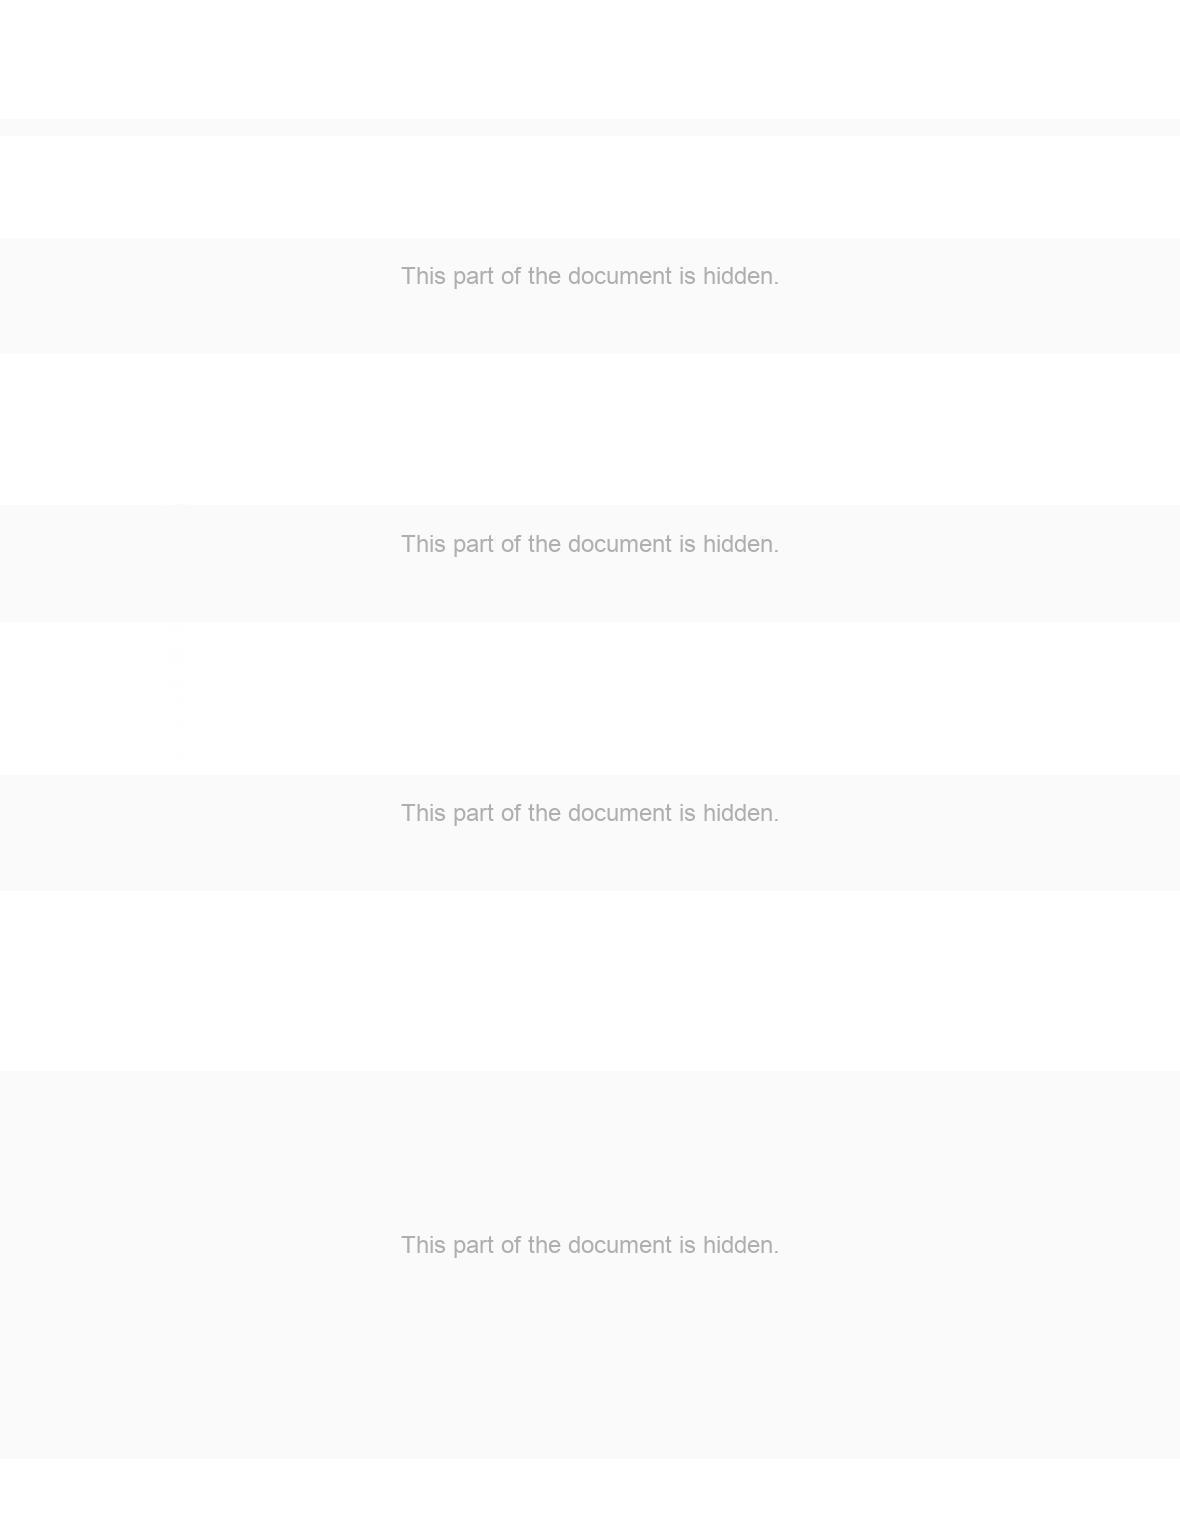
The president of State University wants to forecast student enrollment for this academic year
based on the following historical data:
Chapter 10 – Forecasting
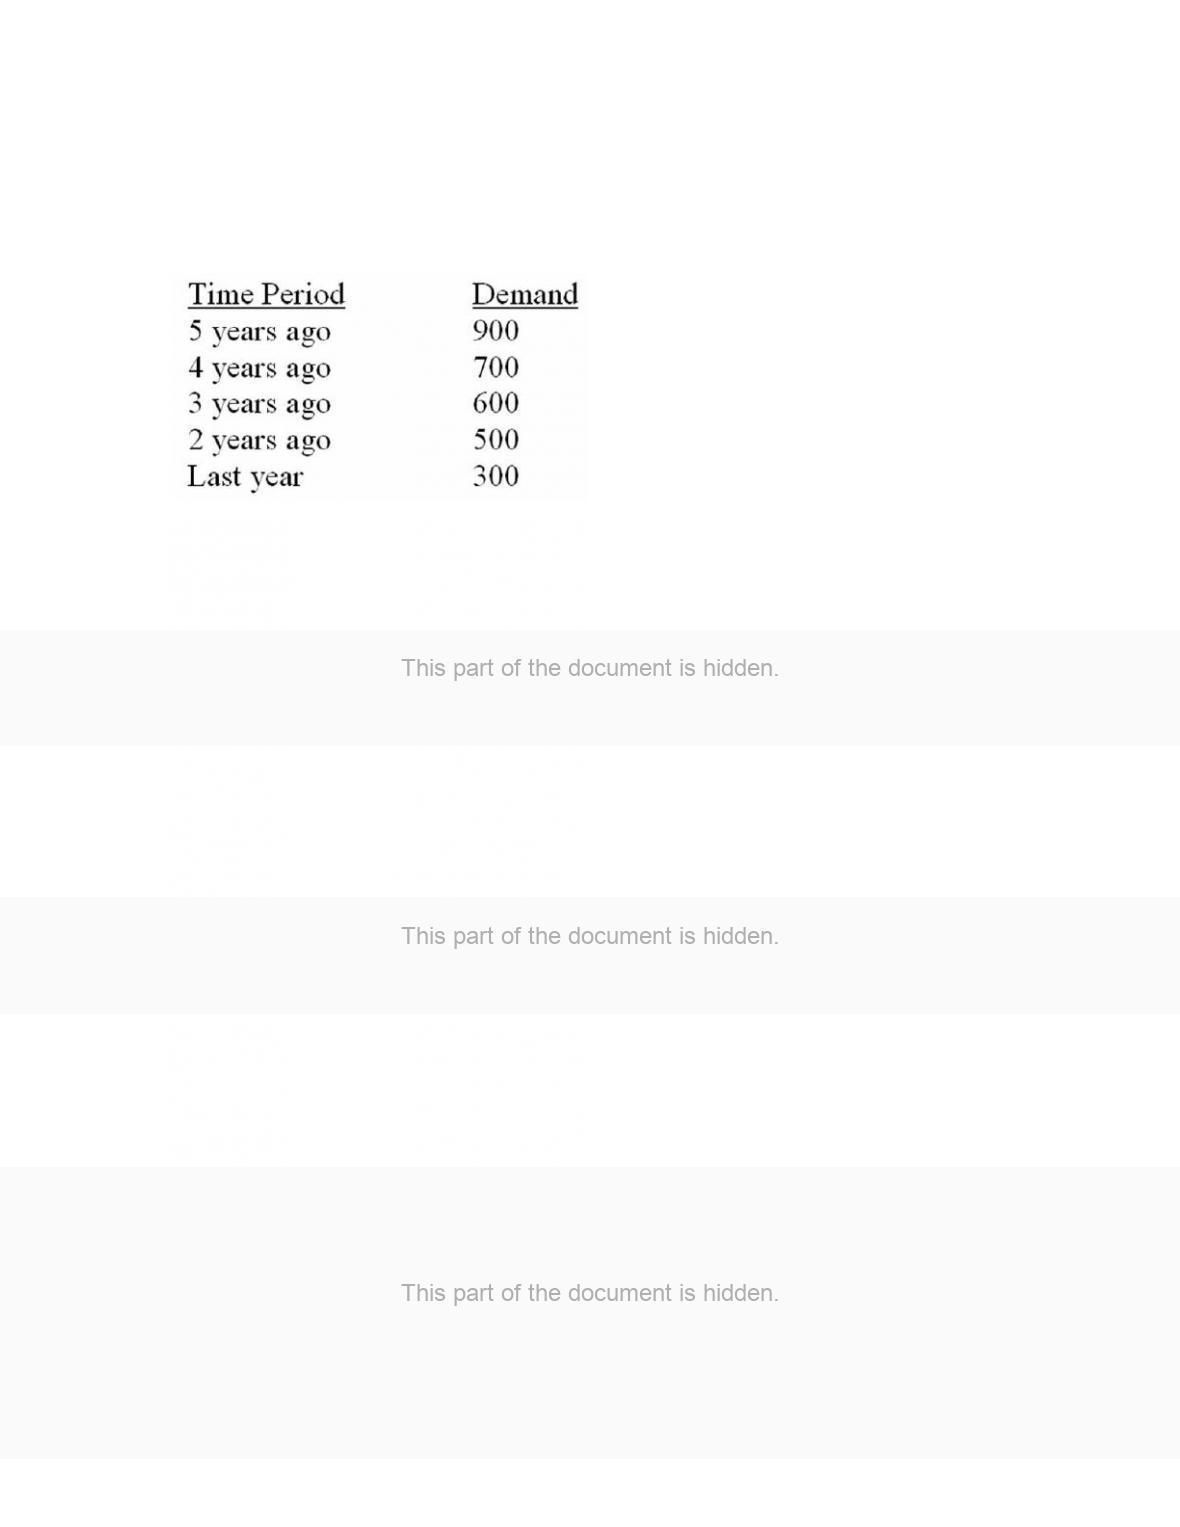
The business analyst for Ace Business Machines, Inc. wants to forecast this year’s demand
for manual typewriters based on the following historical data:
59. What is the forecast for this year using the last-value forecasting method?
60. What is the forecast for this year using a moving-average forecast based on the last three
years?
61. What is the forecast for this year using exponential smoothing with = 0.4, if the forecast
for two years ago was 750?
Chapter 10 – Forecasting
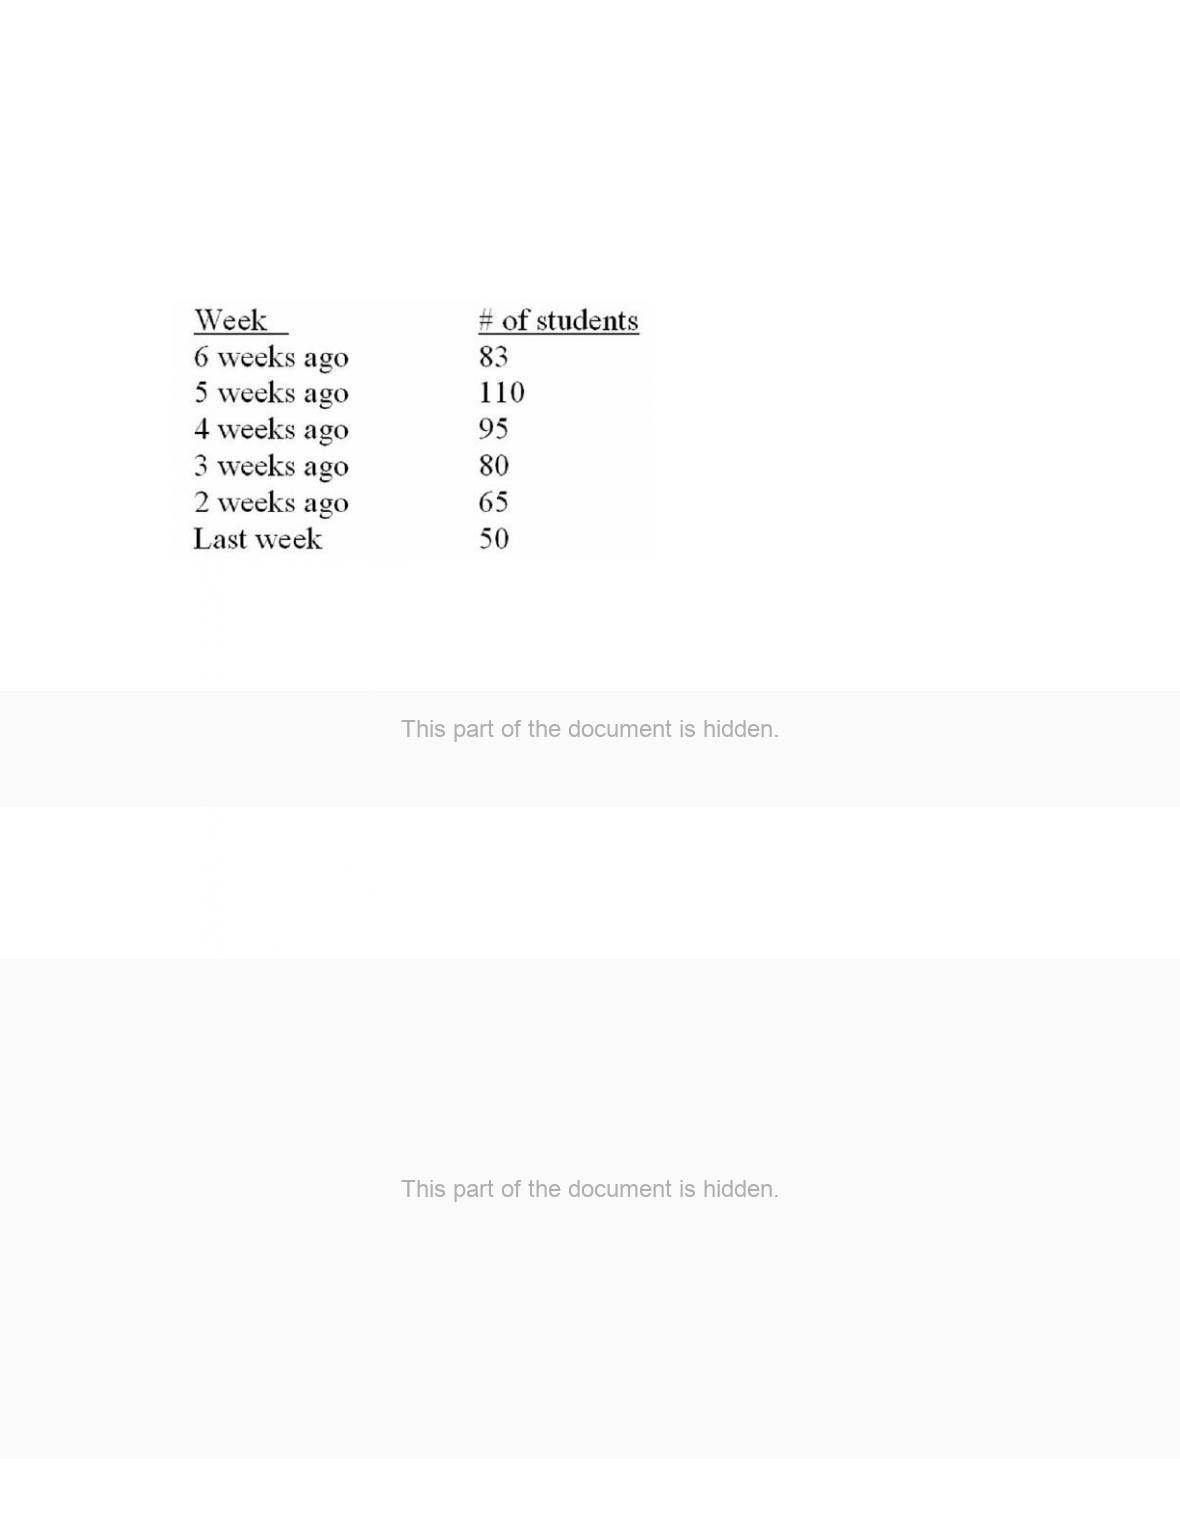
Professor Z needs to allocate time among several tasks next week to include time for
students’ appointments. Thus, he needs to forecast the number of students who will seek
appointments. He has gathered the following data:
62. What is the forecast for this year using the last-value forecasting method?
63. What is the forecast for this year using a moving-average forecast based on the last three
weeks?
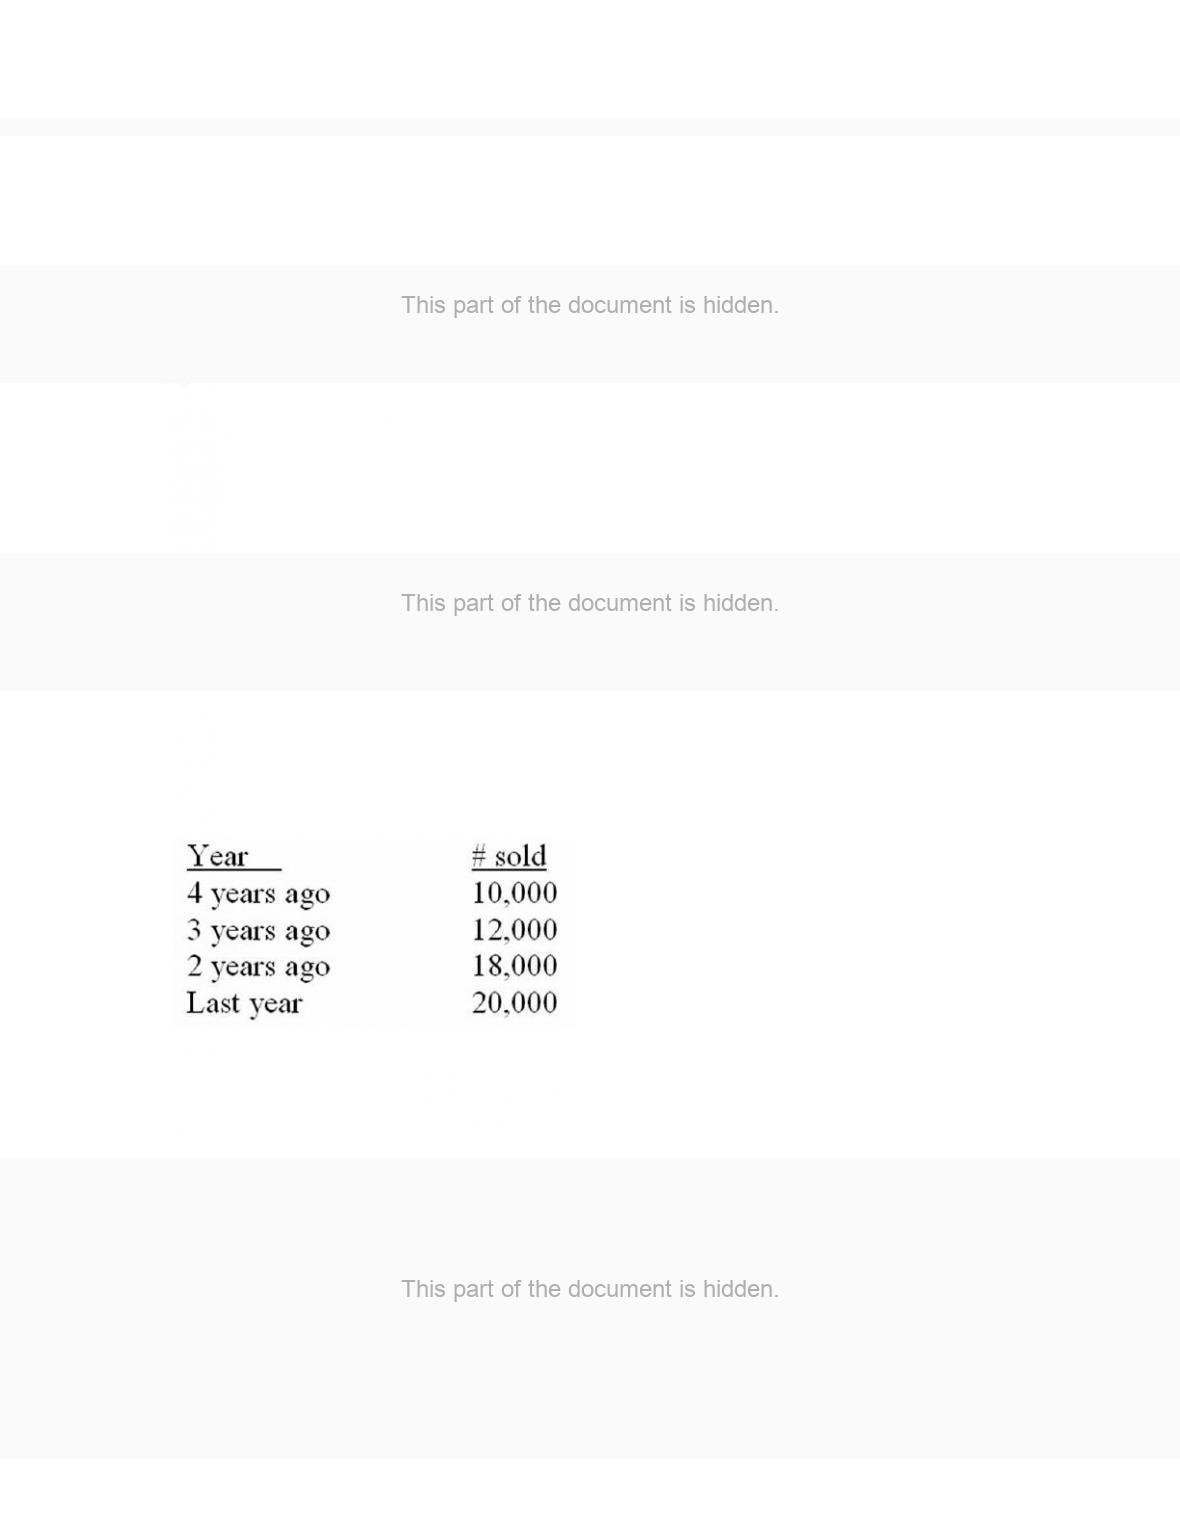
10–16
67. What is the forecast for this year using a moving-average forecast based on the last four
years?
68. What is the forecast for this year using exponential smoothing with = 0.2, if the forecast
for last year was 15,000?
69. The previous trend line has predicted 18,500 for two years ago, and 19,700 for last year.
What was the mean absolute deviation for these forecasts?
70. A manager uses the equation y = 40,000 + 150x to predict monthly receipts. What is the
forecast for July if x = 0 in April?