Chapter 18
COST BEHAVIOR AND COST–VOLUME-PROFIT ANALYSIS
True/False Questions
1. Total variable costs change in proportion to changes in volume of activity.
2. Variable costs per unit increase proportionately with increases in volume of activity.
3. Dividing a mixed cost into its separate fixed and variable cost components makes it more
difficult to perform cost-volume-profit analysis.
4. As the volume increases, fixed cost per unit of output remains constant.
5. As the level of volume of activity increases, the variable cost per unit remains constant.
6. A step-wise variable cost can be separated into a fixed component and a variable
component.
7. Curvilinear costs increase as volume of activity increases, but at a nonconstant rate.
8. The relevant range of operations includes extremely high and low levels of production that
are unlikely to occur.
9. The relevant range of operations is a range of volume neither close to zero nor at maximum
capacity.
10. Cost-volume-profit analysis requires management to classify all costs as either fixed or
variable with respect to production or sales volume within the relevant range of operations.
11. Cost-volume-profit analysis is a precise tool for determining the profit consequences of
future cost changes, price changes, and volume of activity changes.
12. Cost-volume-profit analysis is used to predict future costs to be incurred, volumes of
activity, sales to be made, and profit to be earned.
13. Cost-volume-profit analysis can be used to compute expected income from predicted sales
and cost levels.
14. The margin of safety is the amount that sales can drop before the company incurs a loss.
15. The dollar amount of sales needed to achieve a target income is computed by dividing the
sum of fixed costs plus the target income by the contribution margin ratio.
16. The margin of safety can be expressed in units of product, in dollars, or as a percent of
sales.
17. The method most likely to produce the most precise line of cost behavior and require the
least amount of judgment is the scatter diagram.
18. Contribution margin per unit is the amount by which a product’s unit selling price exceeds
its total variable cost per unit.
19. The contribution margin ratio is the percent of each sales dollar that remains after
deducting the total unit variable cost.
20. The extent, or relative size, of fixed costs in the total cost structure is known as operating
leverage.
21. Degree of operating leverage (DOL) is defined as total contribution margin in dollars
divided by pretax income.
22. Least-squares regression is a statistical method for identifying cost behavior.
23. The high-low method of deriving an estimated cost line uses all the data points available.
24. The high-low method can be used to estimate the cost equation using just two points.
25. A visual line fit to points in a scatter diagram may be used to identify the approximate
relation between past cost and unit data.
26. There are only two methods to derive an estimated line of cost behavior; the high-low
method and the scatter diagram.
27. Scatter diagrams plot volume (units) on the vertical axis and cost on the horizontal axis.
28. To determine the slope of the variable cost from a scatter diagram, divide the change in
units by the change in cost.
29. The high-low method is used to derive the variable cost per unit and total fixed costs using
just the highest and lowest volume levels.
30. A break-even point can be calculated either in units or in dollars.
31. The basic form of cost-volume-profit analysis is often called break-even analysis.
32. The break-even point is the sales level at which a company neither earns a profit nor
incurs a loss.
33. The contribution margin per unit is the price at which a unit must be sold in order for the
company to break even.
34. To calculate the break-even point in units, one must know unit fixed cost, unit variable
cost, and sales price.
35. The contribution margin ratio is the percent by which the margin of safety exceeds the
break-even point.
36. A graphic depiction of the break-even point is known as a cost-volume-profit (CVP)
chart.
37. A cost-volume-profit (CVP) chart is a graph that plots number of units produced on the
horizontal axis and dollars of costs and sales on the vertical axis.
38. On a typical cost-volume-profit graph, unit sales are shown on the horizontal axis and
both dollars of sales and dollars of costs are represented on the vertical axis.
39. Cost-volume-profit analysis cannot be used when a firm produces and sells more than one
product.
40. The proportion of sales volumes for various products in a multiproduct company is known
as the composite mix.
41. An important assumption in multiproduct CVP analysis is a constant sales mix.
42. A cost that remains unchanged in total despite variations in volume of activity within a
relevant range is a:
A. Fixed cost.
B. Curvilinear cost.
C. Variable cost.
D. Step-wise variable cost.
E. Standard cost.
43. A cost that changes in proportion to changes in volume of activity is a(n):
A. Differential cost.
B. Fixed cost.
C. Incremental cost.
D. Variable cost.
E. Product cost.
44. A cost that changes as volume changes, but at a nonconstant rate, is called a:
A. Variable cost.
B. Curvilinear cost.
C. Step-wise variable cost.
D. Fixed cost.
E. Differential cost.
45. A cost with a flat cost line within a relevant range that shifts to another level when volume
significantly changes is a(n):
A. Step-wise cost.
B. Fixed cost.
C. Curvilinear cost.
D. Incremental cost.
E. Flat line cost.

46. A cost that includes both fixed and variable cost components is called a:
A. Mixed cost.
B. Step-variable cost.
C. Composite cost.
D. Curvilinear cost.
E. Differential cost.
47. Curvilinear costs always increase:
A. With decreases in volume.
B. In constant proportion to changes in production levels.
C. When management performs break-even analysis.
D. When volume increases, but at a nonconstant rate.
E. On a per unit basis when volume of activity goes down.

48. Which one of the following statements is not true?
A. Total fixed costs remain the same regardless of volume within the relevant range.
B. Total variable costs change with volume.
C. Total variable costs decrease as the volume increases.
D. Fixed costs per unit increase as the volume decreases.
E. Variable costs per unit remain the same regardless of the volume.
49. An important tool in predicting the volume of activity, the costs to be incurred, the sales to
be made, and the profit to be earned is:
A. Target income analysis.
B. Cost-volume-profit analysis.
C. Least-squares regression analysis.
D. Variance analysis.
E. Process costing.
50. Select cost information for Seacrest Enterprises is as follows:
1,000 units of output
5,000 units of output
Total
Cost/Unit
Total
Cost/Unit
Direct materials $5,000 $5.00 $25,000 $5.00
Utilities expense $1,000 $1.00 $ 3,750 $0.75
Rent expense $4,000 $4.00 $ 4,000 $0.80
Based on this information:
A. Both direct materials and rent expense are variable costs.
B. Utilities expense is a mixed cost and rent expense is a variable cost.
C. Utilities expense is a mixed cost and rent expense is a fixed cost.
D. Direct materials is a fixed cost and utilities expense is a mixed cost.
E. Both direct materials and utilities expense are mixed costs.
51. Select cost information for Klondike Corporation is as follows:
1,000 units of output
2,000 units of output
Total
Cost/Unit
Total
Cost/Unit
Direct materials $4,000 $4.00 $8,000 $4.00
Rent expense $2,000 $2.00 $ 2,000 $1.00
Based on this information:
A. Both direct materials and rent expense are variable costs.
B. Direct materials is a fixed cost and rent expense is a variable cost.
C. Both direct materials and rent expense are fixed costs..
D. Direct materials is a variable cost and rent expense is a fixed cost.
E. Both direct materials and utilities expense are mixed costs.
52. Which of the following costs are most likely to be classified as variable?
A. Factory rent
B. Manager salaries
C. Insurance
D. Direct materials
E. Straight-line depreciation
53. Which of the following costs are most likely to be classified as fixed?
A. Shipping costs
B. Sales commissions
C. Direct labor
D. Direct materials
E. Property taxes
54. A company’s normal operating range, which excludes extremely high or low operating
levels that are not likely to occur, is called the:
A. Margin of safety.
B. Contribution range.
C. Break-even point.
D. Relevant range.
E. High-low point.

55. A term describing a firm’s normal range of operating activities is:
A. Relevant range of operations.
B. Break-even level of operations.
C. Margin of safety of operations.
D. Relevant operating analysis.
E. High-low level of operations.
56. Cost-volume-profit analysis is based on necessary assumptions. Which of the following is
not one of these assumptions?
A. Costs can be classified as variable or fixed.
B. Relevant range includes all possible levels of activity that a company might experience.
C. Sales price and variable costs per unit of output remain constant as volume changes.
D. A constant sales mix in a multiproduct company.
E. Total fixed costs are held constant.

57. A target income refers to:
A. Income at the break-even point.
B. Income from the most recent period.
C. Income planned for a future period.
D. Income only in a multiproduct environment.
E. Income at the minimum contribution margin.
58. The margin of safety is the excess of:
A. Break-even sales over expected sales.
B. Expected sales over variable costs.
C. Expected sales over fixed costs.
D. Fixed costs over expected sales.
E. Expected sales over break-even sales.
59. If a firm’s forecasted sales are $250,000 and its break-even sales are $190,000, the margin
of safety in dollars is:
A. $ 60,000.
B. $250,000.
C. $190,000.
D. $440,000.
E. $ 24,000.
60. The excess of expected sales over the sales level at the break-even point is known as the:
A. Sales turnover.
B. Profit margin.
C. Contribution margin.
D. Relevant range.
E. Margin of safety.
61. A firm expects to sell 25,000 units of its product at $11 per unit. Pretax income is
predicted to be $60,000. If the variable costs per unit are $5, total fixed costs must be:
A. $ 65,000.
B. $ 90,000.
C. $125,000.
D. $215,000.
E. $275,000.
62. During March, a firm expects to its total sales to be $160,000, its total variable costs to be
$95,000, and its total fixed costs to be $25,000. The contribution margin for March is:
A. $ 65,000.
B. $ 90,000.
C. $120,000.
D. $40,000.
E. $25,000.
63. A firm expects to sell 25,000 units of its product at $11 per unit and to incur variable costs
per unit of $6. Total fixed costs are $70,000. The total contribution margin is:
A. $ 55,000.
B. $ 90,000.
C. $125,000.
D. $150,000.
E. $380,000.
64. A firm expects to sell 25,000 units of its product at $11 per unit and to incur variable costs
per unit of $6. Total fixed costs are $70,000. The pretax net income is:
A. $ 55,000.
B. $ 90,000.
C. $125,000.
D. $150,000.
E. $380,000.
65. Watson Company has monthly fixed costs of $83,000 and a 40% contribution margin
ratio. If the company has set a target monthly income of $15,000, what dollar amount of sales
must be made to produce the target income?
A. $245,000
B. $207,500
C. $37,300
D. $170,000
E. $39,200
66. During its most recent fiscal year, Raphael Enterprises sold 200,000 electric screwdrivers
at a price of $15 each. Fixed costs amounted to $400,000 and pretax income was $600,000.
What amount should have been reported as variable costs in the company’s contribution
margin income statement for the year in question?
A. $2,400,000.
B. $1,600,000.
C. $3,000,000.
D. $2,000,000.
E. $1,000,000.
67. During its most recent fiscal year, Dover, Inc. had total sales of $3,200,000. Contribution
margin amounted to $1,500,000 and pretax income was $400,000. What amount should have
been reported as variable costs in the company’s contribution margin income statement for the
year in question?
A. $1,900,000.
B. $2,800,000.
C. $1,300,000.
D. $1,100,000.
E. $1,700,000.

68. During its most recent fiscal year, Dover, Inc. had total sales of $3,200,000. Contribution
margin amounted to $1,500,000 and pretax income was $400,000. What amount should have
been reported as fixed costs in the company’s contribution margin income statement for the
year in question?
A. $1,900,000.
B. $2,800,000.
C. $1,300,000.
D. $1,100,000.
E. $1,700,000.
69. Henderson Co. has fixed costs of $36,000 and a contribution margin ratio of 24%. If
expected sales are $200,000, what is the margin of safety as a percent of sales?
A. 6%.
B. 25%.
C. 33%.
D. 50%.
E. 75%.
70. Gladstone Co. has expected sales of $326,000 for the upcoming month and its monthly
break even sales are $300,000. What is the margin of safety as a percent of sales, rounded to
the nearest whole percent?
A. 9%.
B. 108%.
C. 52%.
D. 8%.
E. 92%.
71. A product sells for $200 per unit, and its variable costs per unit are $130. The fixed costs
are $420,000. If the firm wants to earn $35,000 pretax income, how many units must be sold?
A. 6,500.
B. 6,000.
C. 500.
D. 5,000.
E. 5,500.
72. A company has fixed costs of $320,000 and a contribution margin per unit of $15. If the
firm wants to earn a target $40,000 pretax income, how many units must be sold (rounded to
the nearest whole unit)?
A. 24,000.
B. 21,333.
C. 18,666.
D. 2,667.
E. 20,000.
73. A company has fixed costs of $270,000, a unit contribution margin of $14, and a
contribution margin ratio of 55%. If the firm wants to earn a target $60,000 pretax income,
what amount of sales must the company make (rounded to the nearest whole dollar)?
A. 490,909.
B. 330,000.
C. 109,090.
D. 381,818.
E. 600,000.
74. Management anticipates fixed costs of $72,500 and variable costs equal to 40% of sales.
What will pretax income equal if sales are $325,000?
A. $ 57,500.
B. $122,500.
C. $130,000.
D. $181,250.
E. $252,500.
75. Locus Company has total fixed costs of $112,000. Its product sells for $35 per unit and
variable costs amount to $25 per unit. Next year Locus Company wishes to earn a pretax
income that equals 10% of fixed costs. How many units must be sold to achieve this target
income level?
A. 1,120.
B. 8,214.
C. 11,200.
D. 12,320.
E. 14,080.
76. Raven Company has a target of earning $70,000 pre-tax income. The contribution margin
ratio is 30%. What amount of dollar sales must be achieved to reach the goal if fixed costs are
$36,000?
A. $ 23,333.
B. $ 36,000.
C. $300,000.
D. $353,333.
E. $420,000.
77. Use the following information to determine the margin of safety in dollars:
Unit sales …………………………………………… 50,000 Units
Dollar sales…………………………………………..……….……. $500,000
Fixed costs …………………………………………………………. $204,000
Variable costs…………………………………………………..….. $187,500
A. $ 88,500.
B. $108,500.
C. $173,600
D. $326,400.
E. $500,000.
78. Use the following information to determine the break-even point in sales dollars:
Unit sales…………………………………………… 50,000 Units
Dollar sales…………………………………………..……….……. $500,000
Fixed costs …………………………………………………………. $204,000
Variable costs…………………………………………………..….. $187,500
A. $ 88,500.
B. $108,500.
C. $173,600.
D. $326,400.
E. $500,000.
79. Use the following information to determine the break-even point in units (rounded to the
nearest whole unit):
Unit sales 50,000 Units
Unit selling price $14.50
Unit variable cost $7.50
Fixed costs $186,000
A. 12,828
B. 26,571
C. 8,455
D. 46,667
E. 24,800
80. Use the following information to determine the contribution margin ratio:
Unit sales 50,000 Units
Unit selling price $14.50
Unit variable cost $7.50
Fixed costs $204,000
A. 6.9%.
B. 48.3%.
C. 24.5%.
D. 51.7%.
E. 34.1%.
81. The budgeted income statement presented below is for Burkett Corporation for the
coming fiscal year. Compute the number of units that must be sold in order to achieve a target
pretax income of $130,000.
Sales (50,000 units) $1,000,000
Costs:
Direct materials $270,000
Direct labor 240,000
Fixed factory overhead 100,000
Variable factory overhead 150,000
Fixed marketing costs 110,000
Variable marketing costs 50,000 920,000
Pretax income $ 80,000
A. 53,165.
B. 81,250.
C. 36,207.
D. 50,000.
E. 58,621.
82. The budgeted income statement presented below is for Burkett Corporation for the
coming fiscal year. If Burkett Corporation is able to achieve the budgeted level of sales, its
margin of safety in dollars would be:
Sales (50,000 units) $1,000,000
Costs:
Direct materials $270,000
Direct labor 240,000
Fixed factory overhead 100,000
Variable factory overhead 150,000
Fixed marketing costs 110,000
Variable marketing costs 50,000 920,000
Pretax income $ 80,000
A. $172,420.
B. $150,000.
C. $262,500.
D. $275,862.
E. $310,115.
83. In cost-volume-profit analysis, the unit contribution margin is:
A. Sales price per unit less cost of goods sold per unit.
B. Sales price per unit less unit fixed cost per unit .
C. Sales price per unit less total variable cost per unit .
D. Sales price per unit less unit total cost per unit.
E. The same as the contribution margin ratio.
84. The contribution margin ratio:
A. Is the percent of each sales dollar that remains after deducting the total unit variable cost.
B. Is the percent of each sales dollar that remains after deducting the total unit fixed cost.
C. Is the percent of each sales dollar that remains to cover the variable and fixed costs.
D. Cannot be used in conjunction with other analytical tools.
E. Is the same as the unit contribution margin.
85. Total contribution margin in dollars divided by pretax income is the:
A. Degree of operating leverage.
B. Contribution margin ratio.
C. Margin of safety.
D. Sales mix.
E. Break-even point in units.
86. Which of the following is the correct interpretation of a degree of operating leverage of
5?
A. Operating leverage of 5 means that sales can decrease by 5% before the firm’s current level
of sales will hit the break-even point.
B. Operating leverage of 5 means that if sales increase by 5% the firm will hit its break-even
point.
C. Operating leverage of 5 means that if sales increase by 5%, there will be a 25% increase in
the firm’s pretax profit.
D. Operating leverage of 5 measures the degree of debt employed by the firm’s debt structure.
E. Operating leverage of 5 means that the company would need to increase sales by 5 times in
order to hit its break-even point.
87. A statistical method for identifying cost behavior is the:
A. Scatter diagram method.
B. High-low method.
C. Composite method.
D. CVP charting method.
E. Least-squares regression method.

88. The least-squares regression method is:
A. A graphical method to identify cost behavior.
B. An algebraic method to identify cost behavior.
C. A statistical method to identify cost behavior.
D. The only identify cost estimation method allowed by GAAP.
E. A cost estimation method that only uses the two extreme values.
89. A graph used to analyze past cost behaviors by displaying costs and unit data for each
period as points on the diagram is called a:
A. Least-squares diagram.
B. Step-wise diagram.
C. Scatter diagram.
D. Break-even diagram.
E. Composite diagram.

90. A line on a scatter diagram that is intended to reflect the past relation between cost and
unit volume is the:
A. Margin of safety line.
B. Break-even line.
C. Contribution margin line.
D. Estimated line of cost behavior.
E. Standard cost line.
91. A method that estimates cost behavior by using just the highest and lowest volume levels
is called the:
A. Scatter method.
B. High-low method.
C. Least-squares method.
D. Break-even method.
E. Step-wise method.

92. The following information is available for a company’s utility cost for operating its
machines over the last four months.
Month
Machine
hours
Utility
cost
January 900 $5,450
February 1,800 $6,900
March 2,400 $8,100
April 600 $3,600
Using the high-low method, the estimated variable cost per unit for utilities is:
A. $3.38
B. $6.00
C. $2.50
D. $4.22
E. $6.17
93. The following information is available for a company’s utility cost for operating its
machines over the last four months.
Month
Machine
hours
Utility
cost
January 900 $5,450
February 1,800 $6,900
March 2,400 $8,100
April 600 $3,600
Using the high-low method, the estimated total fixed cost for utilities is:
A. $1,500
B. $3,600
C. $6,000
D. $3,300
E. $2,100
94. The following information is available for a company’s cost of sales over the last five
months.
Month
Units
sold
Cost of
sales
January 400 $31,000
February 800 $37,000
March 1,600 $49,000
April 2,400 $61,000
Using the high-low method, the estimated variable cost of sales per unit sold is:
A. $25.42
B. $77.50
C. $34.23
D. $15.00
E. $30.62
95. The following information is available for a company’s cost of sales over the last five
months.
Month
Units
sold
Cost of
sales
January 400 $31,000
February 800 $37,000
March 1,600 $49,000
April 2,400 $61,000
Using the high-low method, the estimated total fixed cost is:
A. $25,000
B. $30,000
C. $13,692
D. $100,000
E. $50,000
96. The sales level at which a company neither earns a profit nor incurs a loss is the:
A. Relevant range.
B. Margin of safety.
C. Step-wise variable level.
D. Break-even point.
E. Contribution margin.
97. A company’s product sells at $12 per unit and has a $5 per unit variable cost. The
company’s total fixed costs are $98,000.The contribution margin per unit is:
A. $ 5.00.
B. $ 7.00.
C. $ 8.17.
D. $12.00.
E. $17.00.
98. A company’s product sells at $12 per unit and has a $5 per unit variable cost. The
company’s total fixed costs are $98,000. The break-even point in units is:
A. 5,158.
B. 7,000.
C. 8,167.
D. 14,000.
E. 19,600.
99. Maroon Company’s contribution margin ratio is 24%. Total fixed costs are $84,000. What
is Maroon’s break-even point in sales dollars?
A. $20,160.
B. $110,526.
C. $350,000.
D. $240,000.
E. $84,000.
100. Fuschia Company’s contribution margin per unit is $12. Total fixed costs are $84,000.
What is Fuschia’s break-even point in units?
A. 7,000.
B. 26,520.
C. 57,600.
D. 5,760.
E. 70,000.
101. A product sells for $200 per unit, and its variable costs are 65% of sales. The fixed costs
are $420,000. What is the break-even point in sales dollars?
A. $2,100.
B. $6,000.
C. $420,000.
D. $646,154.
E. $1,200,000.
102. A product sells for $30 per unit and has variable costs of $18 per unit. The fixed costs are
$720,000. If the variable costs per unit were to decrease to $15 per unit, fixed costs increase
to $900,000, and the selling price does not change, break-even point in units would:
A. Increase by 20,000.
B. Equal 6,000.
C. Increase by 6,000.
D. Decrease by 20,000.
E. Not change.
103. Forrester Company is considering buying new equipment that would increase monthly
fixed costs from $120,000 to $150,000 and would decrease the current variable costs of $70
by $10 per unit. The selling price of $100 is not expected to change. Forrester’s current
break-even sales are $400,000 and current break-even units are 4,000. If Forrester purchases
this new equipment, the revised contribution margin ratio would be:
A. 30%.
B. 60%.
C. 40%.
D. 10%.
E. 70%.
104. Forrester Company is considering buying new equipment that would increase monthly
fixed costs from $120,000 to $150,000 and would decrease the current variable costs of $70
by $10 per unit. The selling price of $100 is not expected to change. Forrester’s current
break-even sales are $400,000 and current break-even units are 4,000. If Forrester purchases
this new equipment, the revised break-even point in dollars would be:
A. $300,000.
B. $400,000.
C. $325,000
D. $500,000.
E. $375,000.
105. Forrester Company is considering buying new equipment that would increase monthly
fixed costs from $120,000 to $150,000 and would decrease the current variable costs of $70
by $10 per unit. The selling price of $100 is not expected to change. Forrester’s current
break-even sales are $400,000 and current break-even units are 4,000. If Forrester purchases
this new equipment, the revised break-even point in units would:
A. Increase by 250.
B. Decrease by 250.
C. Increase by 12,000.
D. Decrease by 8,000.
E. Increase by 8,000.
106. The difference between sales price per unit and variable cost per unit is the:
A. Gross profit from sales.
B. Gross margin per unit.
C. Fixed cost per unit.
D. Margin of safety per unit.
E. Contribution margin per unit.
107. The contribution margin per unit expressed as a percentage of the product’s selling price
is the:
A. Volume variance.
B. Margin of safety.
C. Contribution margin ratio.
D. Break-even point.
E. Rate of return on sales.
108. A company manufactures and sells a product for $120 per unit. The company’s fixed
costs are $68,760, and its variable costs are $90 per unit. The company’s break-even point in
units is:
A. 2,292.
B. 573.
C. 764.
D. 327.
E. 840.
109. A company manufactures and sells a product for $120 per unit. The company’s fixed
costs are $68,760, and its variable costs are $90 per unit. The company’s break-even point in
dollars is:
A. $91,680.
B. $68,760.
C. $2,292.
D. $275,040.
E. $206,280.
110. A company has fixed costs of $90,000. Its contribution margin ratio is 30% and the
product sells for $75 per unit. What is the company’s break-even point in dollar sales?
A. $ 60,000.
B. $128,571.
C. $180,000.
D. $210,000.
E. $300,000.
111. Mason Company manufactures and sells shoelaces for $2.00 per pair. Its variable cost per
unit is $1.70. Mason’s total fixed costs are $10,500. How many pairs must Mason Company
sell to break even?
A. 5,250.
B. 6,176.
C. 35,000.
D. 52,500.
E. 61,760.
112. The Goldfarb Company manufactures and sells toasters. Each toaster sells for $23.75 and
the variable cost per unit is $16.25. Goldfarb’s total fixed costs are $25,000, and budgeted
sales are 8,000 units. What is the contribution margin per unit?
A. $7.50.
B. $16.25.
C. $23.75.
D. $60,000.
E. $1.25
113. Leeks Company’s product has a contribution margin per unit of $11.25 and a contribution
margin ratio of 22.5%. What is the selling price of the product?
A. $ 5.
B. $20.
C. $30.
D. $40.
E. $50.
114. Alvarez Company’s break-even point in units is 1,000. The sales price per unit is $10 and
variable cost per unit is $7. If the company sells 2,500 units, what will net income be?
A. $ 4,500
B. $ 7,500
C. $17,000
D. $35,000
E. $3,000.
115. Mullis Corp. manufactures DVDs that sell for $5.00. Fixed costs are $28,000 and
variable costs are $3.60 per unit. Mullis can buy a newer production machine that will
increase fixed costs by $8,000 per year, but will decrease variable costs by $0.40 per unit.
What effect would the purchase of the new machine have on Mullis’ break-even point in
units?
A. 4,444 unit increase.
B. 9,850 unit decrease.
C. 5,714 unit increase.
D. 4,444 unit decrease.
E. No effect.
116. At Midland Company’s break-even point of 9,000 units, fixed costs are $180,000 and
variable costs are $540,000 in total. The unit sales price is:
A. $ 20.
B. $ 40.
C. $ 60.
D. $ 80.
E. $100.
117. Assume that sales are predicted to be $3,750, the expected contribution margin is $1,500,
and a net loss of $250 is anticipated. The break-even point in sales dollars is:
A. $1,750.
B. $2,500.
C. $4,000.
D. $4,250.
E. $4,375.
118. During a recent fiscal year, Creek Company reported pretax income of $125,000, a
contribution margin ratio of 25% and total contribution margin of $400,000. Total variable
costs must have been:
A. $1,100,000.
B. $1,200,000.
C. $500,000.
D. $1,600,000.
E. $2,100,000.
119. In Keegan Corporation’s most recent fiscal year, the company reported pretax earnings of
$215,000. Fixed costs totaled $325,800, the unit selling price of the firm’s only product was
$60, and the variable costs per unit were 40% of the selling price. Based on this information,
the firm’s break-even point in units was:
A. 13,575 units.
B. 15,023 units.
C. 13,750 units.
D. 9,050 units.
E. 8,750 units.
120. A cost-volume-profit chart is also known as a(n)
A. Operating profit chart.
B. Operating leverage chart.
C. Break-even chart.
D. Margin of safety chart.
E. Sales chart.
121. When graphing cost-volume-profit data on a CVP chart:
A. Units are plotted on the horizontal axis; costs on the vertical axis.
B. Units are plotted on the vertical axis; costs on the horizontal axis.
C. Both units and costs are plotted on the horizontal axis.
D. Both units and cost are plotted on the vertical axis.
E. Data points always represent expected future points.
122. A CVP graph presents data on:
A. Profit and loss on a per unit basis.
B. Profit, loss, and break-even on a total dollar basis.
C. Profit, loss, and break-even on a per unit basis.
D. Only profit and loss on a total basis.
E. Profit and loss on a budget and actual basis.
123. A firm sells two products, Regular and Ultra. For every unit of Regular the firm sells,
two units of Ultra are sold. The firm’s total fixed costs are $1,612,000. Selling prices and cost
information for both products follow. The contribution margin per composite unit is:
Product
Unit
Sales
Price
Variable
Cost Per
Unit
Regular $20 $8
Ultra 24 4
A. $12.
B. $20.
C. $32.
D. $44.
E. $52.
124. A firm sells two products, Regular and Ultra. For every unit of Regular the firm sells,
two units of Ultra are sold. The firm’s total fixed costs are $1,612,000. Selling prices and cost
information for both products follow. What is the firm’s break-even point in units of Regular
and Ultra?
Product
Unit
Sales
Price
Variable
Cost Per
Unit
Regular $20 $8
Ultra 24 4
A. 31,000 of A and 31,000 of B.
B. 31,000 of A and 62,000 of B.
C. 10,333 of A and 20,667 of B.
D. 36,167 of A and 72,333 of B.
E. 62,000 of A and 31,000 of B.
125. The ratio (proportion) of the sales volumes for the various products sold by a company is
called the:
A. Current product mix.
B. Relevant mix.
C. Sales mix.
D. Inventory cost ratio.
E. Production ratio.
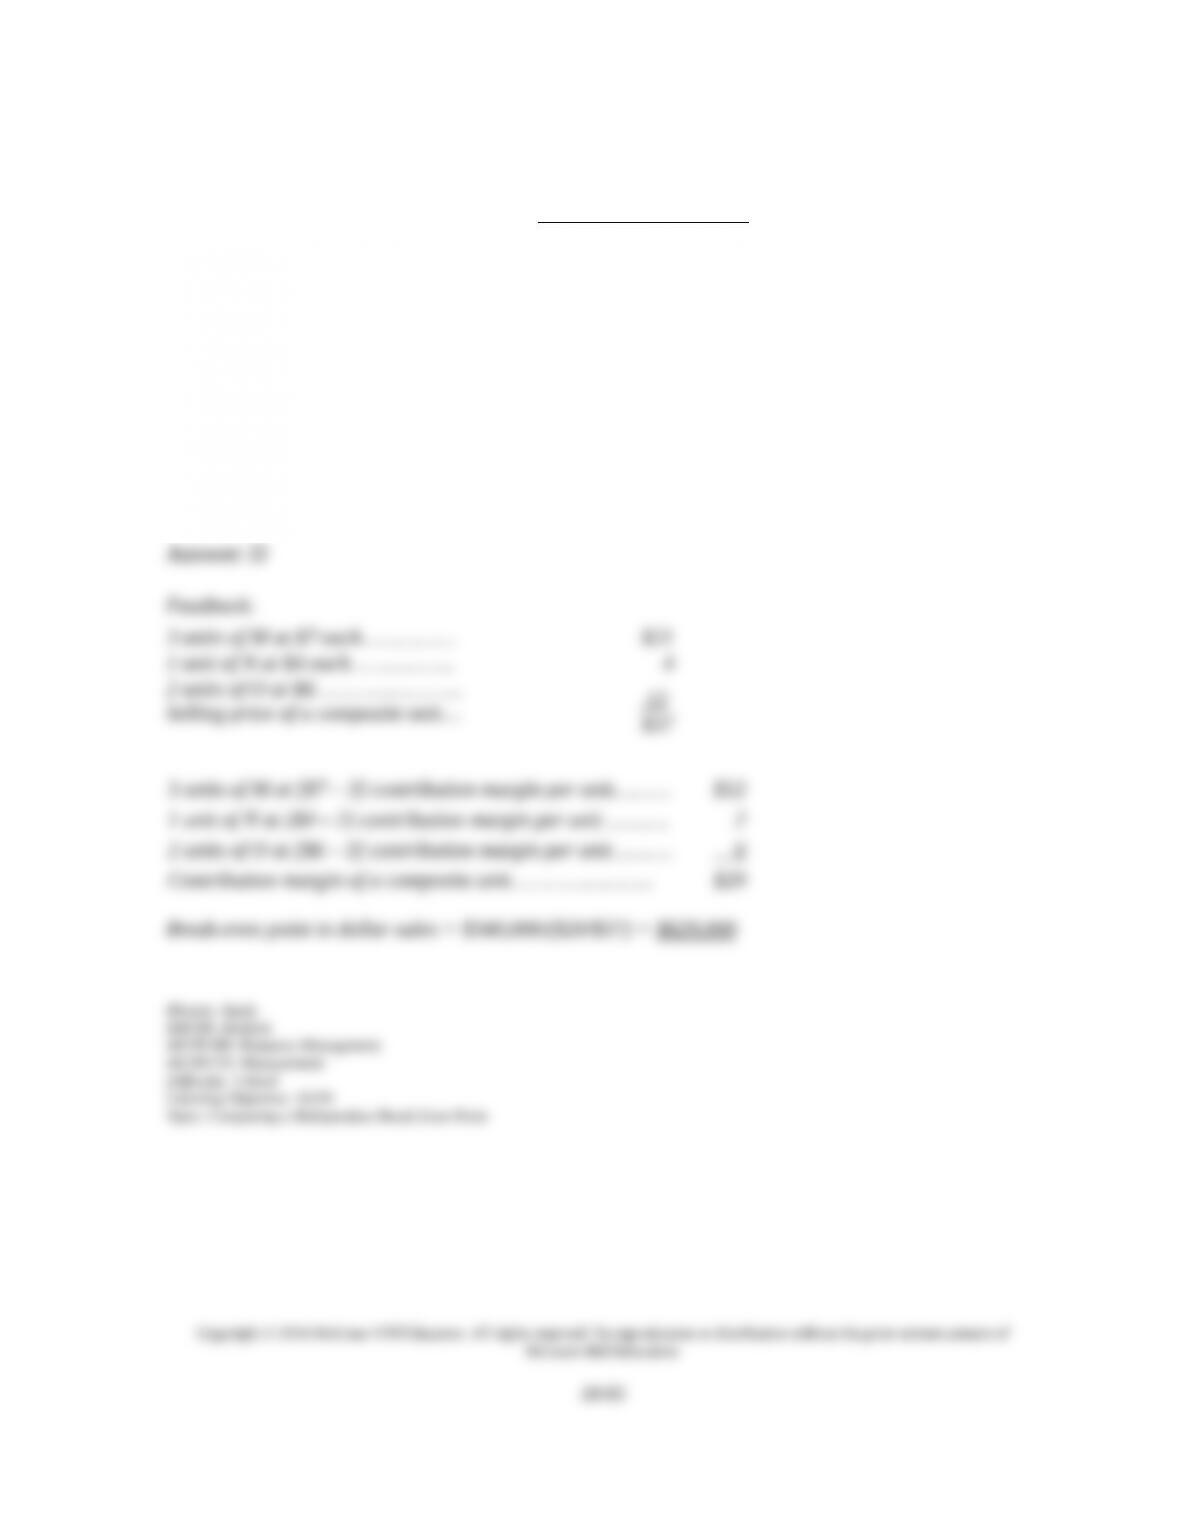
126. Mott Company’s sales mix is 3 units of A, 2 units of B, and 1 unit of C. Selling prices for
each product are $20, $30, and $40, respectively. Variable costs per unit are $12, $18, and
$24, respectively. Fixed costs are $320,000. What is the break-even point in composite units?
A. 1,111.
B. 1,600.
C. 2,666.
D. 4,000.
E. 5,000.
127. Madison Corporation sells three products (M, N, and O) in the following mix: 3:1:2. Unit
price and cost data are:
M N O
Unit sales price……………………..………..
$7
$4
$6
Unit variable costs…………………………..
3
2
3
Total fixed costs are $340,000. The break-even point in sales dollars for the current sales mix
is (round to the nearest thousand):
A. $ 20,000.
B. $289,000.
C. $400,000.
D. $629,000.
E. $740,000.
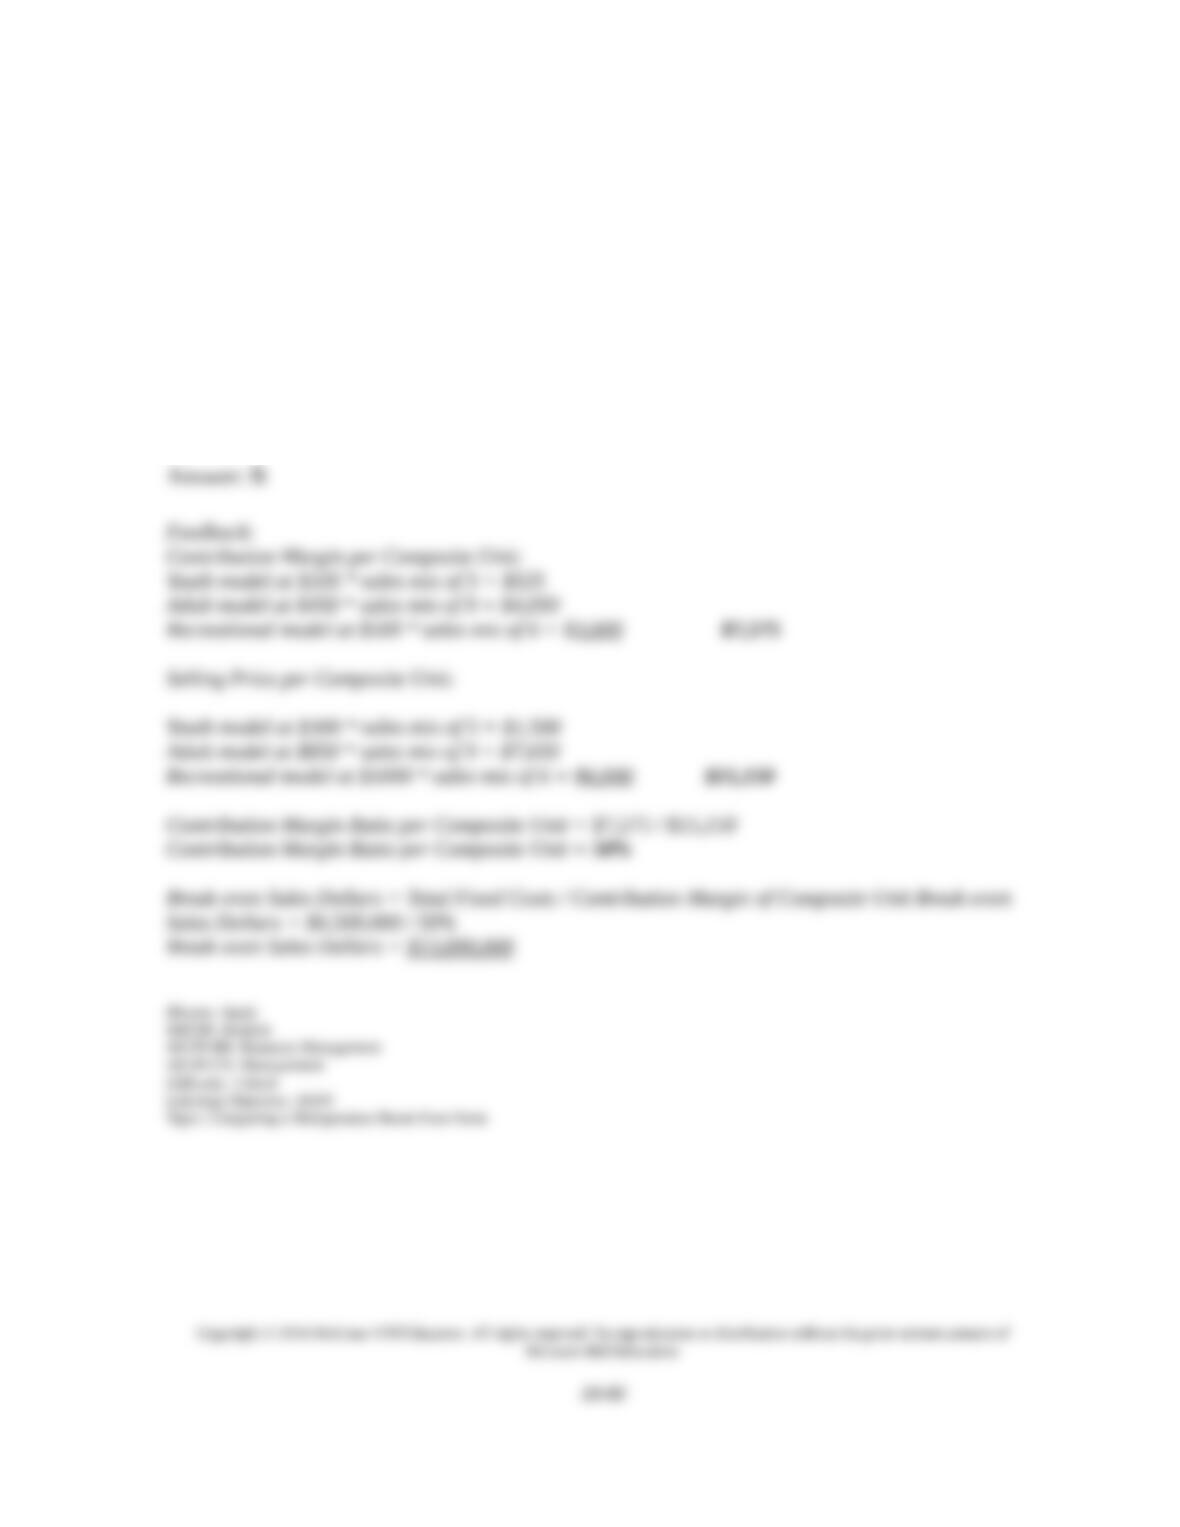
128. Barclay Enterprises manufactures and sells three distinct styles of bicycles: the Youth
model sells for $300 and has a unit contribution margin of $105; the Adult model sells for
$850 and has a unit contribution margin of $450; and the Recreational model sells for $1,000
and has a unit contribution margin of $500. The company’s sales mix includes: 5 Youth
models; 9 Adult models; and 6 Recreational models. If the firm’s annual fixed costs total
$6,500,000, calculate the firm’s break-even point in sales dollars.
A. $13,250,000.
B. $13,000,000.
C. $12,750,000.
D. $12,900,050.
E. $12,750,625.
129. Kent Manufacturing produces a product that sells for $50.00 and has variable costs of
$24.00 per unit. Fixed costs are $260,000. Kent can buy a new production machine that will
increase fixed costs by $11,400 per year, but will decrease variable costs by $3.50 per unit.
Compute the contribution margin per unit if the machine is purchased.
A. $22.50.
B. $26.00.
C. $29.50.
D. $28.50.
E. $27.50.
130. Kent Manufacturing produces a product that sells for $50.00 and has variable costs of
$24.00 per unit. Fixed costs are $260,000. Kent can buy a new production machine that will
increase fixed costs by $11,400 per year, but will decrease variable costs by $3.50 per unit.
Compute the revised break-even point in units if the new machine is purchased.
A. 10,438 units.
B. 8,814 units.
C. 10,000 units.
D. 9,200 units.
E. 9,869 units.
131. Kent Manufacturing produces a product that sells for $50.00. Fixed costs are $260,000
and variable costs are $24.00 per unit. Kent can buy a new production machine that will
increase fixed costs by $11,400 per year, but will decrease variable costs by $3.50 per unit.
What effect would the purchase of the new machine have on Kent’s break-even point in
units?
A. 800 unit increase.
B. 800 unit decrease.
C. 5,714 unit increase.
D. 4,444 unit decrease.
E. No effect on the break-even point in units.
132. Kent Manufacturing produces a product that sells for $50.00. Fixed costs are $260,000
and variable costs are $24.00 per unit. Kent can buy a new production machine that will
increase fixed costs by $11,400 per year, but will decrease variable costs by $3.50 per unit.
Compute the revised break-even point in dollars with the purchase of the new machine.
A. $500,000.
B. $440,678.
C. $521,923.
D. $480,000.
E. $460,000.
133. McCoy Brothers manufactures and sells two products, A and Z in the ratio of 5:2.
Product A sells for $75; Z sells for $95. Variable costs for product A are $35; for Z $40. Fixed
costs are $418,500. Compute the contribution margin per composite unit.
A. $310.
B. $200.
C. $300.
D. $330.
E. $285.
134. McCoy Brothers manufactures and sells two products, A and Z in the ratio of 5:2.
Product A sells for $75; Z sells for $95. Variable costs for product A are $35; for Z $40. Fixed
costs are $418,500. Compute the break-even point in composite units.
A. 2,092.
B. 3,805.
C. 1,350.
D. 1,395.
E. 1,550.
135. McCoy Brothers manufactures and sells two products, A and Z in the ratio of 5:2.
Product A sells for $75; Z sells for $95. Variable costs for product A are $35; for Z $40. Fixed
costs are $418,500. Compute the number of units of Product A McCoy must sell to break
even.
A. 1,350.
B. 6,750.
C. 2,700.
D. 10,463.
E. 6,200.
136. McCoy Brothers manufactures and sells two products, A and Z in the ratio of 4:2.
Product A sells for $75; Z sells for $95. Variable costs for product A are $35; for Z $40. Fixed
costs are $418,500. Compute the number of units of Product Z McCoy must sell to break
even.
A. 1,350.
B. 6,200.
C. 10,463.
D. 2,700.
E. 6,750.
137. Flannigan Company manufactures and sells a single product that sells for $450 per unit;
variable costs are $300. Annual fixed costs are $870,000. Current sales volume is $4,200,000.
Compute the contribution margin per unit.
A. $450.
B. $300.
C. $200.
D. $190.
E. $150.
138. Flannigan Company manufactures and sells a single product that sells for $450 per unit;
variable costs are $300. Annual fixed costs are $870,000. Current sales volume is $4,200,000.
Compute the contribution margin ratio.
A. 33.3%.
B. 66.7%.
C. 20.7%.
D. 50.0%.
E. 19.3%.
139. Flannigan Company manufactures and sells a single product that sells for $450 per unit;
variable costs are $300. Annual fixed costs are $870,000. Current sales volume is $4,200,000.
Compute the break-even point in units.
A. 5,500.
B. 1,933.
C. 5,800.
D. 2,900.
E. 1,160.
140. Flannigan Company manufactures and sells a single product that sells for $450 per unit;
variable costs are $300. Annual fixed costs are $870,000. Current sales volume is $4,200,000.
Compute the break-even point in dollars.
A. $1,740,000.
B. $2,612,612.
C. $1,304,348.
D. $4,202,899.
E. $2,640,000
141. Flannigan Company manufactures and sells a single product that sells for $450 per unit;
variable costs are $300. Annual fixed costs are $870,000. Current sales volume is $4,200,000.
Flannigan Company management targets an annual pre-tax income of $1,125,000. Compute
the unit sales to earn the target pre-tax net income.
A. 4,333.
B. 7,500.
C. 6,650.
D. 13,300.
E. 11,750.
142. Flannigan Company manufactures and sells a single product that sells for $450 per unit;
variable costs are $300. Annual fixed costs are $870,000. Current sales volume is $4,200,000.
Flannigan Company management targets an annual pre-tax income of $1,125,000. Compute
the dollar sales to earn the target pre-tax net income.
A. $5,640,000.
B. $5,990,990.
C. $3,378,378.
D. $2,991,004.
E. $2,612,613.
143. Flannigan Company manufactures and sells a single product that sells for $450 per unit;
variable costs are $300. Annual fixed costs are $870,000. Current sales volume is $4,200,000.
Compute the current margin of safety in dollars for Flannigan Company.
A. $1,560,000.
B. $2,612,612.
C. $1,587,388.
D. $2,895,652.
E. $2,460,000.
144. Carver Packing Company reports total contribution margin of $72,000 and pretax net
income of $24,000 for the current month. In the next month, the company expects sales
volume to increase by 8%. The degree of operating leverage and the expected percent change
in income, respectively, are:
A. 4.0 and 32%
B. 0.33 and 8%
C. 0.33 and 2.7%
D. 3.0 and 8%
E. 3.0 and 24%
145. Shown below are terms or phrases preceded by letters a through j followed by a list of
definitions. Match the terms or phrases 1 through 10 with the correct definitions by placing
the letter of the term or phrase in the answer space provided at the beginning of each
definition.
(a) Mixed cost
(b) Fixed cost
(c) Contribution margin per unit
(d) Curvilinear cost
(e) Variable cost
(f) Step-wise cost
(g) Relevant range of operations
(h) Estimated line of cost behavior
(i) Least-squares regression
(j) Cost-volume-profit analysis
__________(1) The amount that the sale of one unit contributes toward covering fixed costs
and generating profit.
__________(2) A cost that changes in total in proportion to changes in volume of activity.
__________(3) A cost that includes both fixed and variable cost components.
__________(4) A cost that changes as volume changes, but at a nonconstant rate.
__________(5) A line drawn on a graph to fit the relation between cost and unit volume.
__________(6) A statistical method for identifying cost behavior that is more precise than the
high-low method and a scatter diagram.
__________(7) A company’s normal operating range of production volume; excludes
extremely high and low operating levels that are unlikely to recur.
__________(8) A cost that remains constant over limited ranges of volumes of activity but
shifts to another level when volume changes significantly.
__________(9) A business planning tool that helps managers predict how changes in costs
and sales levels affect profit.
__________(10) A cost that remains unchanged in total amount despite variations in the
volume of activity within a relevant range.
1. C; 2. E; 3. A; 4. D; 5. H; 6. I; 7. G; 8. F; 9. J; 10. B
Copyright © 2016 McGraw-Hill Education. All rights reserved. No reproduction or distribution without the prior written consent of
McGraw-Hill Education.
18-76
Blooms: Remember
AACSB: Communication
AICPA BB: Resource Management
AICPA FN: Measurement
Difficulty: 1 Easy
Learning Objective: 18-A1
Learning Objective: 18-P1
Learning Objective: 18-C1
Topic: Contribution Margin and Its Measures
Topic: Measuring Cost Behavior
Topic: Cost Behavior
Short Answer Questions
146. Define variable cost, fixed cost, and mixed cost.
147. What are the basic assumptions of CVP analysis with regard to variable cost, fixed cost,
and selling price per unit? (Assume a single product).
148. Describe what happens to the net income of a company under each of the following
assumptions: (a) Units sold are less than break-even units. (b) Units sold are greater than
break-even units. (c) Units sold are equal to the break-even units.
149. Discuss how CVP analysis can be useful in planning.
150. Describe and compare the three cost estimation methods used to develop a cost
equation.
151. What are the unit contribution margin and the contribution margin ratio? What do these
measures reveal about a company’s cost structure?
152. What is operating leverage? How can the degree of operating leverage be used in
analyzing changes in sales?
153. What is a scatter diagram? How is a scatter diagram used to estimate cost behavior?
154. What is the high-low method? Briefly describe how it is applied.
155. Define the break-even point of a company.
156. Briefly describe a CVP chart, including its major components.
157. Describe how a cost-volume-profit analysis would be performed for a company that sells
more than one product when the sales mix is known.
158. A company has a goal of earning $128,000 in pre-tax income. The contribution margin
ratio is 30%. What dollar amount of sales must be achieved to reach the goal if fixed costs are
$64,000?
159. A company has total fixed costs of $200,000. Its product sells for $25 per unit and
variable costs amount to $15 per unit. The company has a target pre-tax income of $50,000.
How many units must be sold to achieve this pre-tax target income?
160. Proctor Company has fixed costs of $315,000 and a contribution margin ratio of 24%. If
sales are expected to be $1,500,000, what is the percentage of the margin of safety?
161. Johnston Co. anticipates total fixed costs of $120,000 and variable costs equal to 40% of
sales. What is the pretax income if sales are $650,000?
162. Journey Company is considering the production and sale of a new product with the
following sales and cost data: unit sales price $18; unit variable costs $8.50; and total fixed
costs of $81,250. Determine the dollar sales needed to generate an pre-tax income of $44,000,
rounded to the nearest whole dollar.
163. Philadelphia Co. is considering the production and sale of a new product with the
following sales and cost data: unit sales price, $300; unit variable costs, $180; total fixed
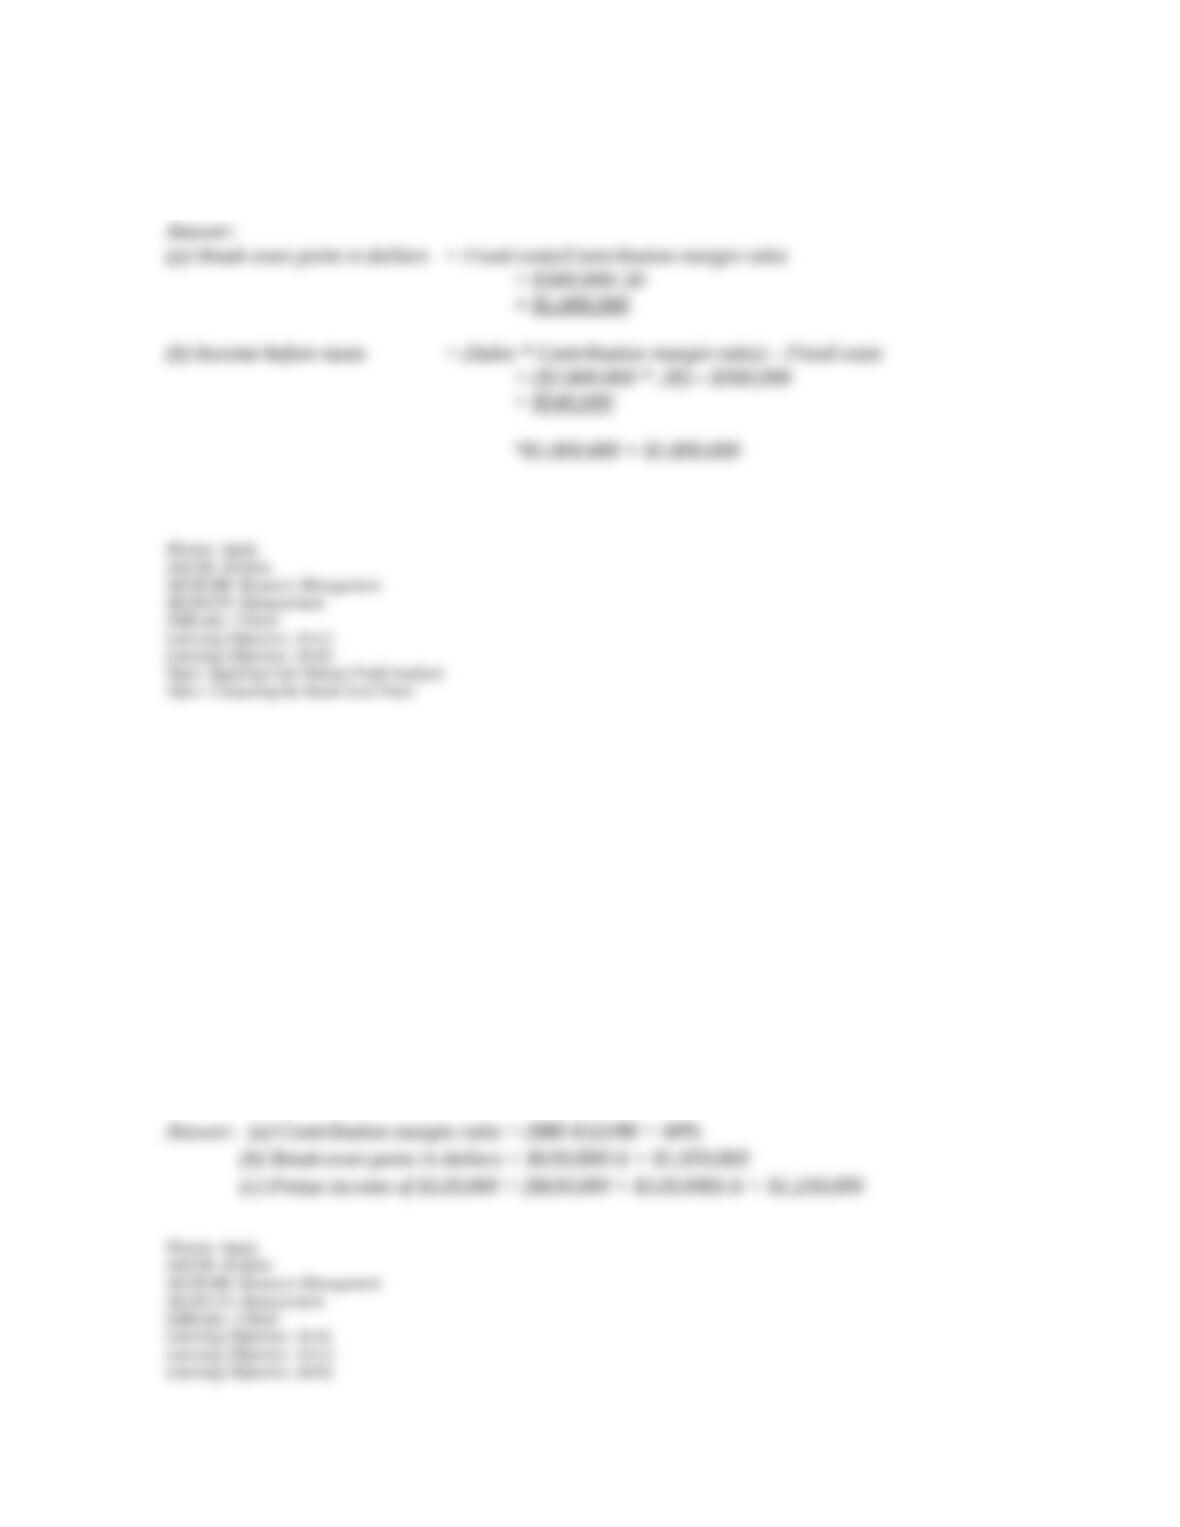
costs, $270,000; and projected sales, $900,000. What is the margin of safety:
(a) In dollar sales? And (b) As a percent of sales?
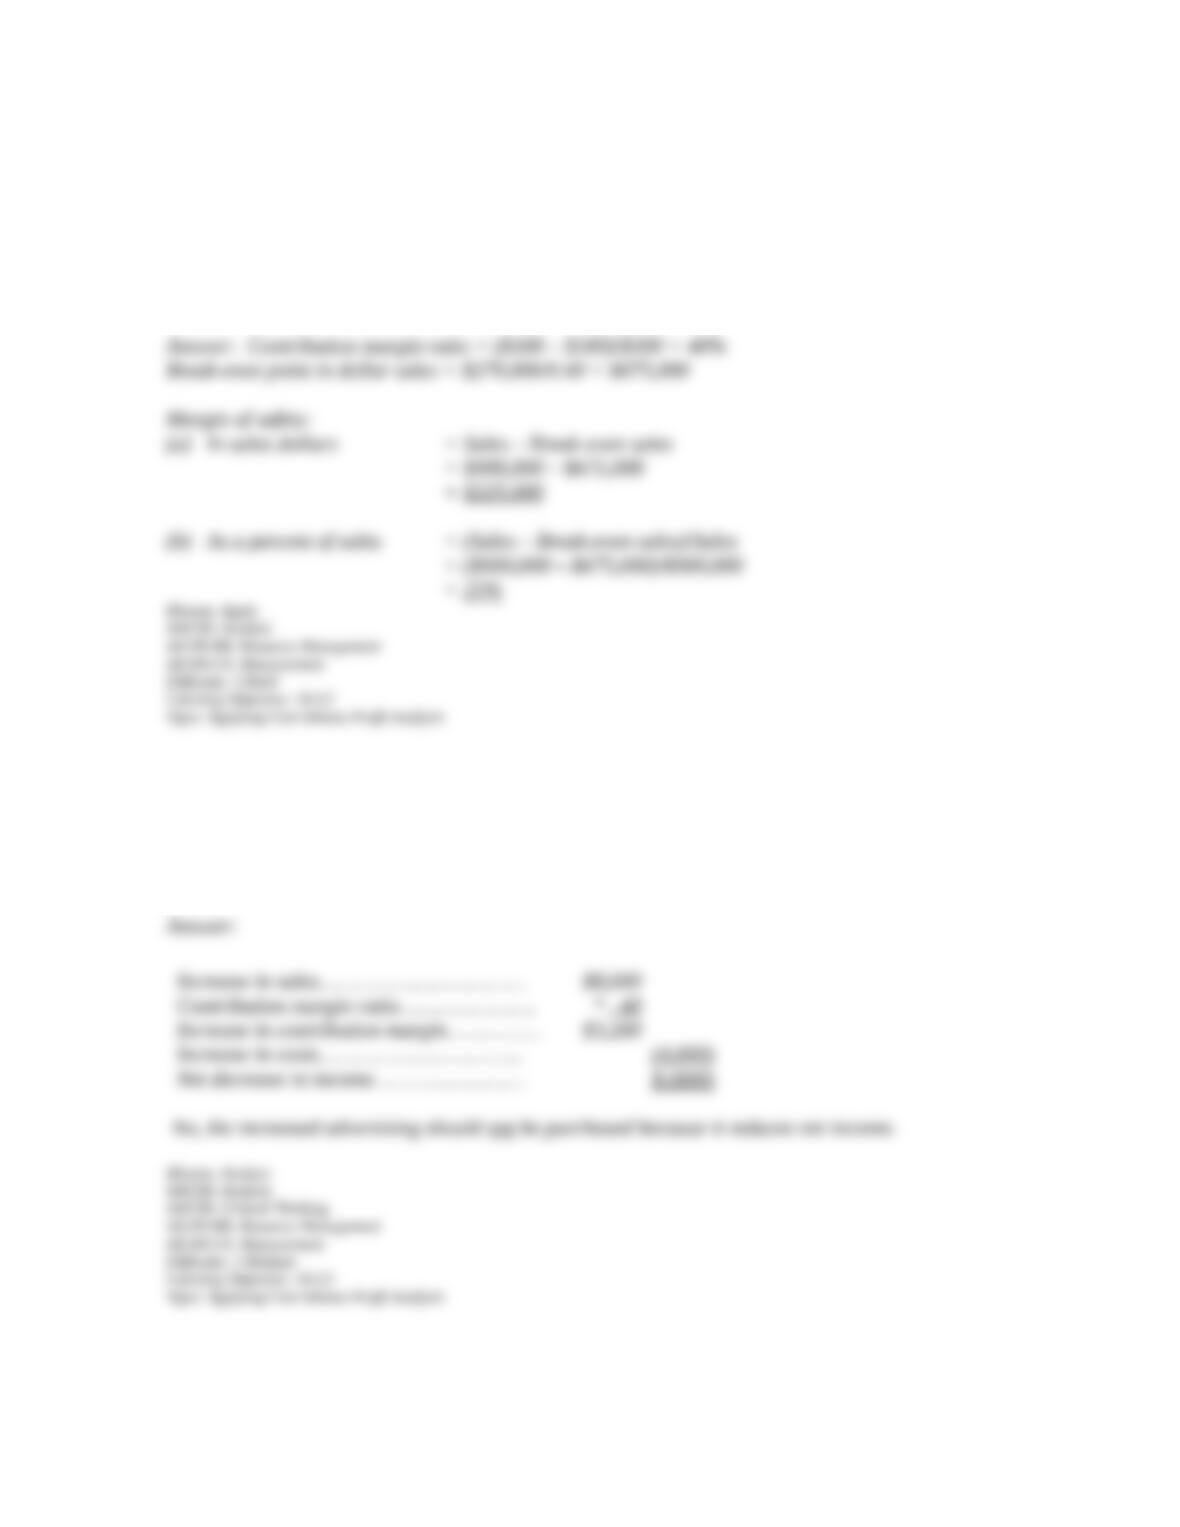
164. Zola Co. has a contribution margin ratio of 40% and would like to determine whether an
additional advertising expenditure of $4,000 would increase sales by $8,000. Calculate the
increase or decrease in net income that would result from this change, and comment on
whether Zola should purchase the additional advertising.
165. Portal Manufacturing has total fixed costs of $520,000. A unit of product sells for $15
and variable costs per unit are $11.
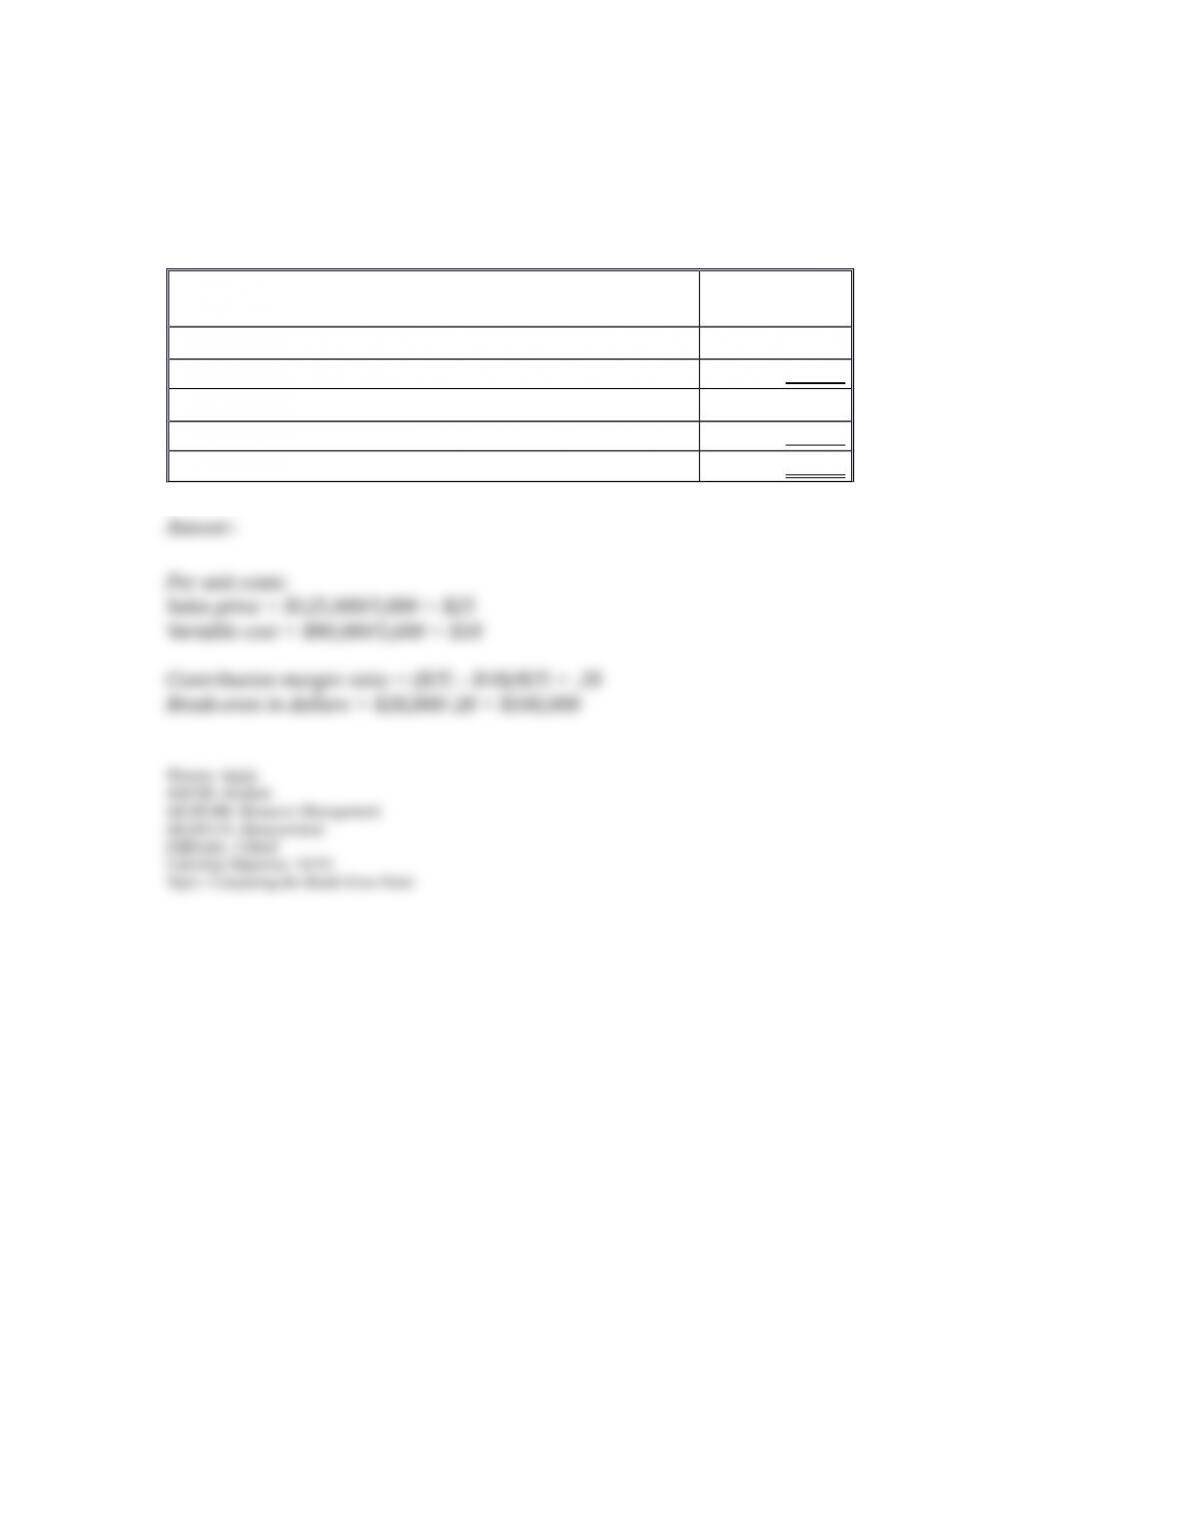
a) Prepare a contribution margin income statement showing predicted net income (loss) if
Portal sells 100,000 units for the year ended December 31.
b) At a minimum, how many units must Portal sell in order not to incur a loss?
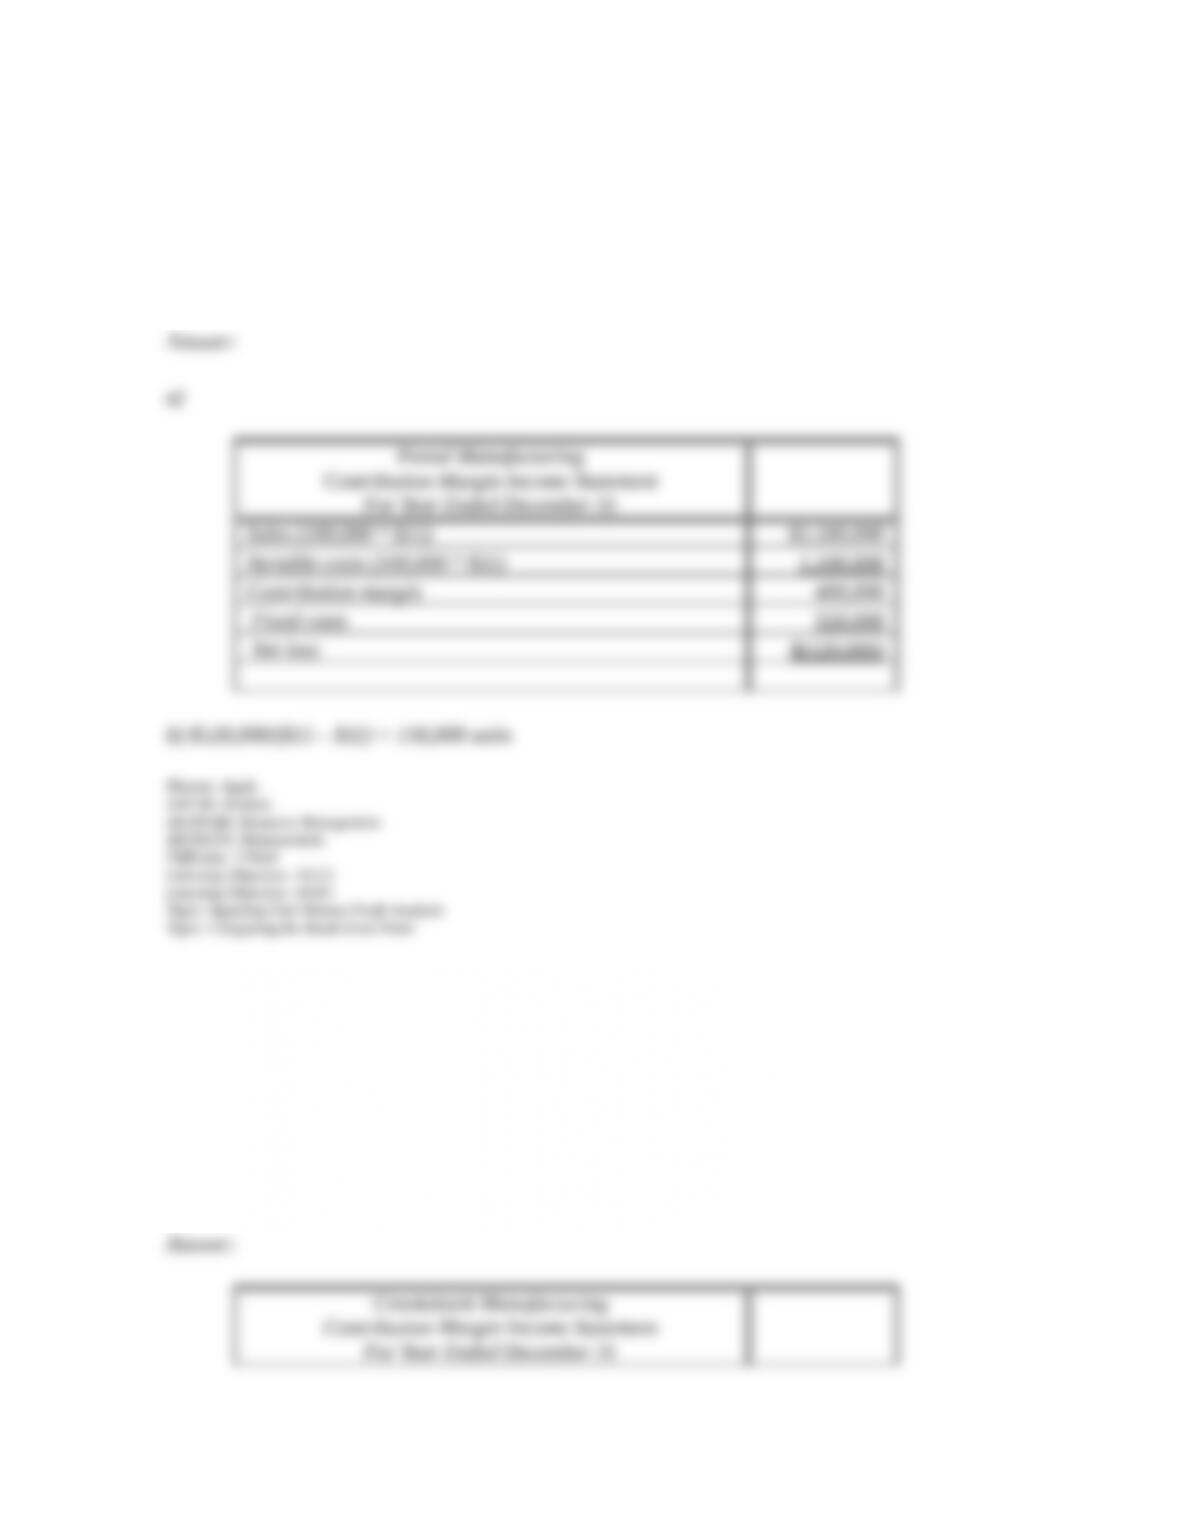
166. Crookshank Manufacturing has total fixed costs of $460,000. A unit of product sells for
$20 and variable costs per unit are $11.
Prepare a contribution margin income statement showing predicted net income (loss) if
Crookshank sells 100,000 units for the year ended December 31.
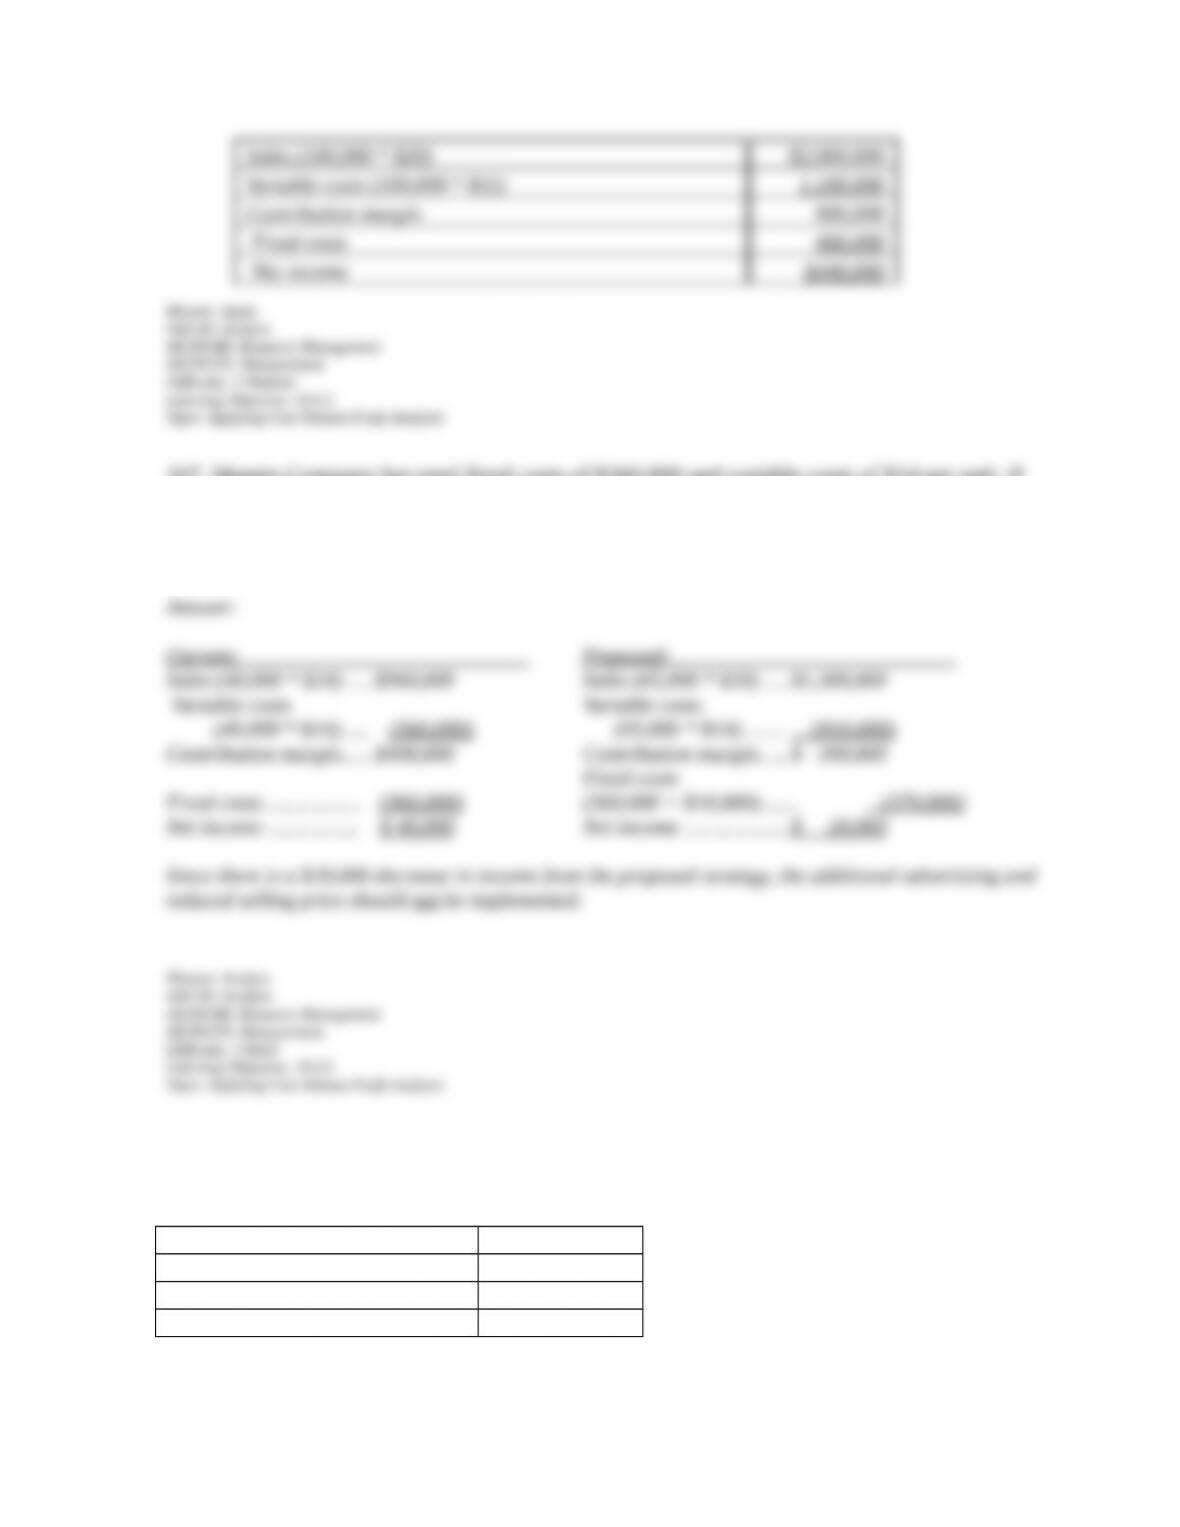
167. Margin Company has total fixed costs of $360,000 and variable costs of $14 per unit. If
the unit sales price is reduced from $24 to $20 and advertising is increased by $10,000, sales
will increase from 40,000 to 65,000 units. Should Margin reduce its per unit sales price and
pay for the additional advertising? (Support your answer with calculations.)
168. The following data relate to a product sold by Hallstone Company:
Total Variable costs $90,000
Total fixed costs $27,000
Predicted pre-tax income $18,000
Contribution margin per unit $5.00
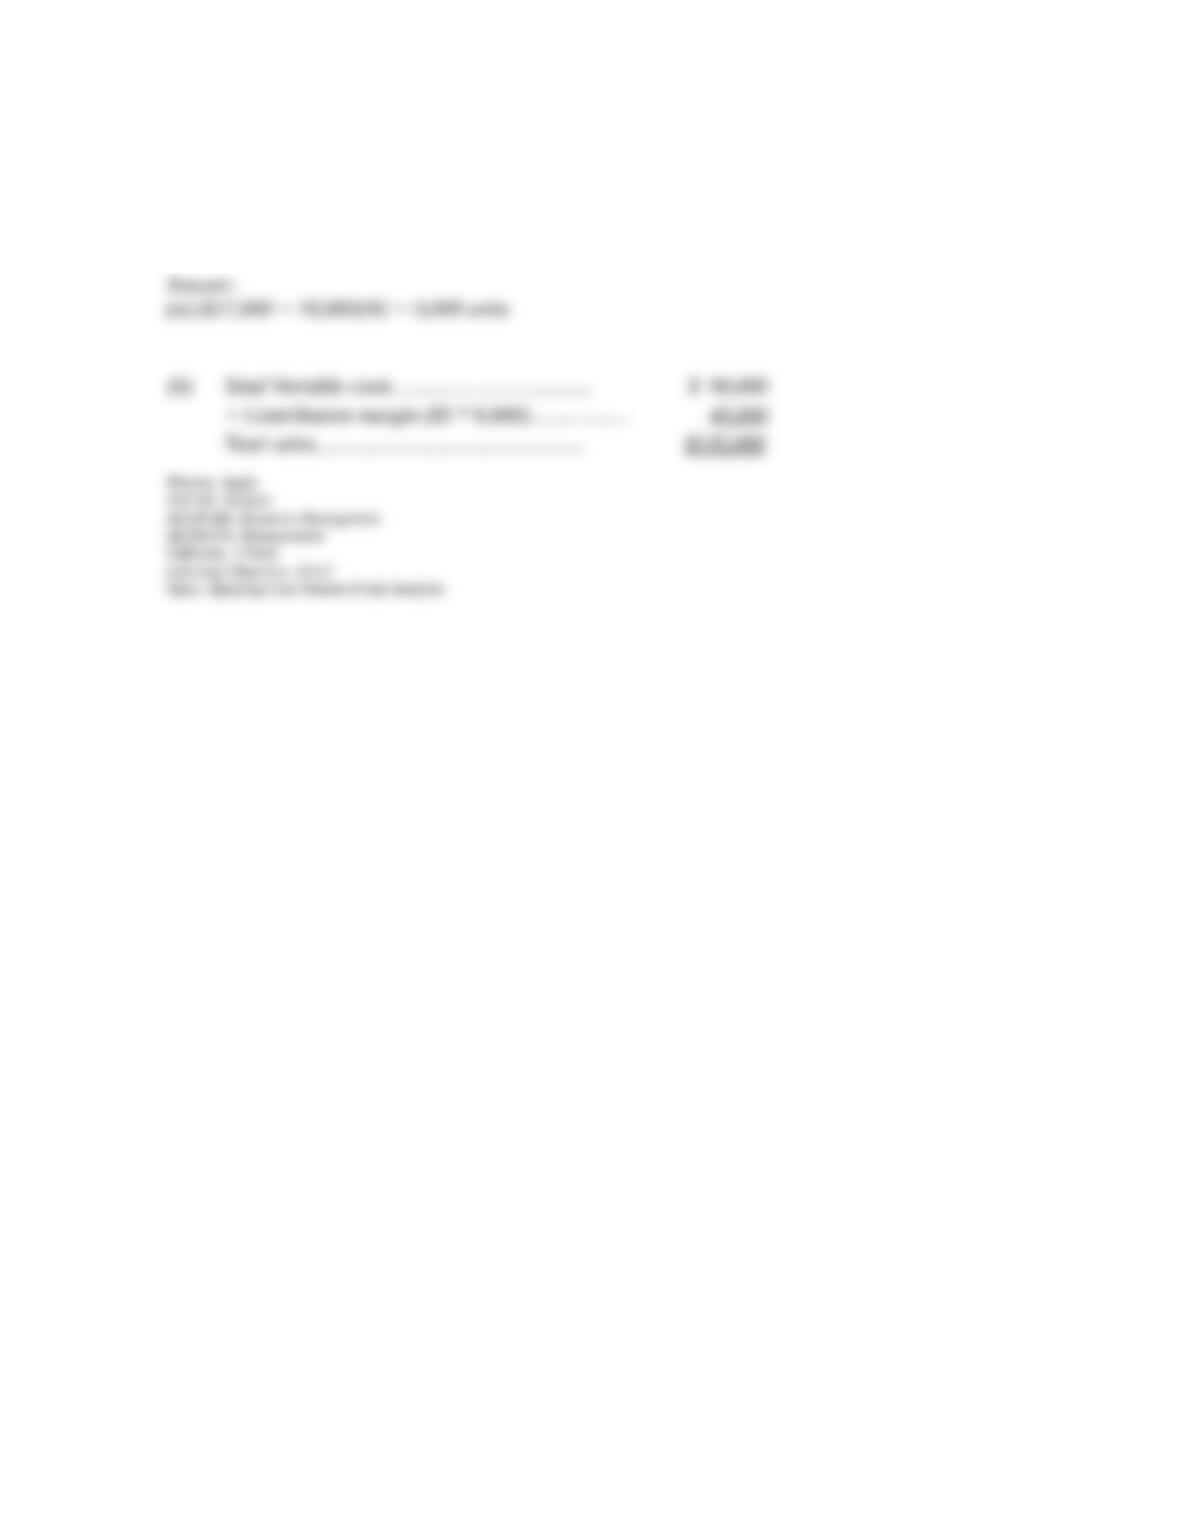
(a) Calculate the number of units expected to be sold.
(b) Calculate the expected total dollar sales.
169. A product is sold for $45 and has variable costs of $33 per unit. The total fixed costs for
the firm are $180,600. If the firm desires to earn a pretax income of $77,400, how many units
must be sold?
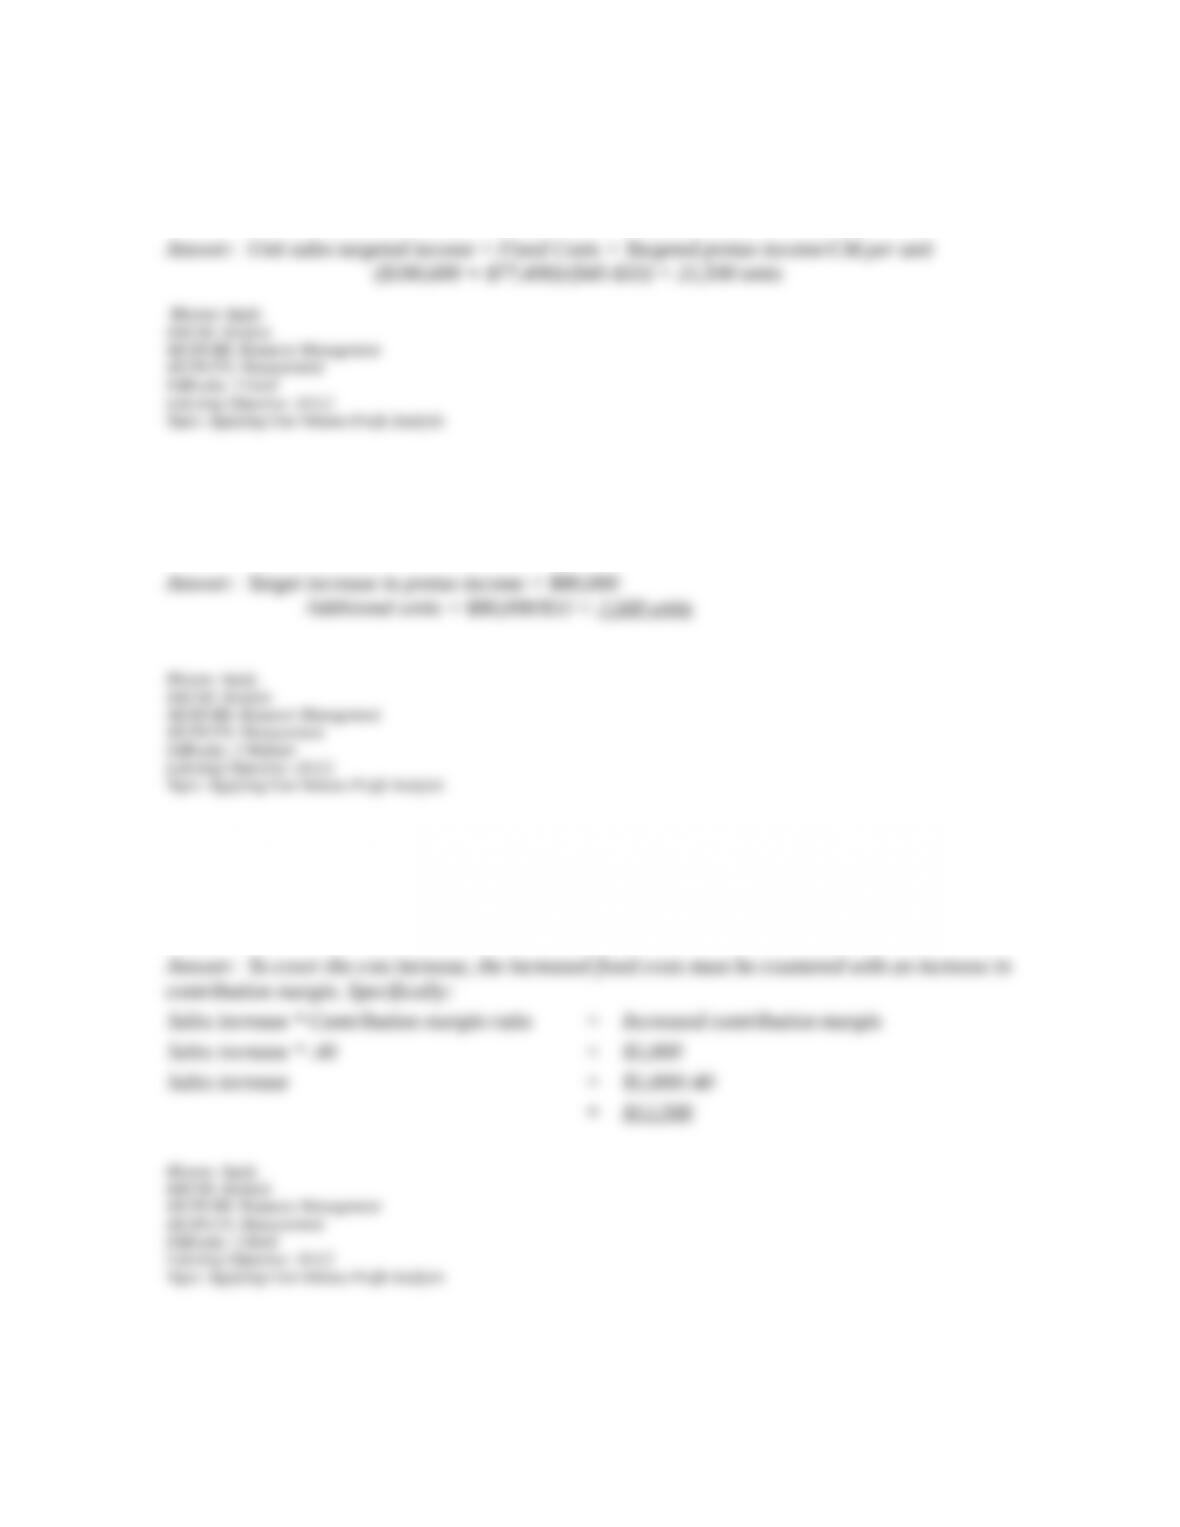
170. A firm produces and sells a product with a contribution margin of $32 per unit. The firm
is presently selling 90,000 units and earning $320,000 in pre-tax income. If the firm desires to
increase its pre-tax income to $ 400,000, how many more units must it sell?
171. Isaacson Co. has total fixed costs of $240,000 and a contribution margin ratio of 40%. If
rent expense increases by $5,000, how much will sales have to increase to cover this increase
in costs?
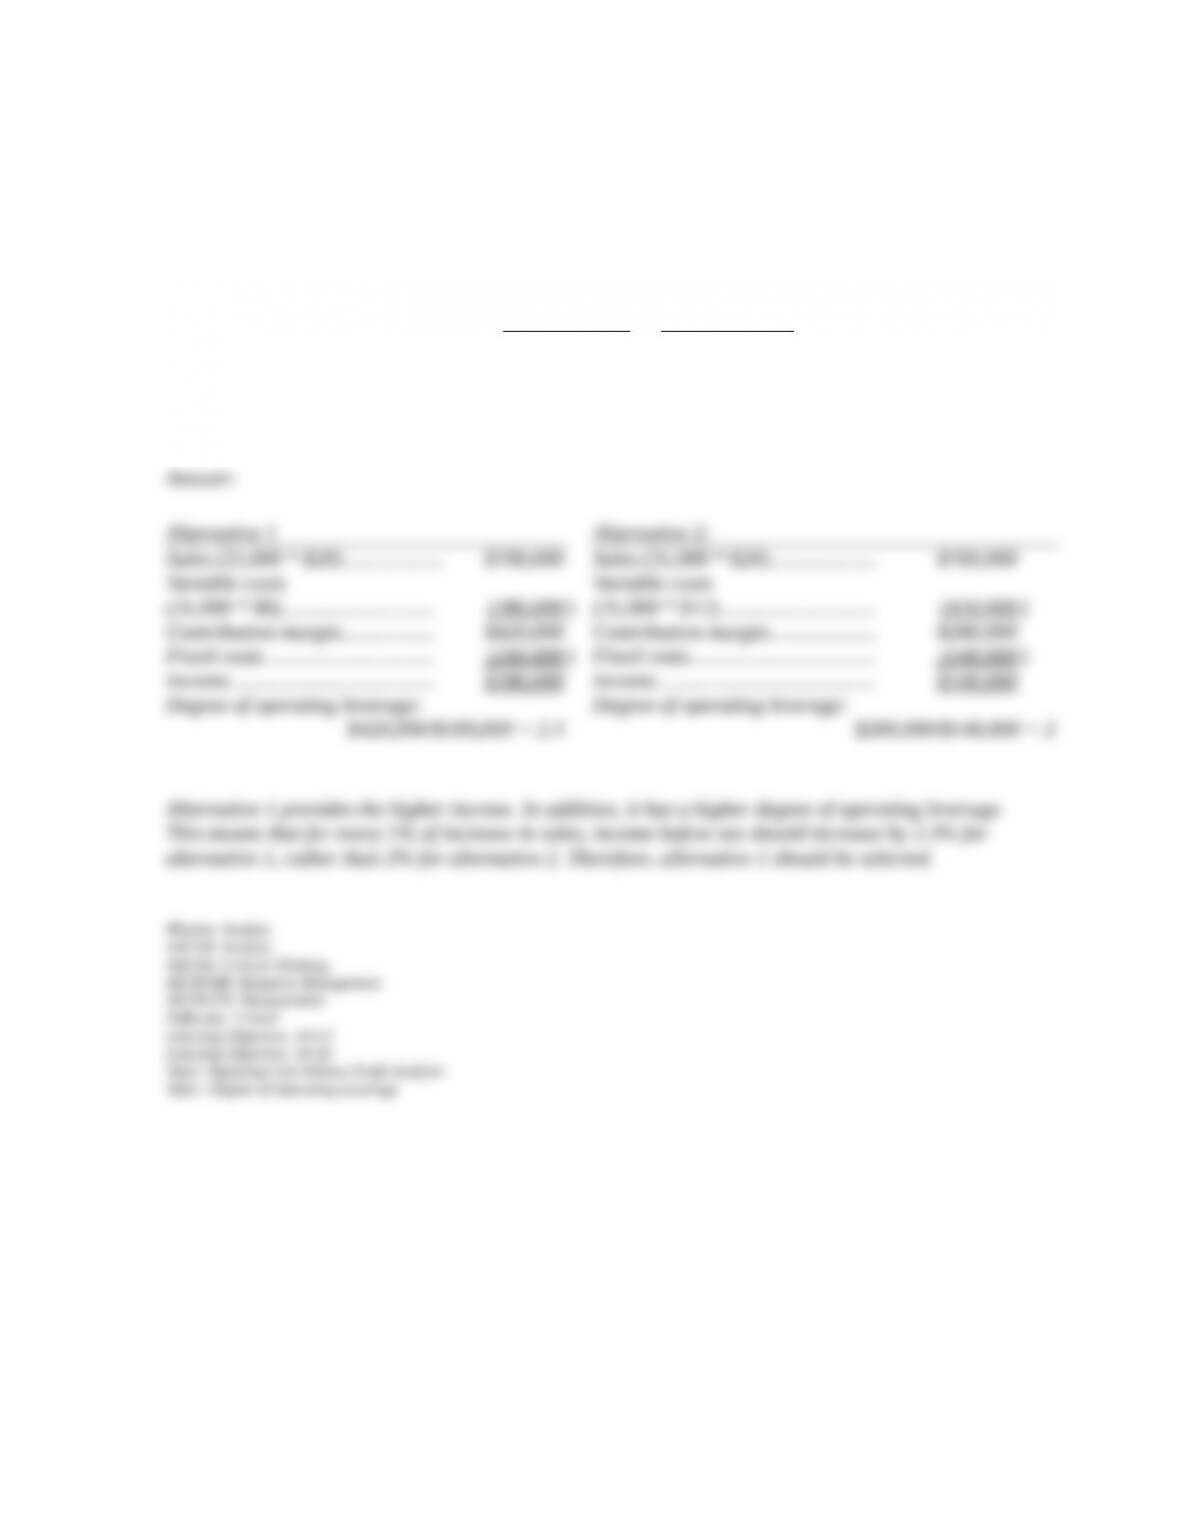
172. A company is looking into two alternative methods of producing its product. The
following information about the two alternatives is available. If the company’s expected sales
volume is 35,000 units, which alternative should be selected? Prepare forecasted income
statements and compute degree of operating leverage to assess the alternatives.
Alternative#1 Alternative #2
Variable costs per unit......... $8 $12
Fixed costs …………………….
$240,000
$140,000
Selling price per unit……….. $20 $20
173. Dodge Industries incurs the following costs during the current year:
Depreciation of machinery …………………. $15,000
Direct labor.….………..…………………………. 6,000
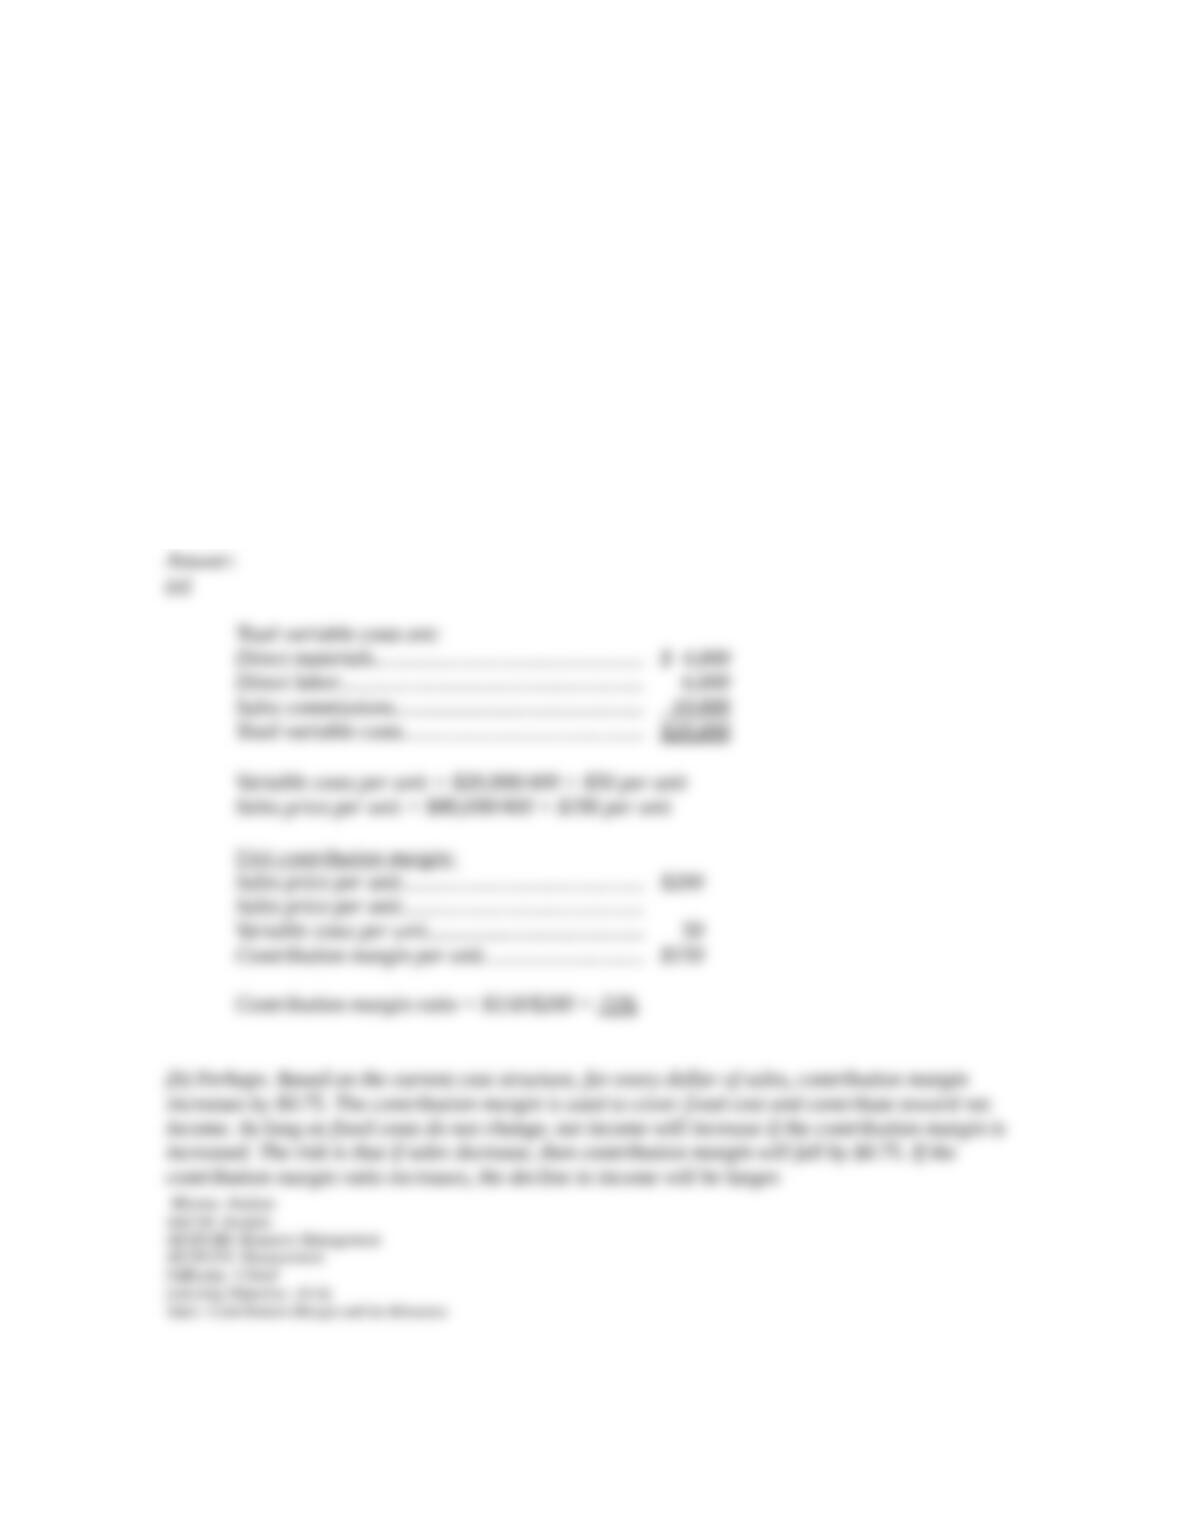
Direct materials……………………………….…. 4,000
Executive salaries….…………………………… 20,000
Insurance………………………………….……….. 2,000
Rent on building………………………………… 8,000
Sales commissions…………………..….……… 10,000
Vehicle lease cost………………………….……. 5,000
Sales for the year were $80,000 and Dodge Industries determined that only the direct
production costs (prime costs) and sales commissions are to be classified as variable costs; all
other costs are classified as fixed costs. Dodge sold 400 units.
(a) Calculate the unit contribution margin and the contribution margin ratio for Dodge
Industries.
(b) Dodge Industries is considering plans that would increase the contribution margin ratio for
next year. Should it pursue these plans? Explain.
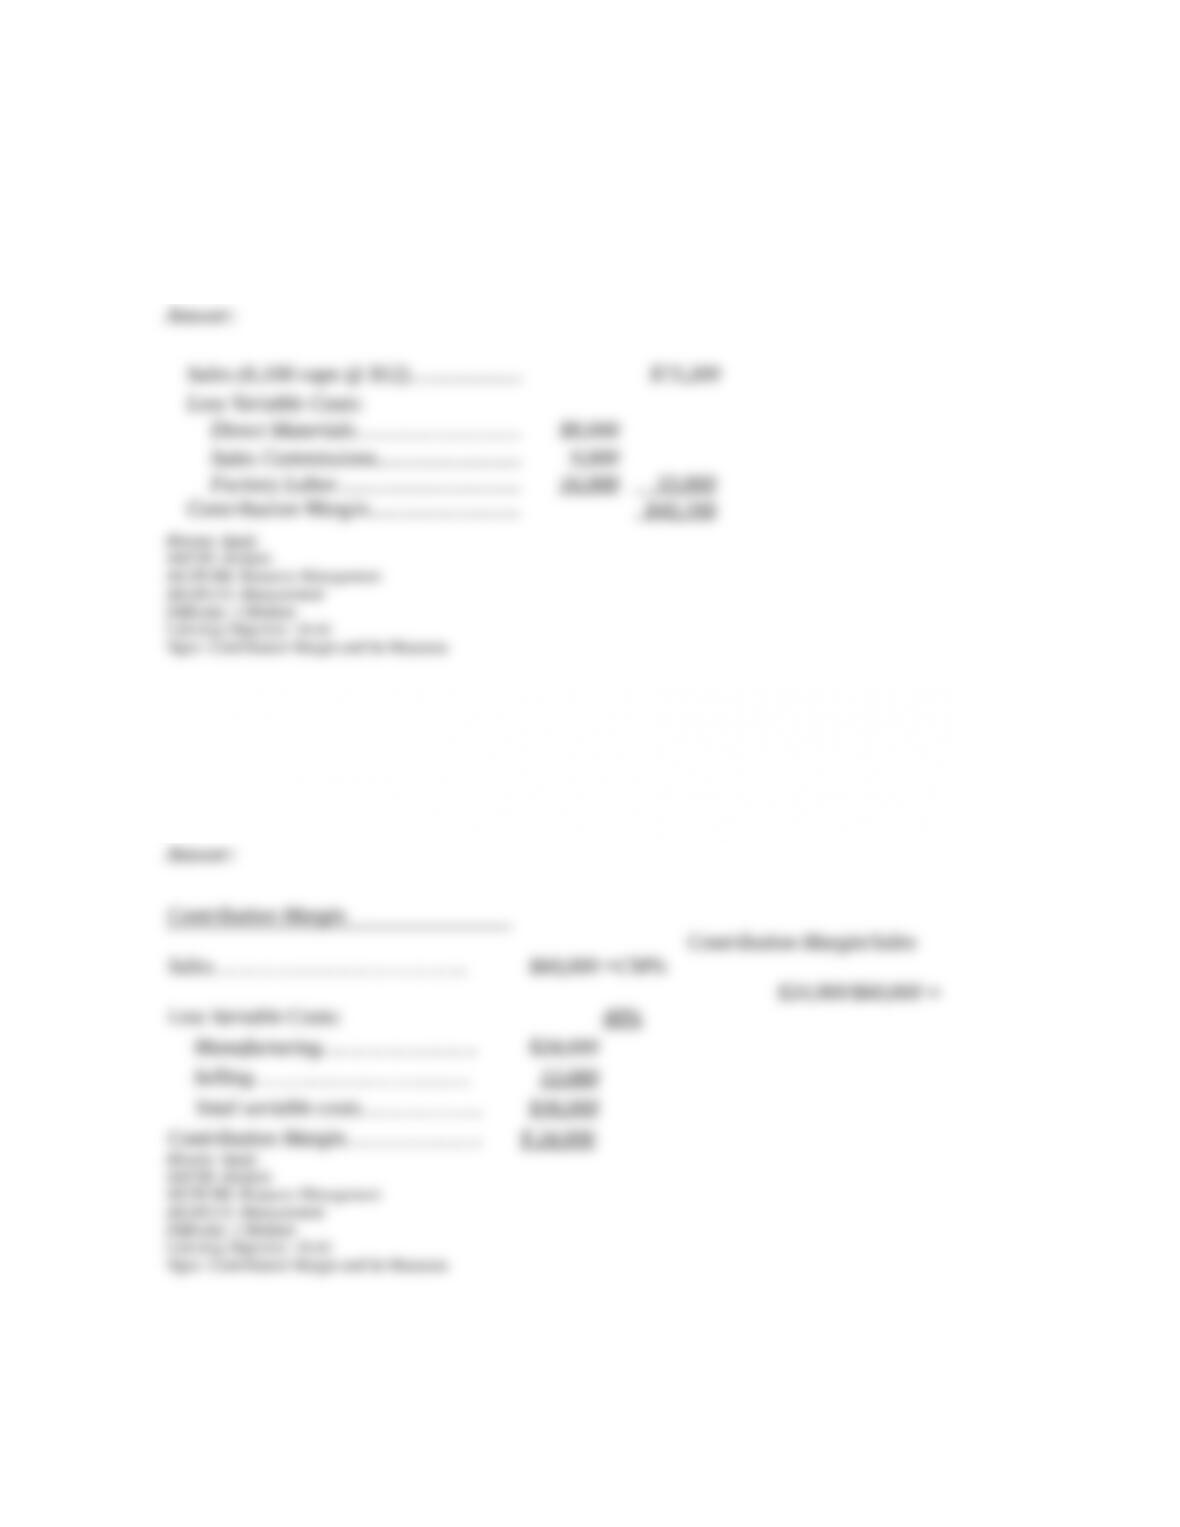
174. Glover Headgear produces specialty logo baseball caps for a variety of customers.
Selected cost data for Glover follows: direct materials cost $8,000; sales commissions,
$9,000; depreciation on factory equipment, $21,000; factory labor, $16,000; factory lease,
$24,000. If Glover sells 6,100 caps at an average price of $12 for each cap, what is the
company’s contribution margin?
175. Ludington Corporation provides the following data from a recent period for its
manufacture of shoes: variable manufacturing costs, $24,000; variable selling costs, $12,000;
and total fixed costs, $40,000. Sales were $60,000 based on 12,000 units sold during the
period. Calculate the contribution margin and the contribution margin ratio.
176. A company has total fixed costs of $360,000. Its product sells for $40 per unit and
variable costs amount to $25 per unit. What is the break-even point in dollar sales?
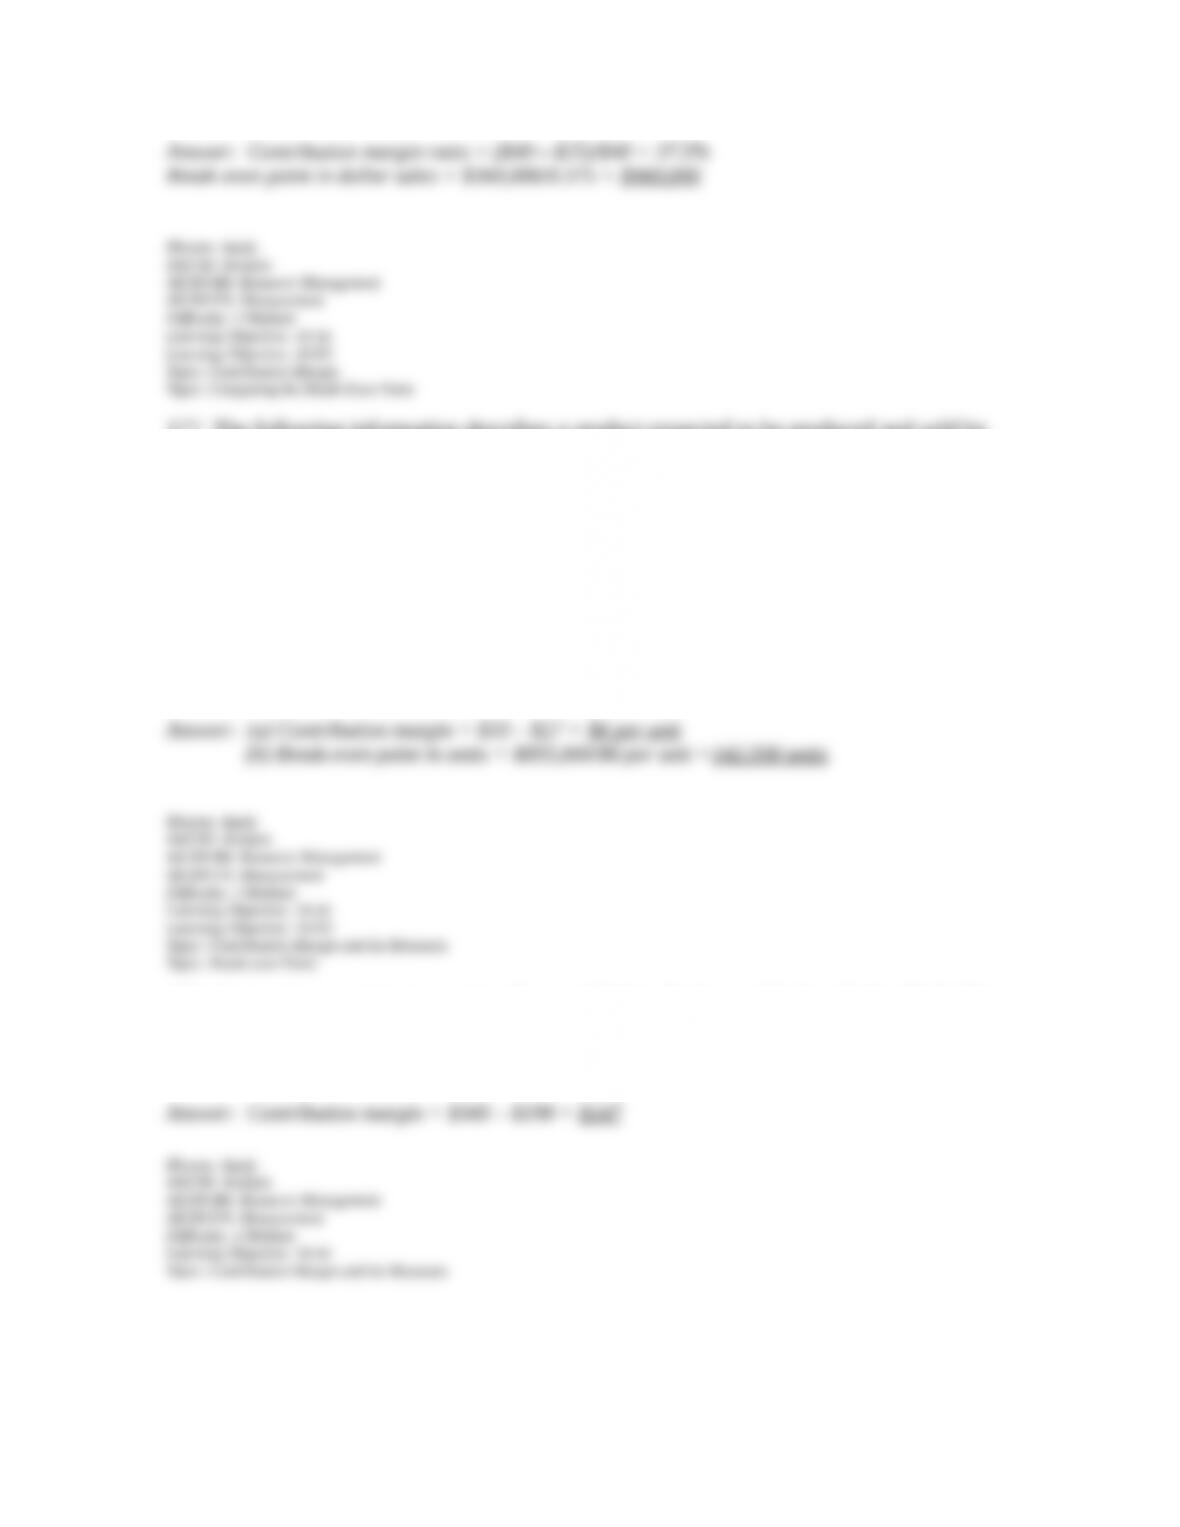
177. The following information describes a product expected to be produced and sold by
Quark Corporation:
Selling price……………………………………..………. $33 per unit
Variable costs…………………………………..……….. $27 per unit
Total Fixed costs……………………………………….. $855,000 per year
Required:
(a) Calculate the contribution margin per unit.
(b) Calculate the break-even point in units.
178. A company manufactures and sells searchlights. Each searchlight sells for $345. The
variable cost per unit is $198, and the company’s total fixed costs are $635,000. Predicted
sales are 15,000 units. What is the contribution margin per unit?
179. Clockworks Co. reports the following data for the current year:
Units Sold……………………………………………………..….…… 1,200
Unit Sales Price……………………………………….………….…. $30
Unit Variable Cost………………………………………….………. $10
Total Fixed Cost……………………………………….. $18,000
Required:
(a) Calculate Clockworks’ pretax income.
(b) Calculate Clockworks’ degree of operating leverage.
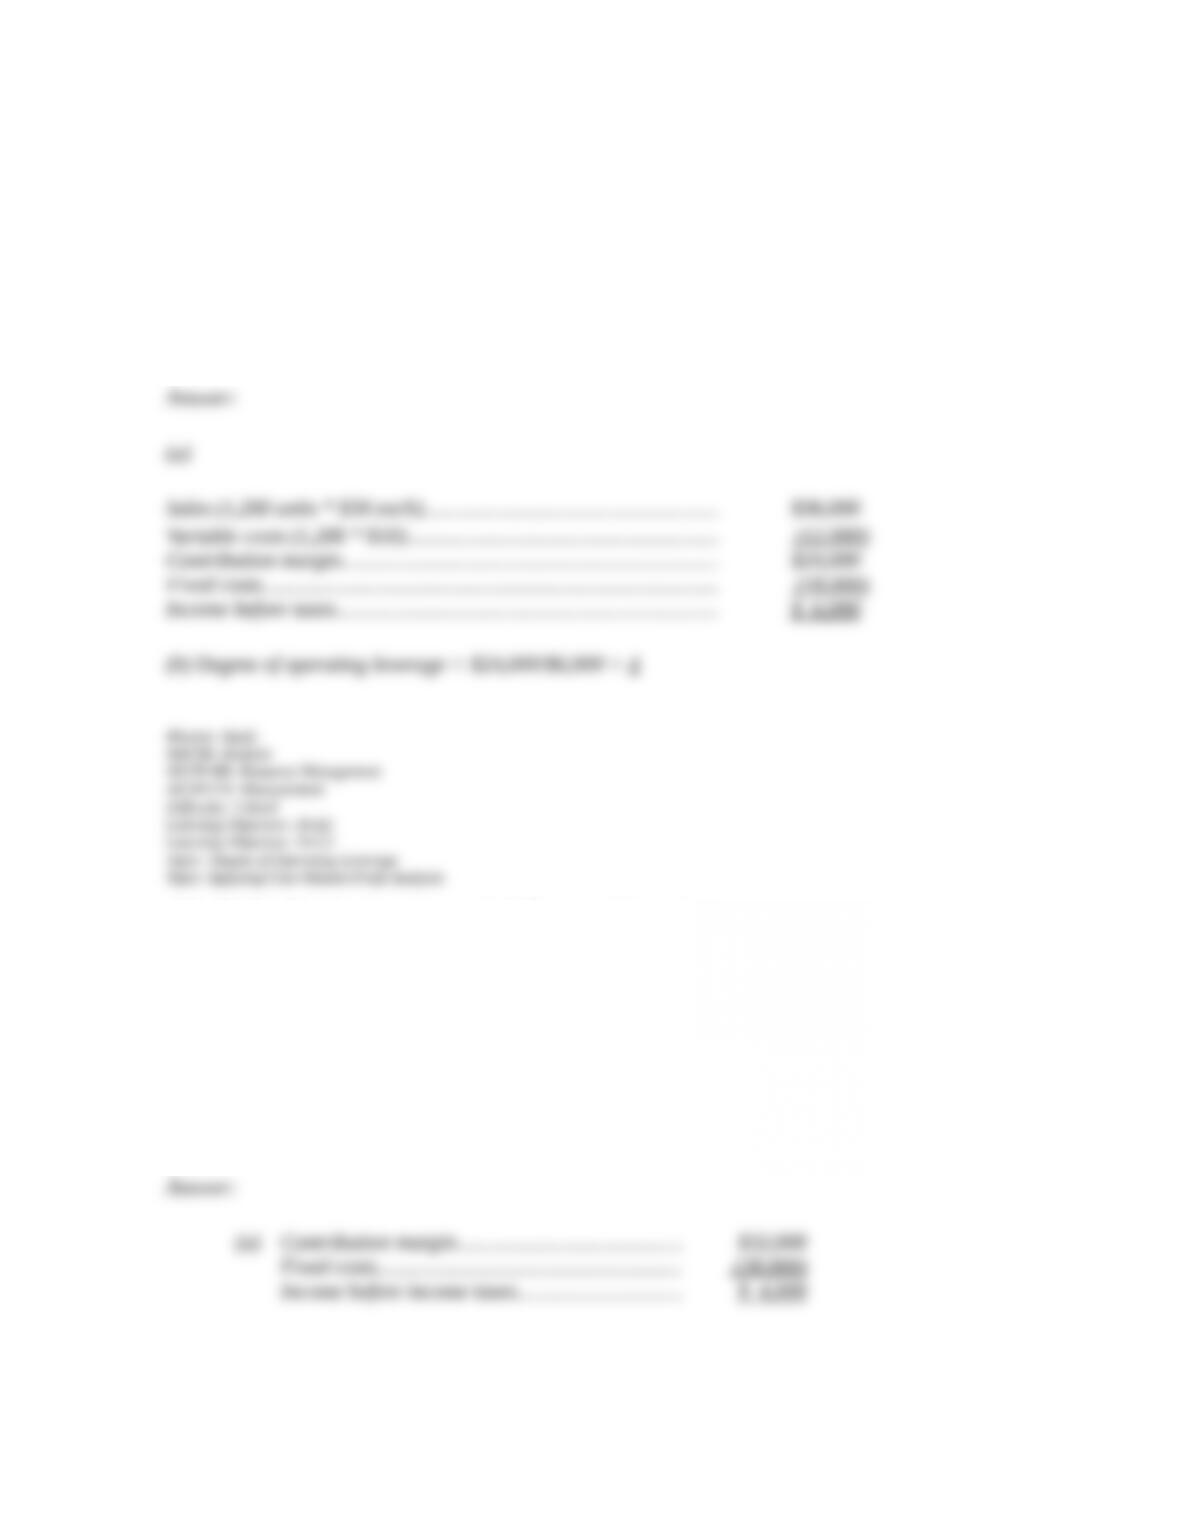
180. Fielder Productions reports the following information:
Total Contribution Margin………………….. $32,000
Total Fixed Costs……………………………. $28,000
Required:
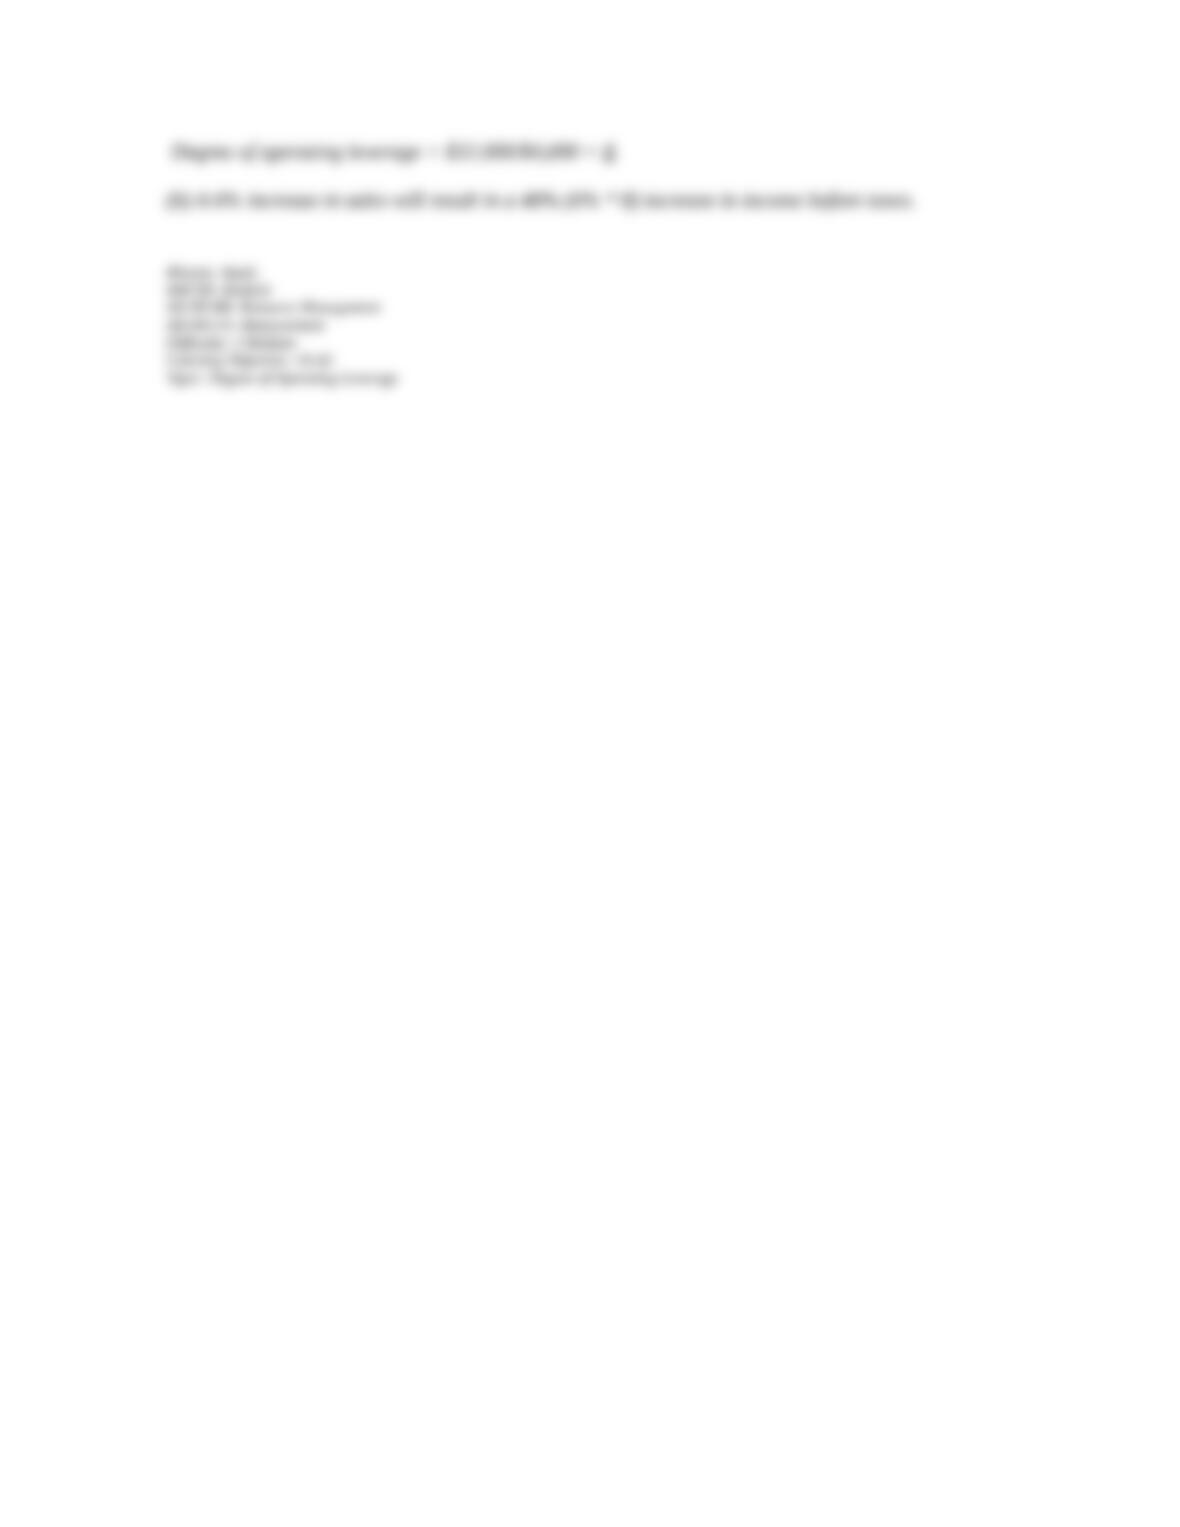
(a) Calculate Fielder’s degree of operating leverage (DOL).
(b) Fielder Productions forecasts a 6% increase in sales. What is the expected effect in percent
on pretax income?
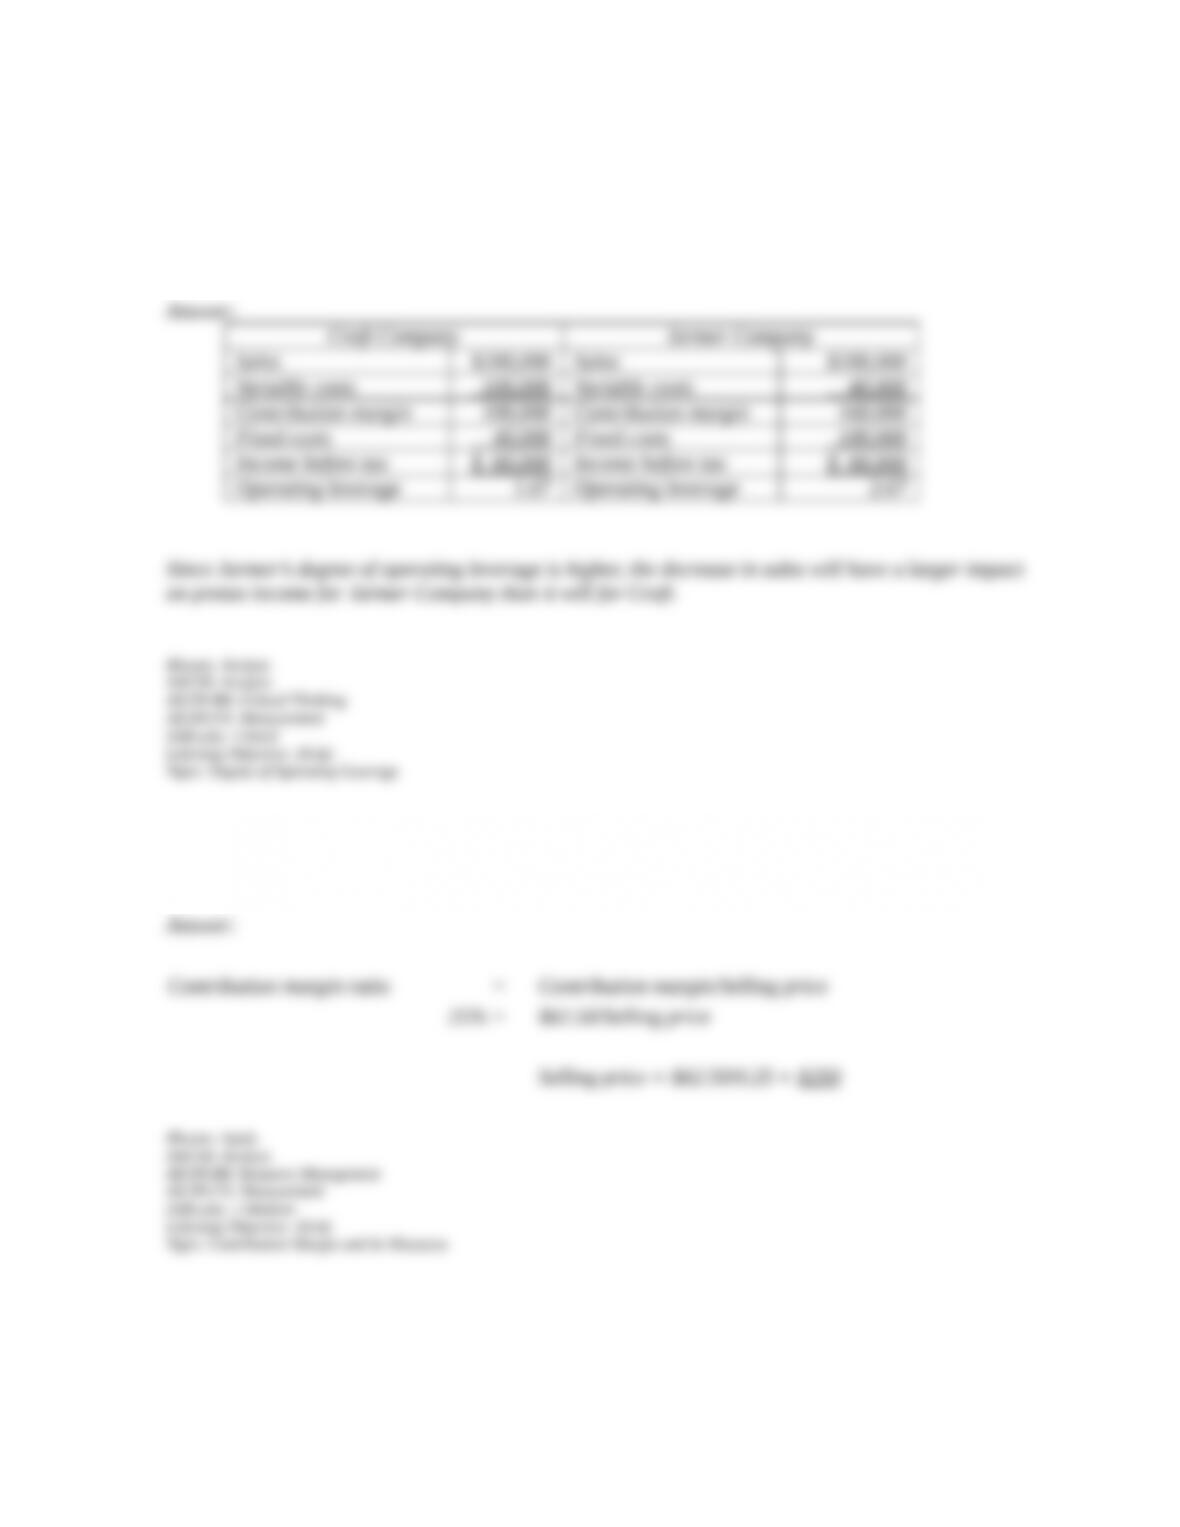
181. Craft Company and Jarmer Company each have sales of $200,000 and costs of $140,000.
Craft Company’s costs consist of $40,000 fixed and $100,000 variable, while Jarmer
Company’s costs consist of $100,000 fixed and $40,000 variable. Which company will suffer
the greatest decline in profits if sales volume declines by 15%? Prepare income statements
and compute degree of operating leverage to assess.
182. Wolowitz Company’s product has a contribution margin per unit of $62.50 and a
contribution margin ratio of 25%. What is the per unit selling price of the product?
183. A company sells a single product that has a contribution margin ratio of 28%. If the
company’s total fixed costs are $84,000, what is the break-even point in dollar sales?
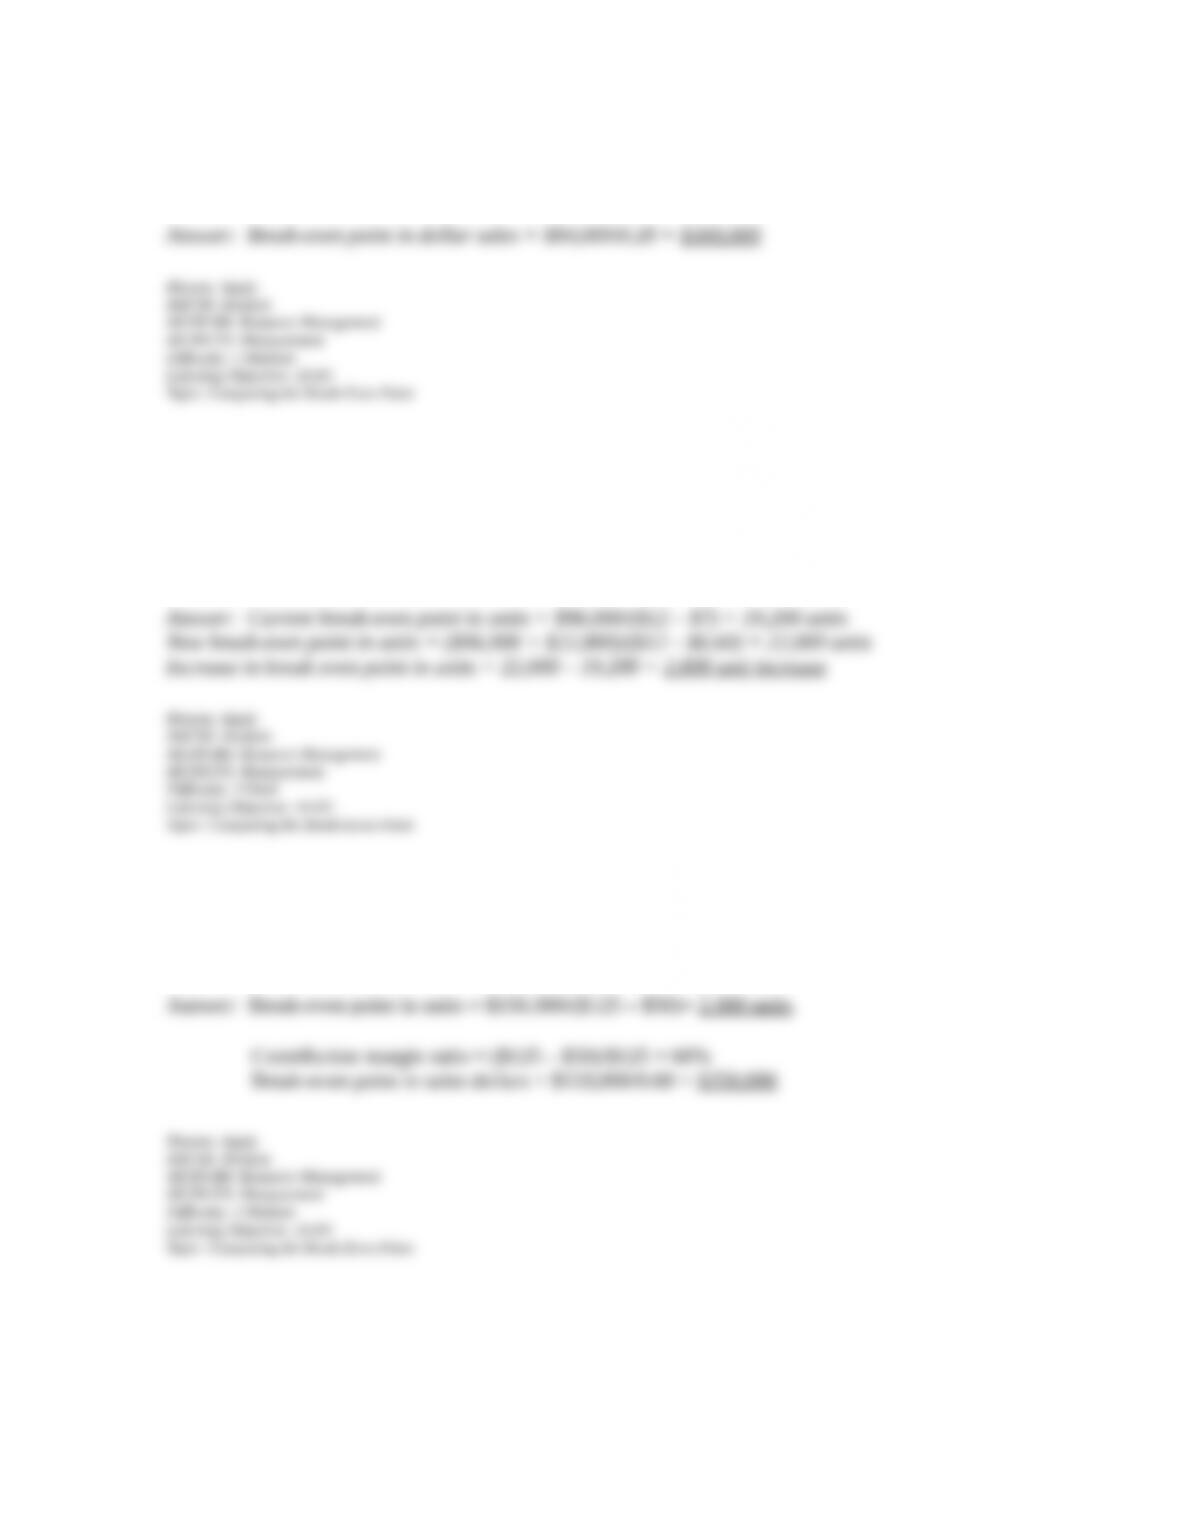
184. Elk Co. manufactures a product that sells for $12 per unit. Total fixed costs are $96,000
and variable costs are $7 per unit. Elk can buy a newer production machine that will increase
total fixed costs by $22,800 but variable costs will be decreased by $0.40 per unit. What effect
would the purchase of the new machine have on Elk’s break-even point in units?
185. Expanse Co. is considering the production and sale of a new product line with the
following sales and cost data: unit sales price $125; unit variable costs $50; and total fixed
costs of $150,000. Calculate the break-even point in units and in dollar sales.
186. Seaquest Company’s contribution margin income statement is presented below. Sales for
the current period consisted of 5,000 units. Determine the company’s break-even point in
dollars.
Seaquest Company
Contribution Margin Income Statement
Sales $125,000
Variable costs 90,000
Contribution margin 35,000
Fixed costs 28,000
Net income $7,000
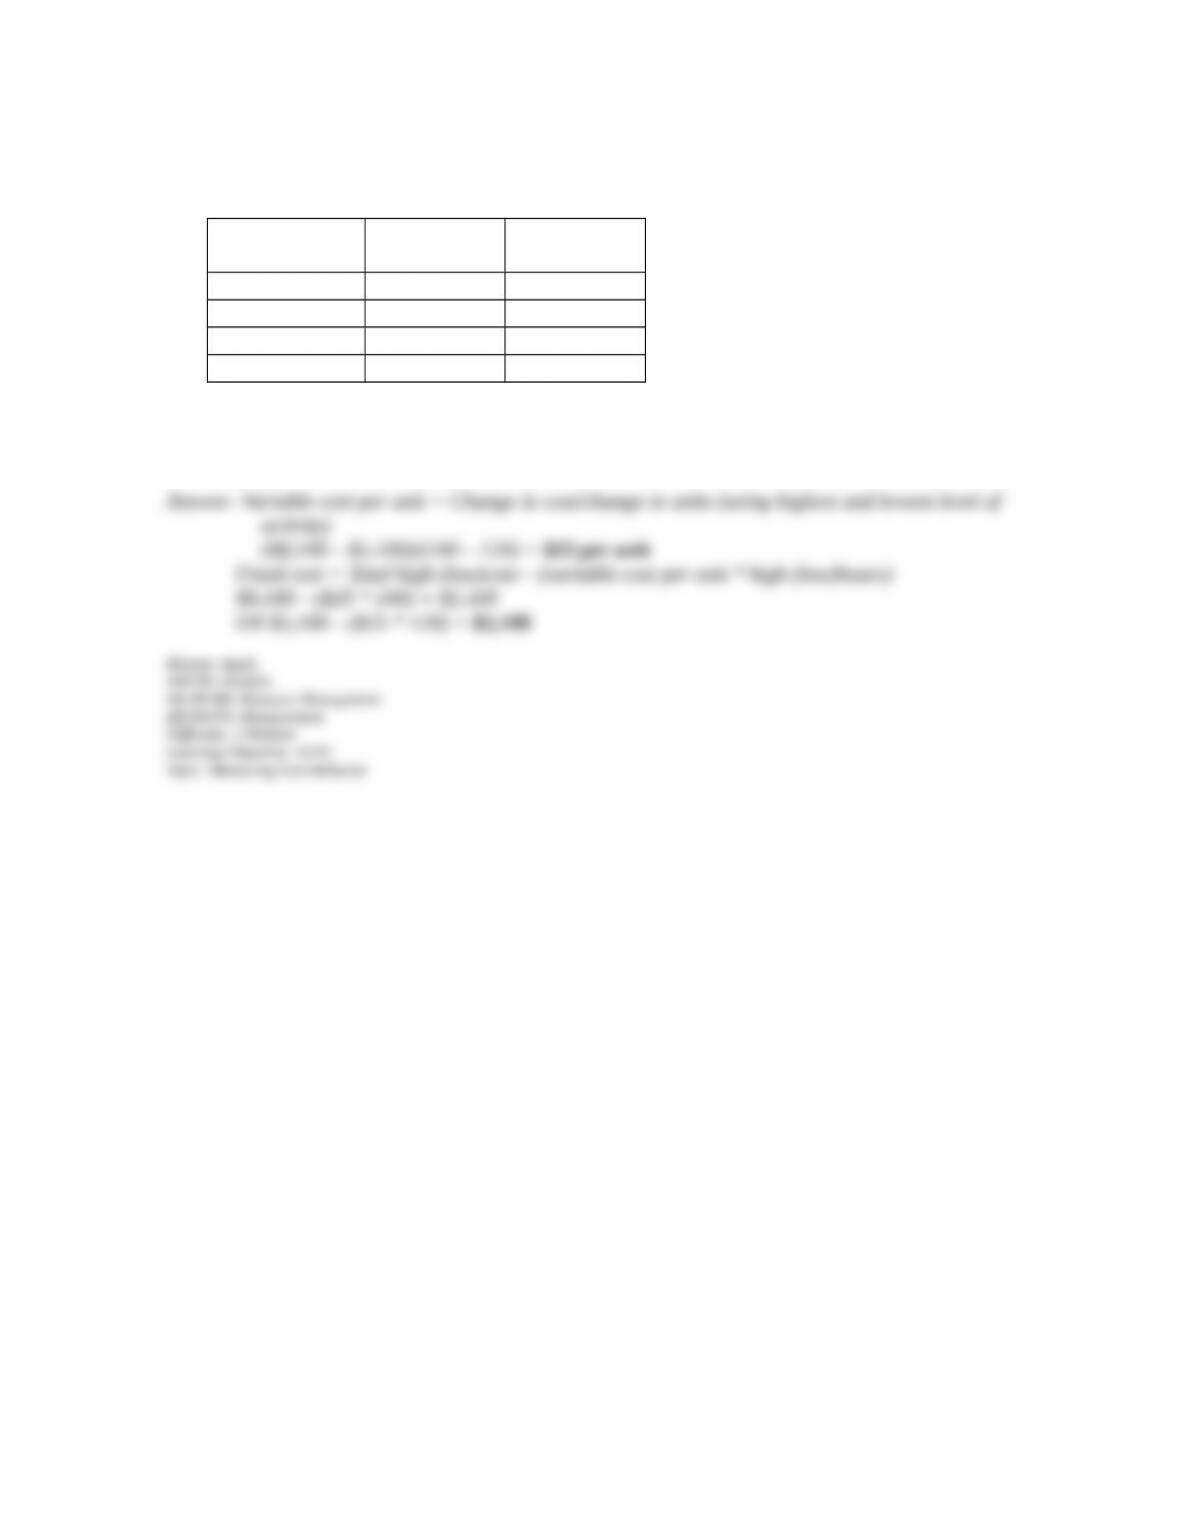
187. The following information is available for Alba Company’s maintenance cost over the
last four months.
Month
Maintenanc
e hours
Maintenanc
e cost
January 150 $6,000
February 120 $5,100
March 240 $8,100
April 210 $6,900
Use the high-low method to estimate both the fixed and variable component of its
maintenance cost.
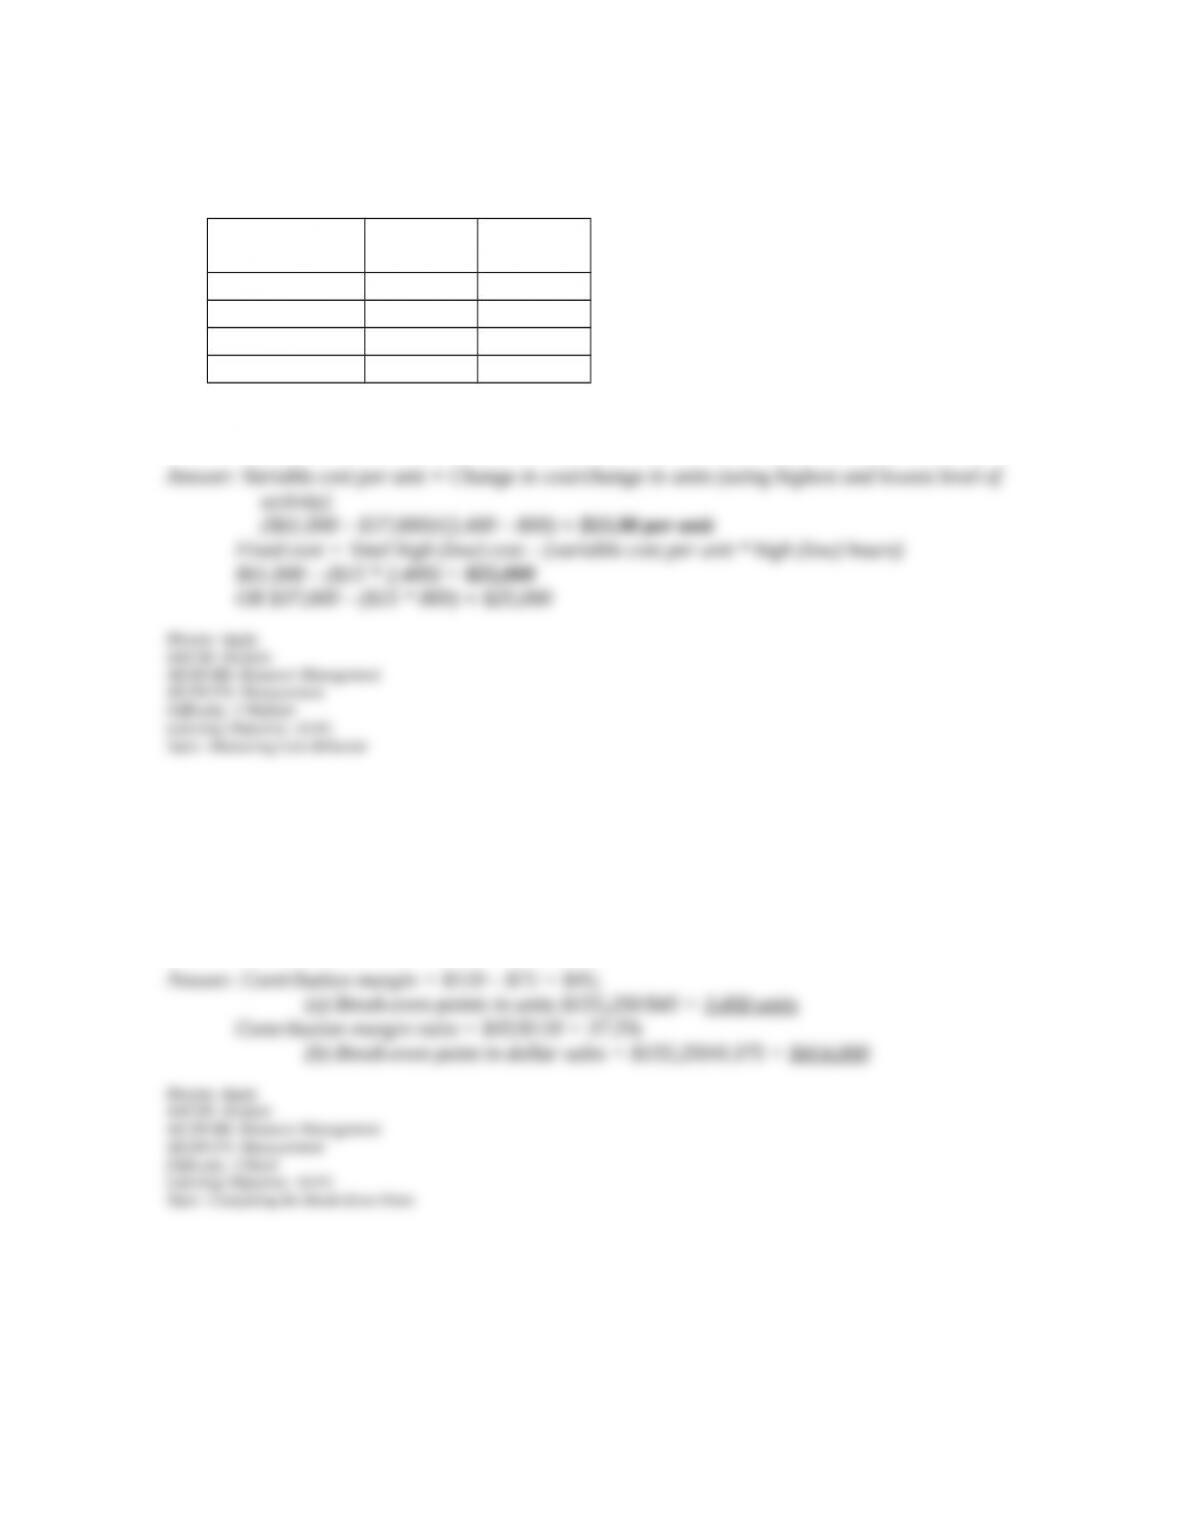
188. The following information is available for a company’s cost of sales over the last five
months.
Month
Units
sold
Cost of
sales
January 1,200 $43,000
February 800 $37,000
March 1,600 $49,000
April 2,400 $61,000
Use the high-low method to estimate the fixed and variable components of the cost of sales.
189. A company manufactures a product and sells it for $120 per unit. The total fixed costs of
manufacturing and selling the product are expected to be $155,250, and the variable costs are
expected to be $75 per unit. What is the company’s break-even point in (a) units and (b) dollar
sales?
190. A product has a contribution margin per unit of $17 and sells at $25 per unit. If the
break-even point is 82,000 units, calculate (a) the variable costs per unit and (b) the total fixed
costs.
191. A firm provides the following sales data:
Expected unit sales.. 5,000 Unit variable cost….. $10
Unit selling price…. $16 Total fixed cost……. $12,000
Required:
(a) Calculate the break-even point in dollar sales.
(b) Calculate the margin of safety in dollar sales.
192. Parker Co. is preparing next period’s forecasts. Total fixed costs are expected to be
$300,000 and the contribution margin ratio is expected to be 30%.
(a) Calculate the company’s break-even point in dollar sales.
(b) If sales are $1,800,000 above the break-even point, what will Parker’s pretax income be?
193. The following information describes a product expected to be produced and sold by
Garrison Company:
Selling price……………..……………………………… $80 per unit
Variable costs…………………….…….………………. $32 per unit
Total fixed costs…………………………………….…. $630,000
Required:
(a) Calculate the contribution margin ratio.
(b) Calculate the break-even point in dollar sales.
(c) What dollar amount of sales would be necessary to achieve a pretax income of $120,000?
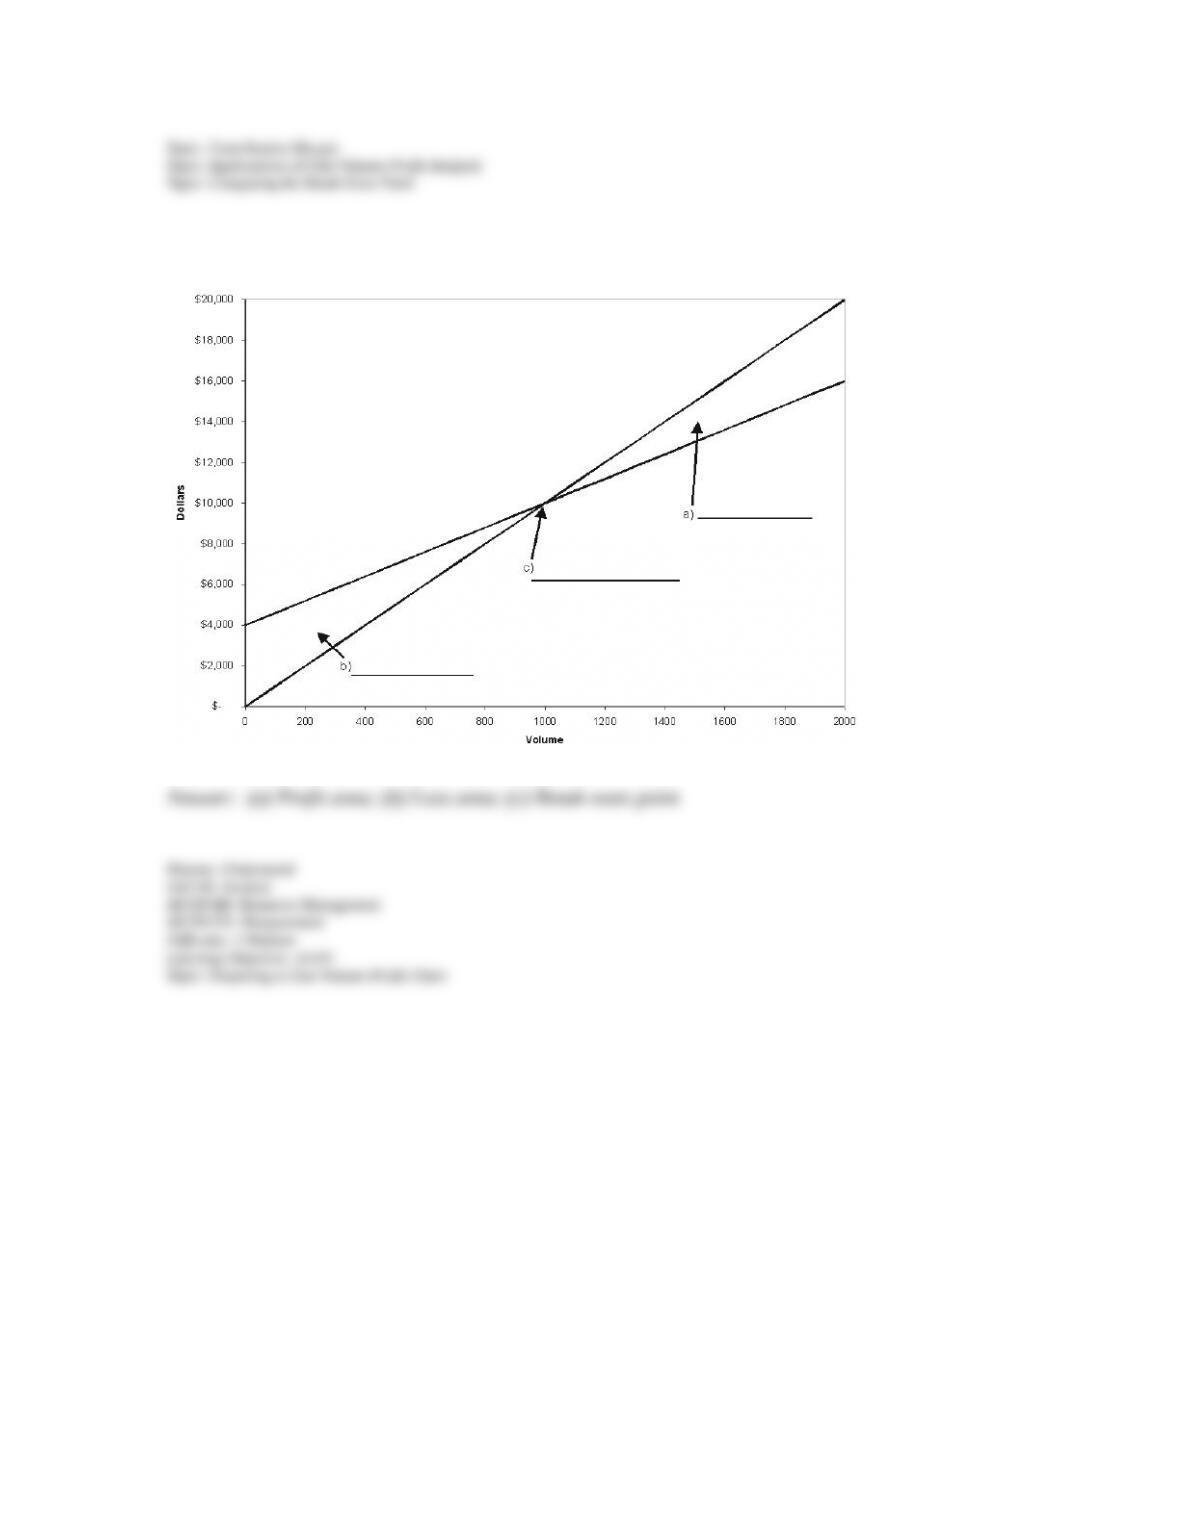
194. Identify items a, b, and c in the cost-volume-profit graph shown below.
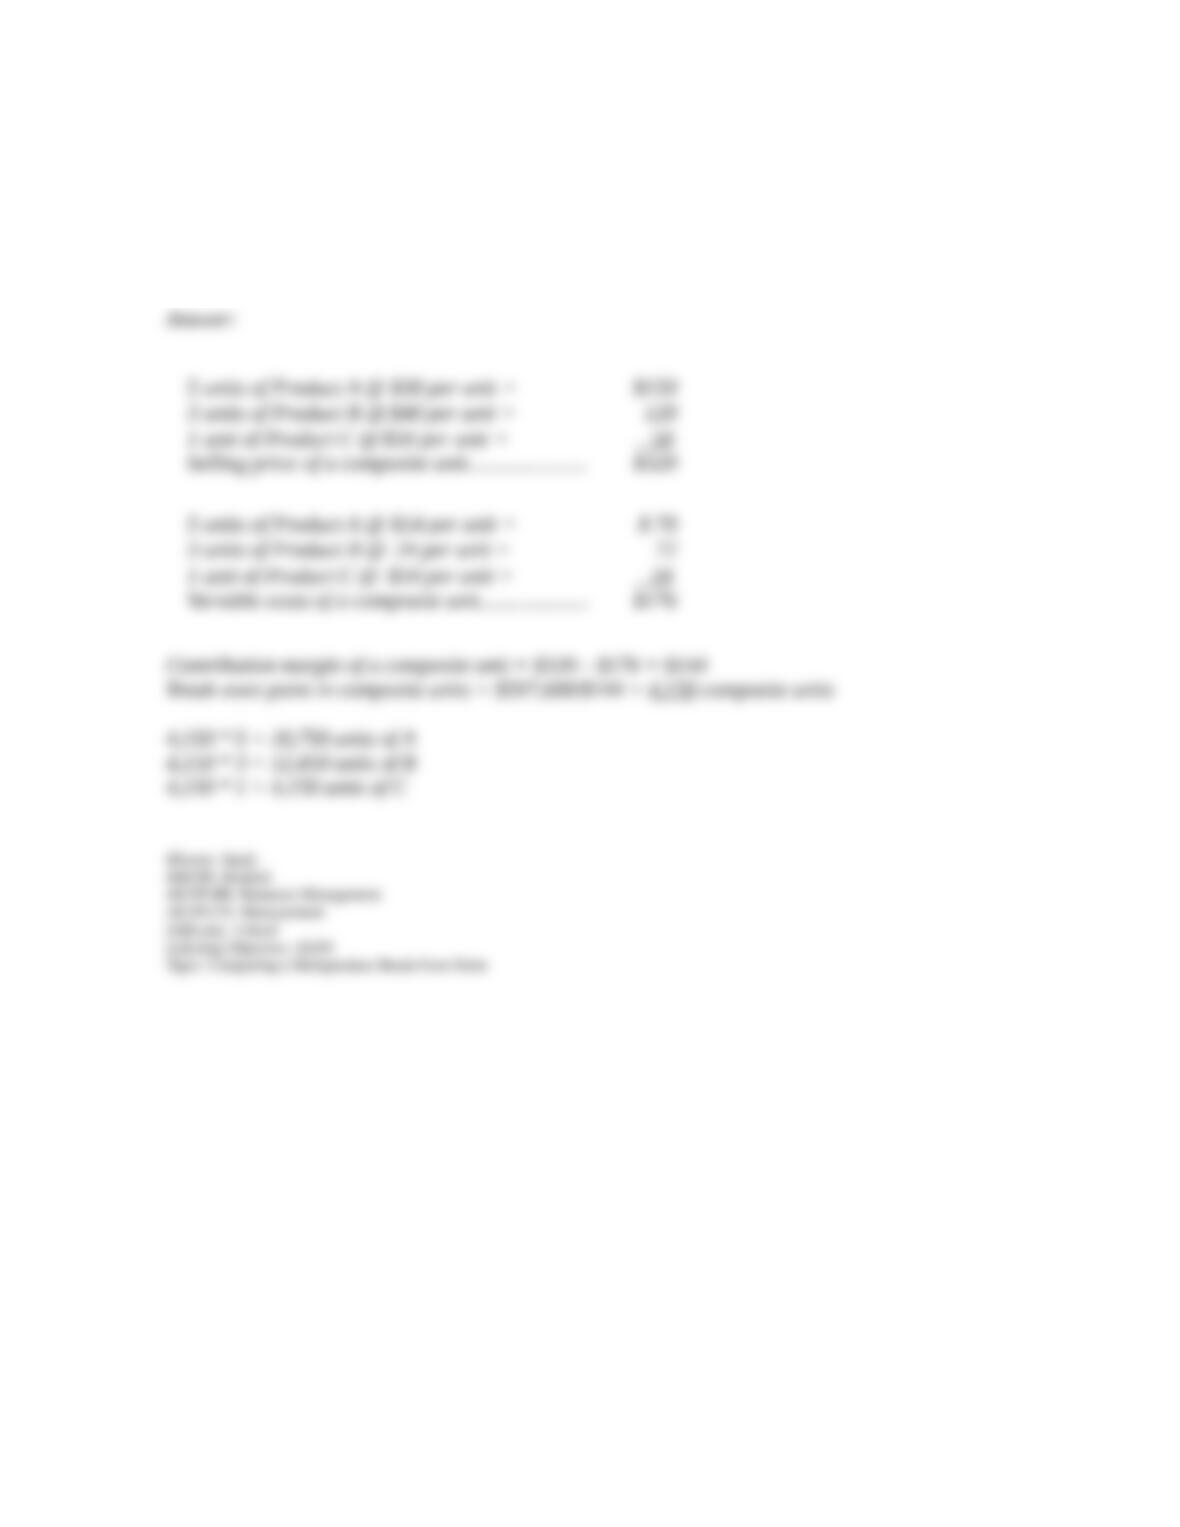
195. The sales mix of Desert Springs Company is 5 units of A, 3 units of B, and 1 unit of C.
Per unit sales prices for each product are $30, $40, and $50, respectively. Variable costs per
unit are $14, $24, and $34, respectively. Fixed costs are $597,600. What is the break-even
point in composite units and in units of A, B, and C?
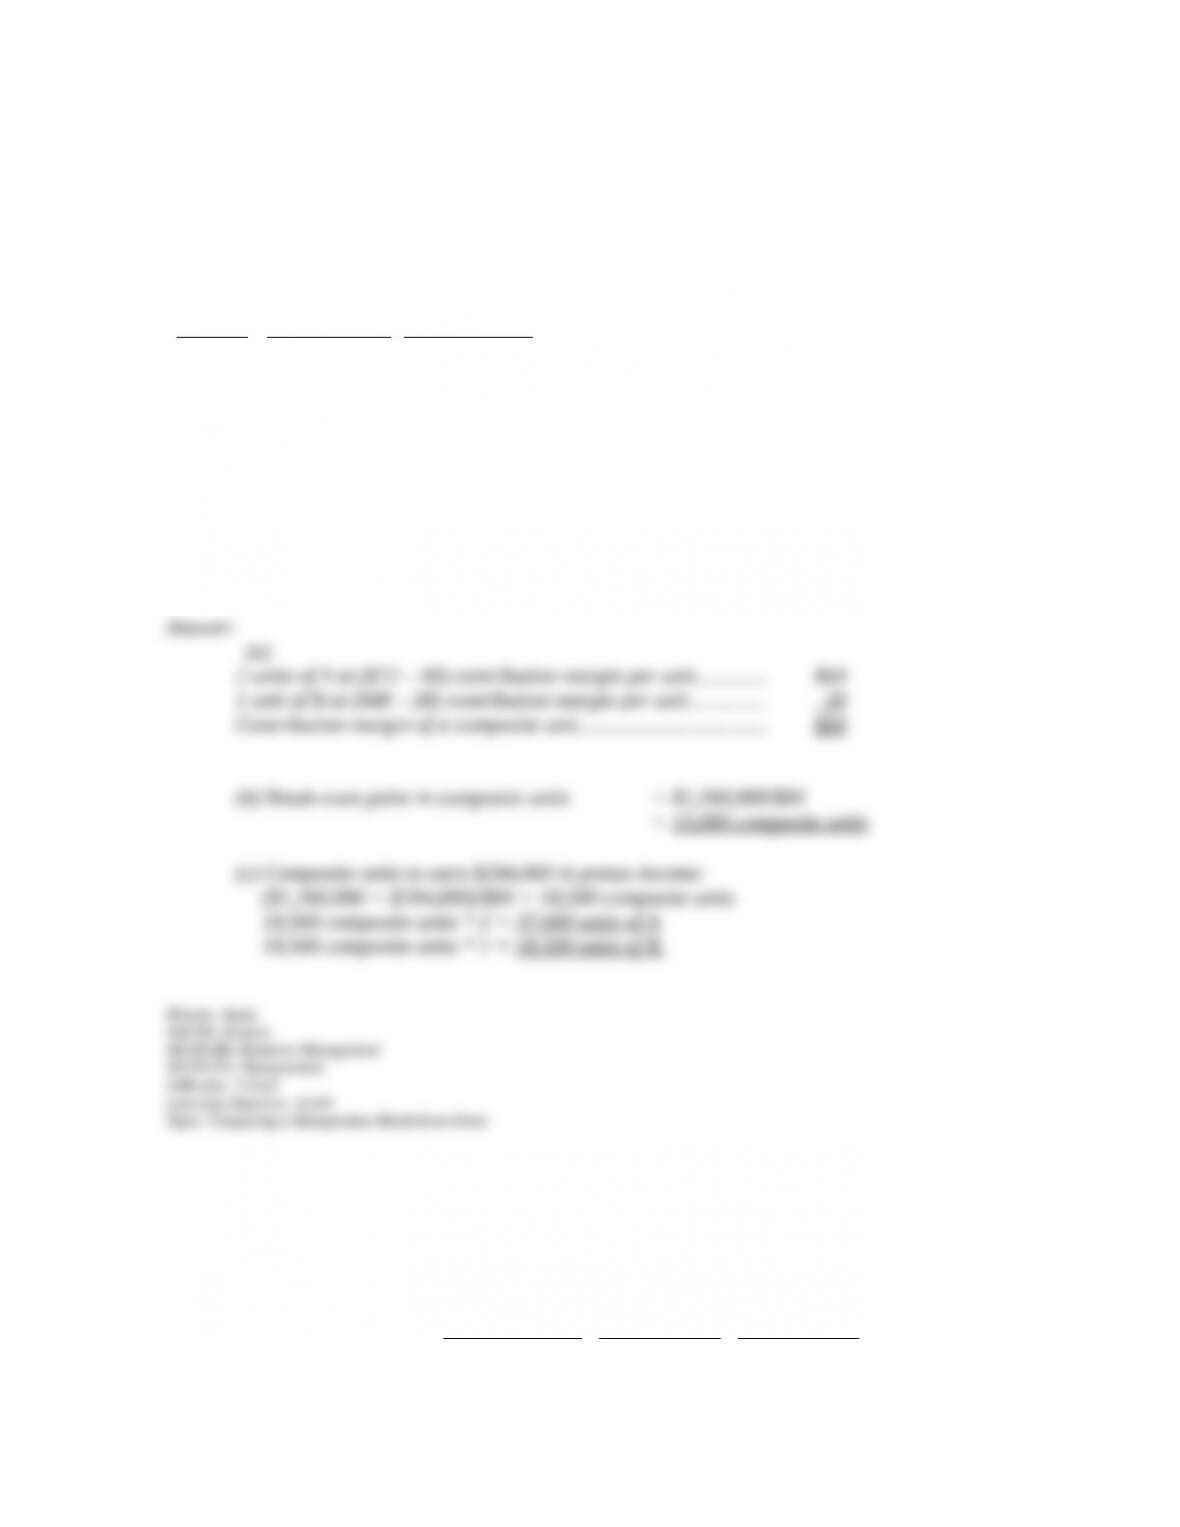
196. A firm sells two different products, A and B. For each unit of B, the firm sells two units
of A. Total fixed costs for this firm are $1,260,000. Additional selling prices and cost
information for both products follow:
Product
Selling
Price per unit
Variable
Costs per unit
A……. $72 $40
B……. 48 28
Required:
(a) Calculate the contribution margin per composite unit.
(b) Calculate the break-even point in units of each individual product.
(c) If pretax income before taxes of $294,000 is desired, how many units of A and B must be
sold?
197. Benjamin Co. has three products A, B, and C, and its fixed costs are $69,000. The sales
mix for its products are 3 units of A, 4 units of B, and 1 unit of C. Information about the three
products follows:
A B C
Projected sales in dollars….. $192,000 $192,000 $64,000
Selling price per unit………. $40 $30 $40
Contribution margin ratio…… 30% 35% 35%
(a) Calculate the company’s break-even point in composite units and sales dollars.
(b) Calculate the number of units of each individual product to be sold at the break-even
point.
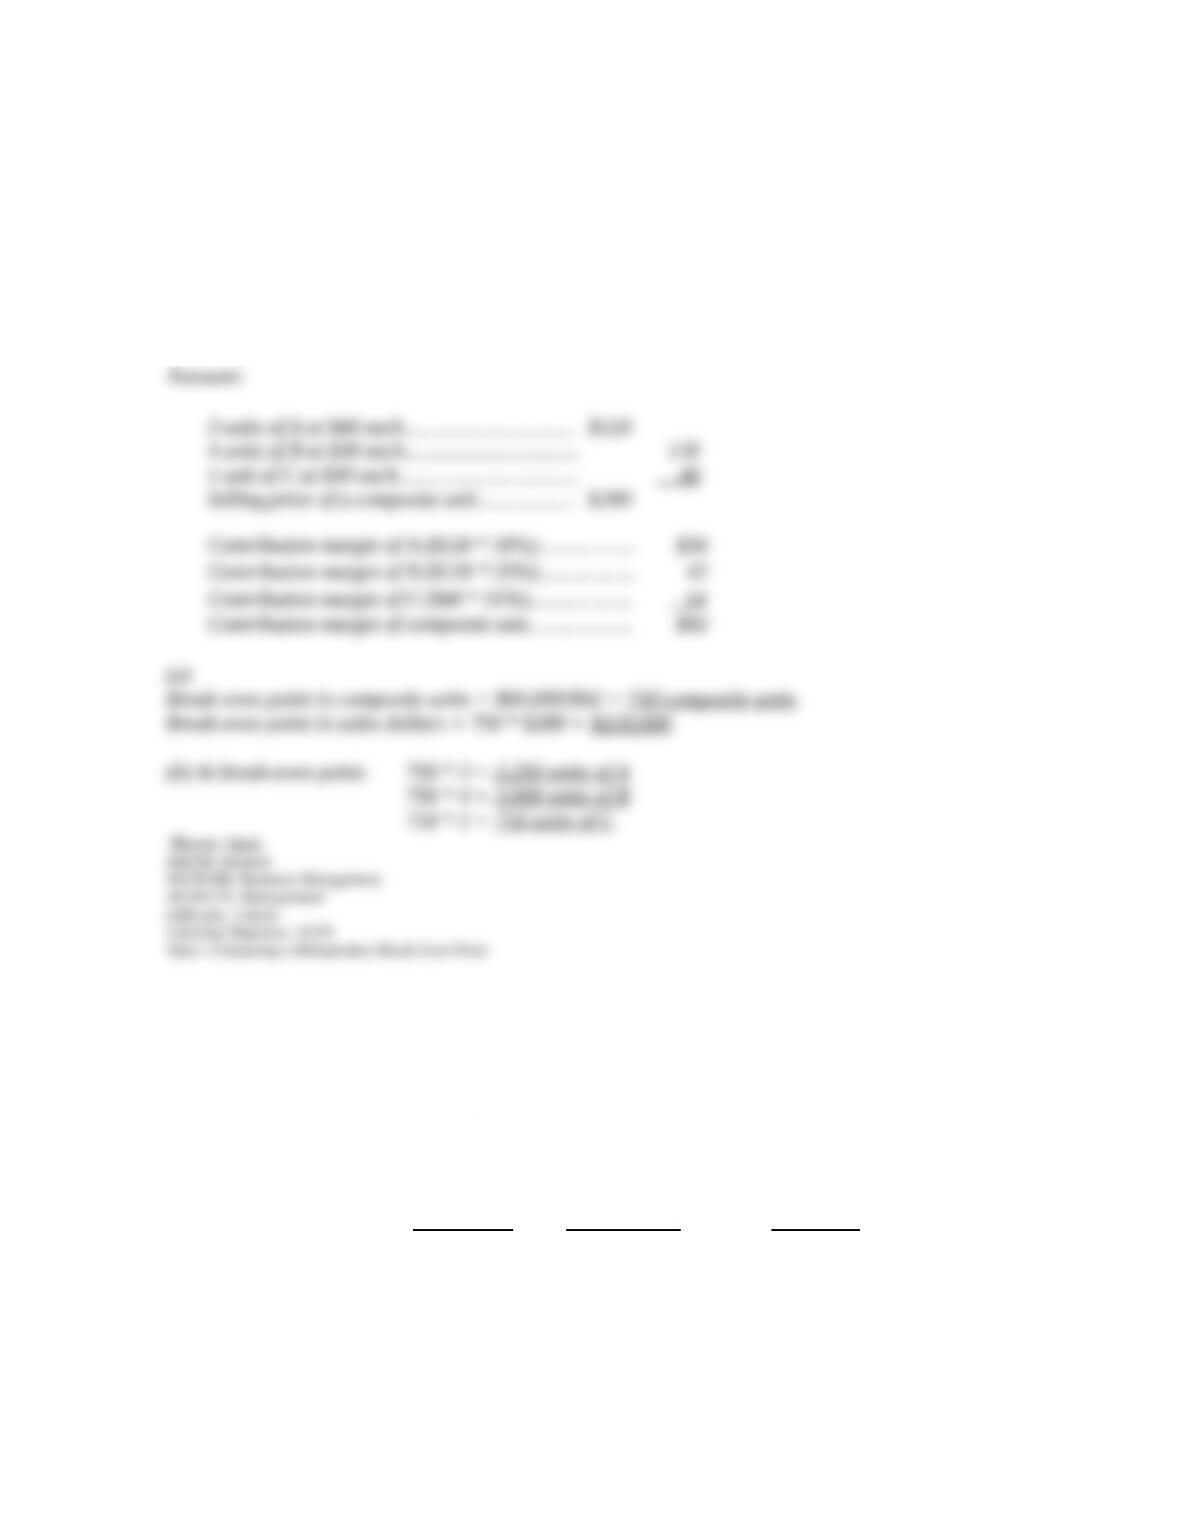
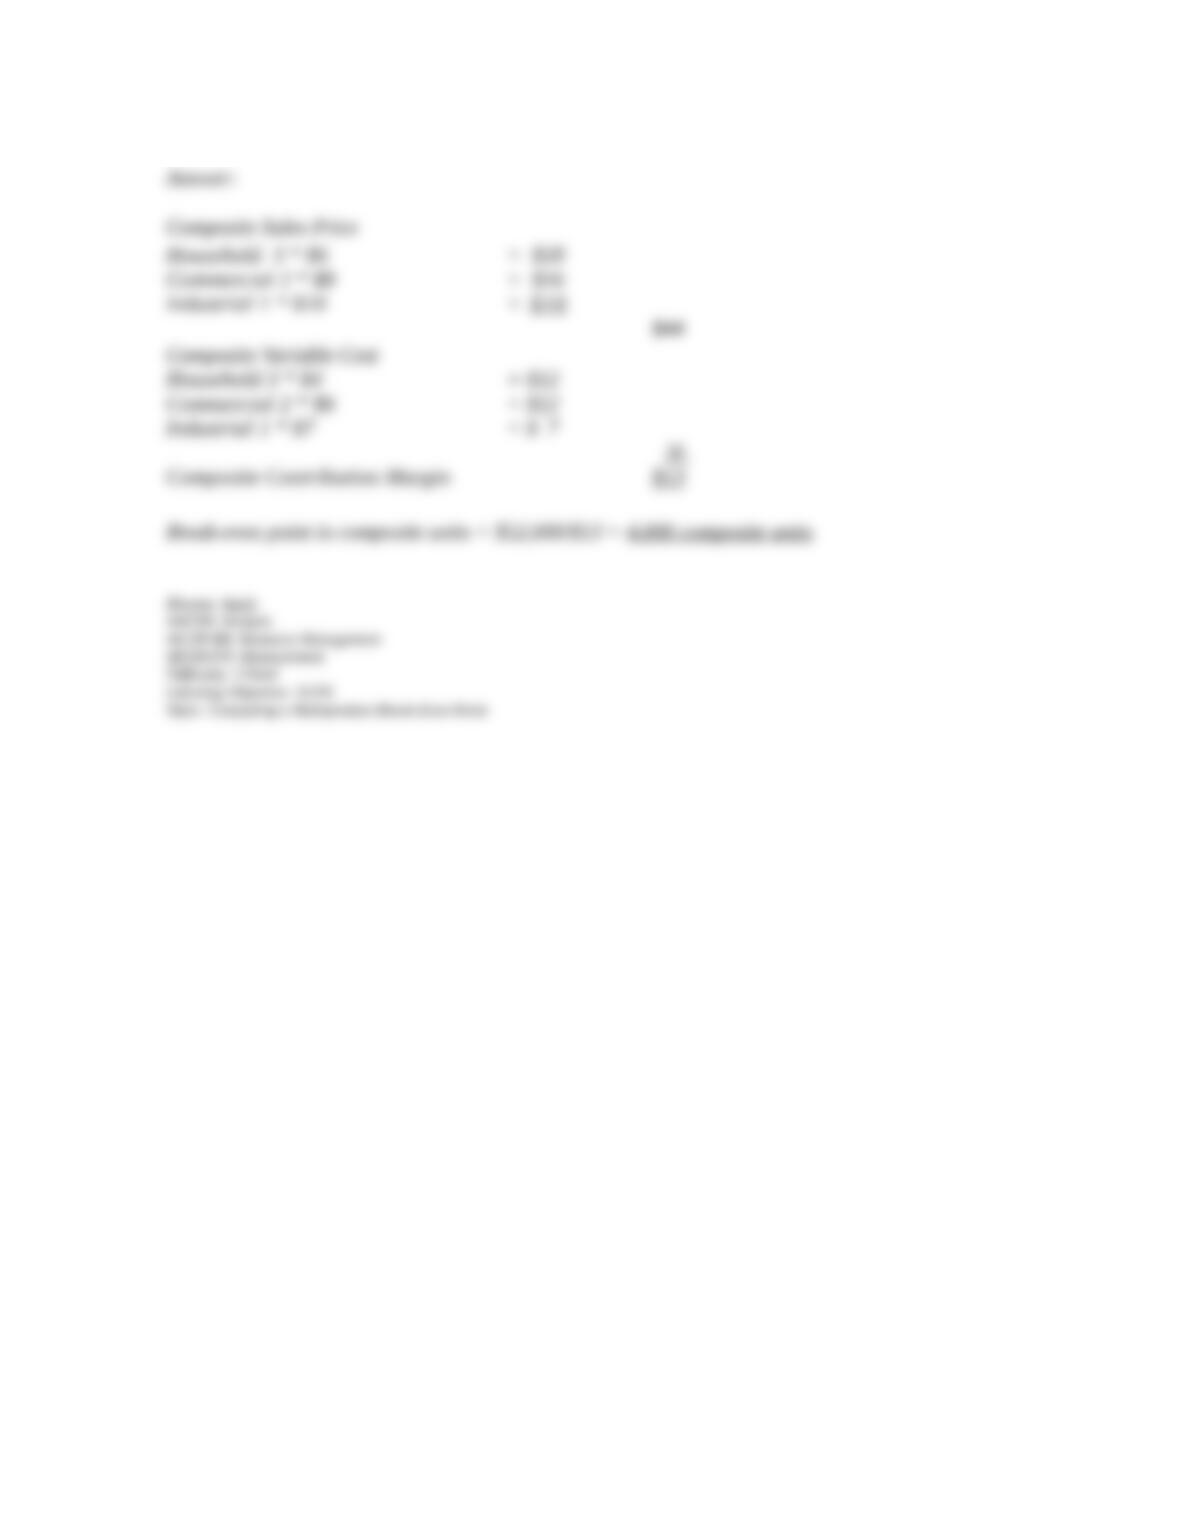
198. Varigon Co. produces and sells three products—Household, Commercial, and Industrial,
and has total fixed costs of $52,000. Sales and cost data follow:
Household Commercial Industrial
Sales price per unit……….. $6 $8 $10
Variable costs per unit…… 4 6 7
Sales mix……………..….. 3 2 1
Calculate the break-even point in composite units.
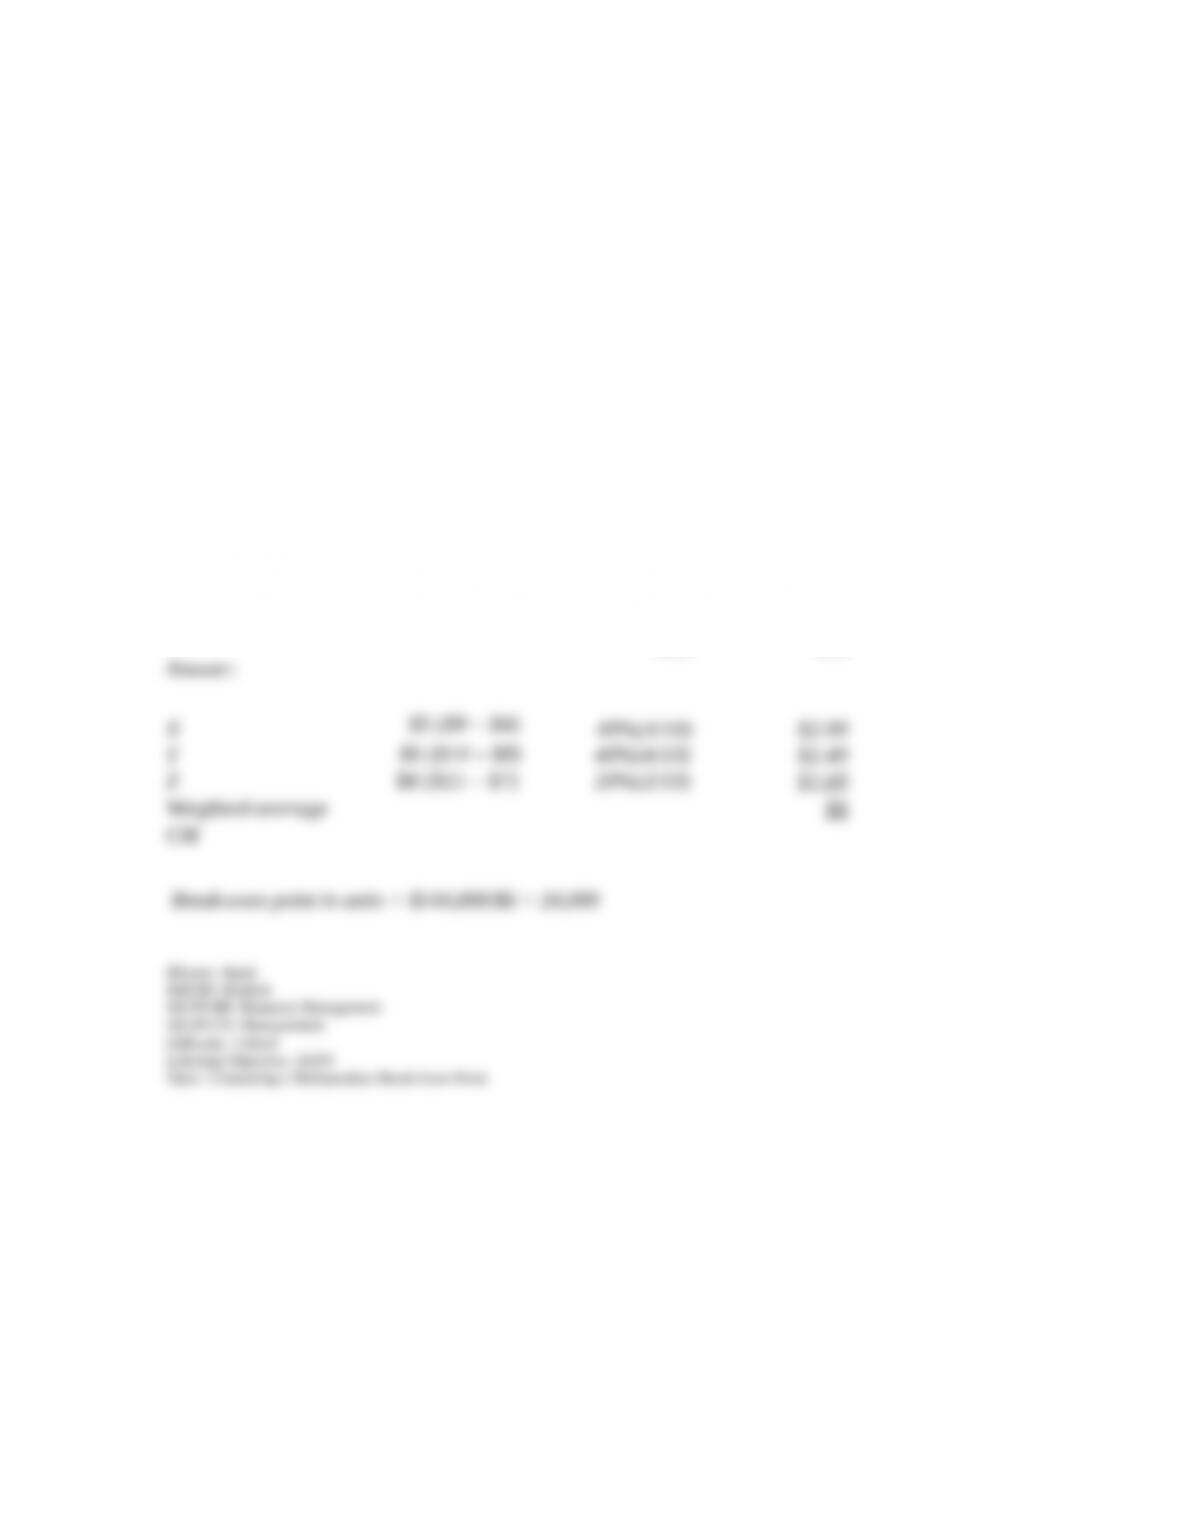
199. Whiting Company sells a mix of three related products. Total fixed costs are $144,000.
The following additional information is available for Whiting Company.
Sales Mix Variable Sales
Cost/Unit Price/Unit
X 4 $4 $9
Y 4 $8 $14
Z 2 $7 $15
Use the weighted average method to determine the company’s break-even point for composite
units.
Cont Margin
per Unit
Percentage
of Sales
Mix
Weighted
Average
CM
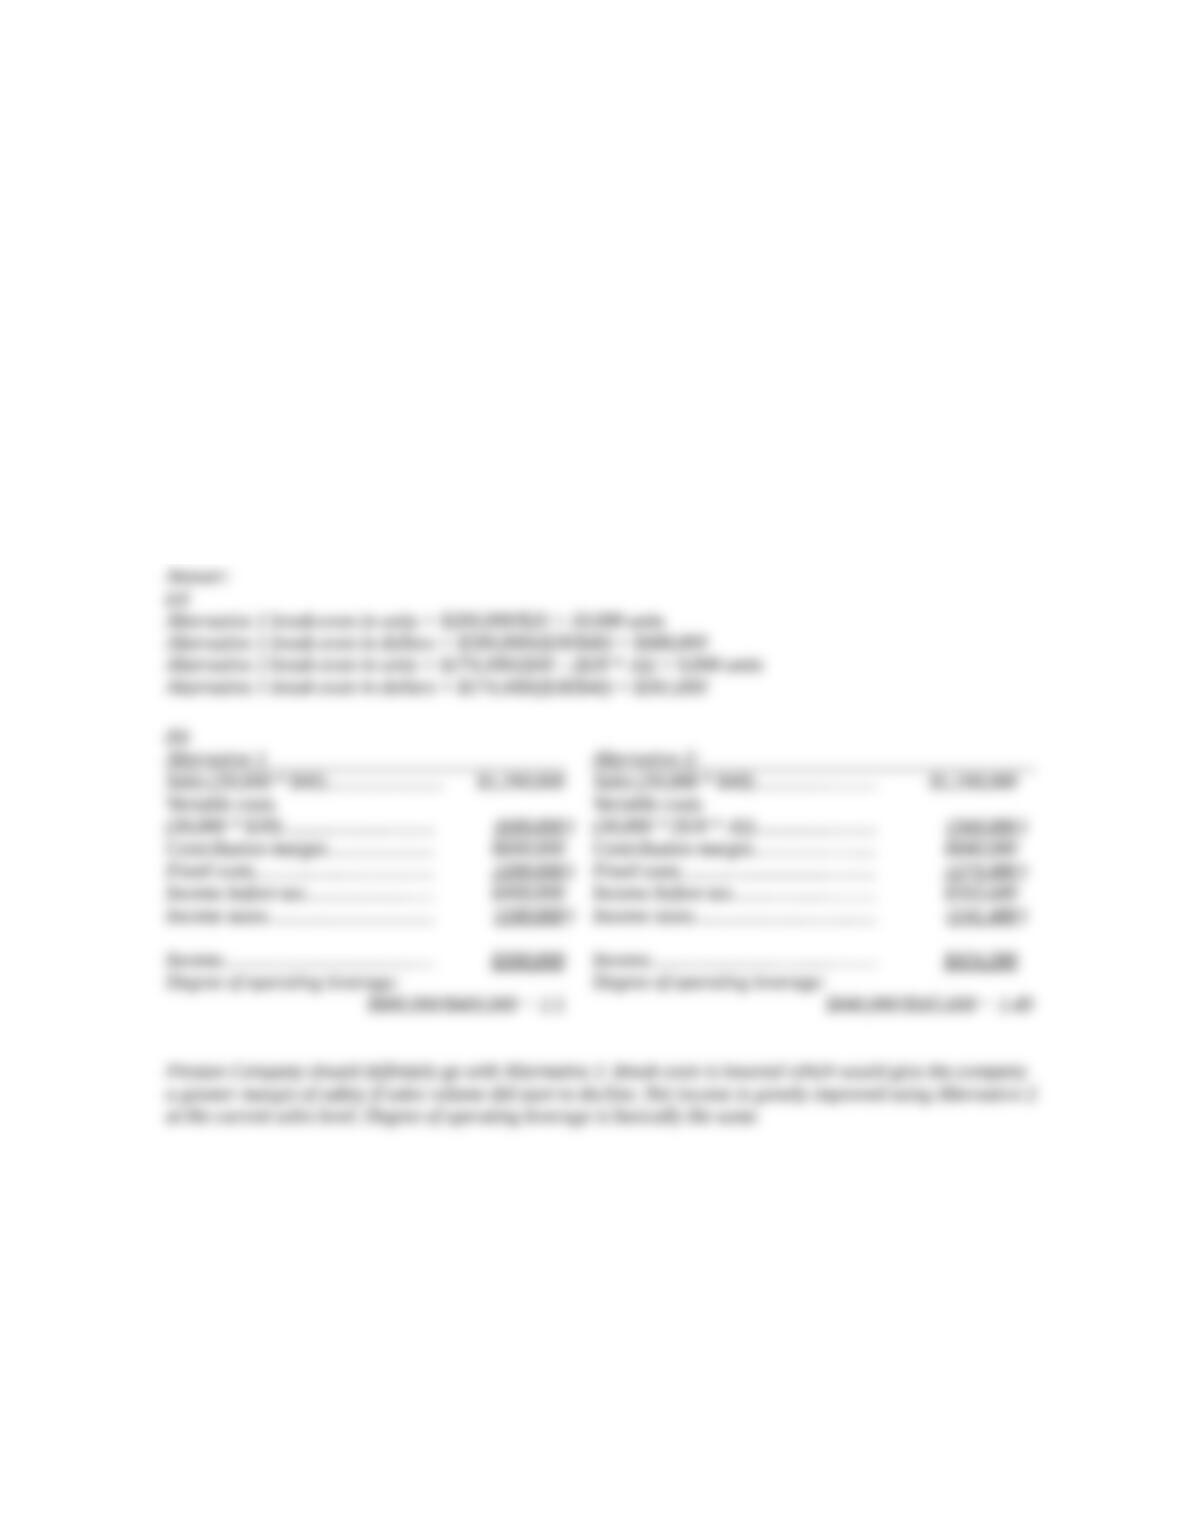
200. Preston Company is analyzing two alternative methods of producing its product. The
production manager indicates that variable costs can be reduced 40% by installing a machine
that automates production, but fixed costs would increase. Alternative 1 shows costs before
installing the machine; Alternative 2 shows costs after the machine is installed. (a) Compute
the break-even point in units and dollars for both alternatives. (b) Prepare a forecasted income
statement for both alternatives assuming that 30,000 units will be sold. The statements should
report sales, total variable costs, contribution margin, fixed costs, income before taxes,
income taxes, and net income. Below the income statement, compute the degree of operating
leverage. Which alternative would you recommend and why?
Alternative 1 Alternative 2
Variable costs per unit......... $20 ?
Fixed costs…………..….……… $200,000 $274,400
Selling price per unit........... $40 $40
Income tax rate……………..... 25% 25%
201. Magnolia Company is considering the production and sale of a new product with the
following sales and cost data: unit sales price, $350; unit variable costs, $180; total fixed
costs, $399,500; and projected sales, $910,000. Round your answers to the nearest whole unit
or dollar.
(a) Calculate break-even in units.
(b) Calculate break-even in dollars (use four decimal places when calculating the contribution
margin ratio).
(c) Calculate number of units that would need to be sold to generate an after-tax profit of
$420,000 assuming a 30% tax rate.
(d) Calculate dollar sales that would be needed to generate the same profit as above.
(e) Calculate the margin of safety stated as a percentage using the $910,000 projected sales
level.
Be sure to label each calculation and show all calculations.
202. Dubashi Windows manufactures two standard size windows, J and R, in the ratio of 5:3.
J has a selling price of $150 and R has a selling price of $200. The variable cost of J is $75.00
and the variable cost of R is $90.00. Fixed costs are $352,500. Compute the (a) weighted
average contribution margin, (b) break-even point in units, (c) number of units of each
product that will be sold at the break-even point.
203. Bing Company’s contribution margin income statement is presented below. Sales for the
current period consisted of 7,500 units. Compute the company’s break-even point in (a) units,
and (b) dollars. Compute the margin of safety in (c) dollars and (d) percent.
Bing Company
Contribution Margin Income Statement
Sales $225,000
Variable costs 135,000
Contribution margin 90,000
Fixed costs 48,000
Net income $42,000
204. A _______________ cost is one that remains unchanged despite variations in the volume
of activity within a relevant range. A ______________ cost is one that changes in proportion
to changes in volume of activity.
205. A __________ cost is one that includes both fixed and variable cost components; a
______________ cost is one that reflects a step pattern.
206. Three important assumptions in cost-volume-profit analysis is that (1) _______________
per unit is constant, (2) _____________ per unit is constant, and (3) ______________ are
constant in total.
207. Solving problems to determine the relationship of cost, volume, and profit often
commences with the measurement of the ________ point. Further analysis emphasizing
profitability may be accomplished by measuring the __________ and _________________.
208. There are at least three different methods to separate costs into fixed and variable. These
methods are the _______________, _______________, and _______________ methods.
209. The unit contribution margin divided by the selling price per unit is the _____________.
210. The difference between the unit sales price and the unit variable cost of an item is
defined as the _________________________.
211. Examining strategies that impact several estimates in the CVP analysis is known as
_______________________.
212. One aid in measuring cost behavior involves creating a display of the data about past
costs in graphical form. Such a visual display is called a ______________________.
213. When using the high-low method for estimating cost behavior, the slope, or variable cost
per unit, is calculated by ___________________________________.
214. _____________ is a statistical method of identifying an estimated line of cost behavior.
215. The ______________________ is the sales level at which a company neither earns a
profit nor incurs a loss.
216. A graphic presentation of cost-volume-profit data is known as a __________________
graph (or chart); this presentation is also sometimes called a ______________ chart.
217. The ratio (proportion) of the sales volumes of the various products sold by a company is
called the ______________________________.