Chapter 13
ANALYSIS OF FINANCIAL STATEMENTS
True / False Questions
1. Financial statement analysis is the application of analytical tools to general-purpose
financial statements and related data for making business decisions.
2. Financial statement analysis lessens the need for expert judgment.
3. Financial statement analysis may be used for personal financial investment decisions.
4. The evaluation of company performance and financial condition includes evaluation of (1)
past and current performance, (2) current financial position, and (3) future performance and
risk.
5. External users of accounting information make the strategic and operating decisions of a
company.
6. One purpose of financial statement analysis for internal users is to provide strategic
information to improve company efficiency and effectiveness in providing products and
services.
7. Evaluation of company performance does not include analysis of (1) past and current
performance, (2) current financial position, and (3) future performance and risk.
8. A company’s board of directors analyzes financial statements to assess future company
prospects for making operating decisions.
9. Financial analysis only refers to the communication of relevant financial information to
decision makers.
10. Profitability is the ability to generate future revenues and meet long-term obligations.
11. Liquidity and efficiency are the ability to meet short-term obligations and to efficiently
generate revenue.
12. Market prospects are the ability to provide financial rewards sufficient to attract and retain
financing.
13. Profitability is the ability to generate positive market expectations.
14. Financial reporting includes not only general purpose financial statements, but also
information from SEC filings, press releases, shareholders’ meetings, forecasts, management
letters, auditor’s reports, and Webcasts.
15. The building blocks of financial statement analysis include (1) liquidity, (2) salability, (3)
solvency, and (4) profitability.
16. General-purpose financial statements include the (1) income statement, (2) balance sheet,
(3) statement of stockholders’ equity (or statement of retained earnings), (4) statement of cash
flows, and (5) notes to these statements.
17. Standards for comparison are not generally necessary when making judgments about a
company’s performance.
18. Standards for comparison when interpreting financial statement analysis include
competitor and industry performance data.
19. Measures taken from a selected competitor or a group of competitors are often excellent
standards of comparison for analysis.
20. Intra-company analysis is based on comparisons with competitors.
21. General standards of comparisons, developed from experience, include the 2:1 level for
the current ratio and 1:1 level for the acid-test ratio.
22. Vertical analysis is the comparison of a company’s financial condition and performance
across time.
23. If a company is comparing its financial condition or performance to a base amount, it is
using vertical analysis.
24. Horizontal analysis is the comparison of a company’s financial condition and performance
to a base amount.
25. If a company is comparing this year’s financial performance to last year’s financial
performance, it is using horizontal analysis.
26. Three of the most common tools of financial analysis include horizontal analysis, vertical
analysis, and ratio analysis.
27. A financial statement analysis report helps to reduce uncertainty in business decisions
through a rigorous and sound evaluation.
28. A good financial report does not link interpretations and conclusions of analysis with the
underlying information.
29. A good financial statement analysis report often includes the following sections: executive
summary, analysis overview, evidential matter, assumptions, key factors, and inferences.
30. Earnings per share are calculated only on income from continuing operations.
31. Analysis of a single financial number is often of limited value.
32. Comparative financial statements are reports that show financial amounts in side by side
columns on a single statement for analysis purposes.
33. Vertical analysis is used to reveal patterns in data covering two or more successive
periods.
34. Trend analysis is a form of horizontal analysis that can reveal patterns in data across
successive periods.
35. Trend analysis of financial statement items can include comparisons of relations between
items on different financial statements.
36. Horizontal analysis is used to reveal patterns in data covering successive periods.
37. A trend percent, or index number, is calculated by dividing the analysis period amount by
the base period amount and multiplying the result by 100.
38. The percent change of a comparative financial statement item is computed by subtracting
the analysis period amount from the base period amount, dividing the result by the base
period amount and multiplying that result by 100.
39. Vertical analysis is a tool to evaluate individual financial statement items or groups of
items in terms of a specific base amount.
40. Horizontal analysis is used to reveal changes in the relative importance of each financial
statement item.
41. The base amount for a common-size balance sheet is usually total assets.
42. An advantage of common-size statements is that they reflect the dollar magnitude (size) of
the different companies under analysis.
43. Graphical analysis of the balance sheet can be useful in assessing sources of financing.
44. A corporation reported cash of $14,000 and total assets of $178,300. Its common-size
percent for cash equals 7.85%.
45. A ratio expresses a mathematical relation between two quantities and can be expressed as
a percent, rate, or proportion.
46. Ratios must refer to economically important relationships, such as a sale price compared
to its cost.
47. Liquidity refers to the availability of resources to meet short-term cash requirements.
48. Working capital is computed as current liabilities minus current assets.
49. The current ratio is calculated as current liabilities divided by current assets.
50. Total asset turnover reflects a company’s ability to use its assets to generate sales and is an
important indication of operating efficiency.
51. Capital structure refers to a company’s long-run financial viability and its ability to cover
long-term obligations.
52. The use of debt is sometimes described as financial leverage because debt can have the
effect of increasing the return on equity.
53. The greater the times interest earned ratio, the greater the risk a company is exposed to.
54. Efficiency refers to how productive a company is in using its assets, and is usually
measured relative to how much revenue is generated from a certain level of assets.
55. The higher the accounts receivable turnover, the less quickly accounts receivable are
collected.
56. A company with a high inventory turnover requires a smaller investment in inventory than
one producing the same sales with a lower turnover.
57. A rough guideline states that for a company with no discounts offered, days’ sales
uncollected should not exceed 1 1/3 times the days in its credit period.
58. A company that has days’ sales uncollected of 30 days and days’ sales in inventory of 18
days implies that inventory will be converted to cash in about 12 days.
59. The return on total assets can be calculated as profit margin times total asset turnover.
60. The return on common stockholder’s equity measures a company’s success in earning net
income for its owners.
61. A high level of expected risk suggests a low price-earnings (PE) ratio.
62. The return on total assets ratio is a profitability measure.
63. A company reports basic earnings per share of $3.50, cash dividends per share of $0.75,
and a market price per share of $64.75. The company’s dividend yield equals 21.4%.
64. Financial statement analysis involves all of the following except:
A. The application of analytical tools to general-purpose financial statements and related data
for making business decisions.
B. Transforming accounting data into useful information for decision-making.
C. Helping users to make better decisions.
D. Helping to reduce uncertainty in decision-making.
E. Assuring that the company will be more profitable in the future.
65. Evaluation of company performance can include comparison and/or assessment of all but
which of the following:
A. Past performance.
B. Current performance.
C. Current financial position.
D. Future performance and risk.
E. External user needs and demands.
66. External users of financial information:
A. Are those individuals involved in managing and operating the company.
B. Include internal auditors and consultants.
C. Are not directly involved in operating the company.
D. Make strategic decisions for a company.
E. Make operating decisions for a company.
67. Internal users of financial information:
A. Are not directly involved in operating a company.
B. Are those individuals involved in managing and operating the company.
C. Include shareholders and lenders.
D. Include directors and customers.
E. Include suppliers, regulators, and the press.
68. The building blocks of financial statement analysis do not include:
A. External analyst services.
B. Solvency.
C. Profitability.
D. Market prospects.
E. Liquidity and efficiency.
69. Financial reporting refers to:
A. The application of analytical tools to general-purpose financial statements.
B. The communication of financial information useful for decision making.
C. General-purpose financial statements only.
D. Ratio analysis only.
E. Profitability.
70. The ability to meet short-term obligations and to efficiently generate revenues is called:
A. Liquidity and efficiency.
B. Solvency.
C. Profitability.
D. Market prospects.
E. Creditworthiness.
71. The ability to generate future revenues and meet long-term obligations is referred to as:
A. Liquidity and efficiency.
B. Solvency.
C. Profitability.
D. Market prospects.
E. Creditworthiness.
72. The ability to provide financial rewards sufficient to attract and retain financing is called:
A. Liquidity and efficiency.
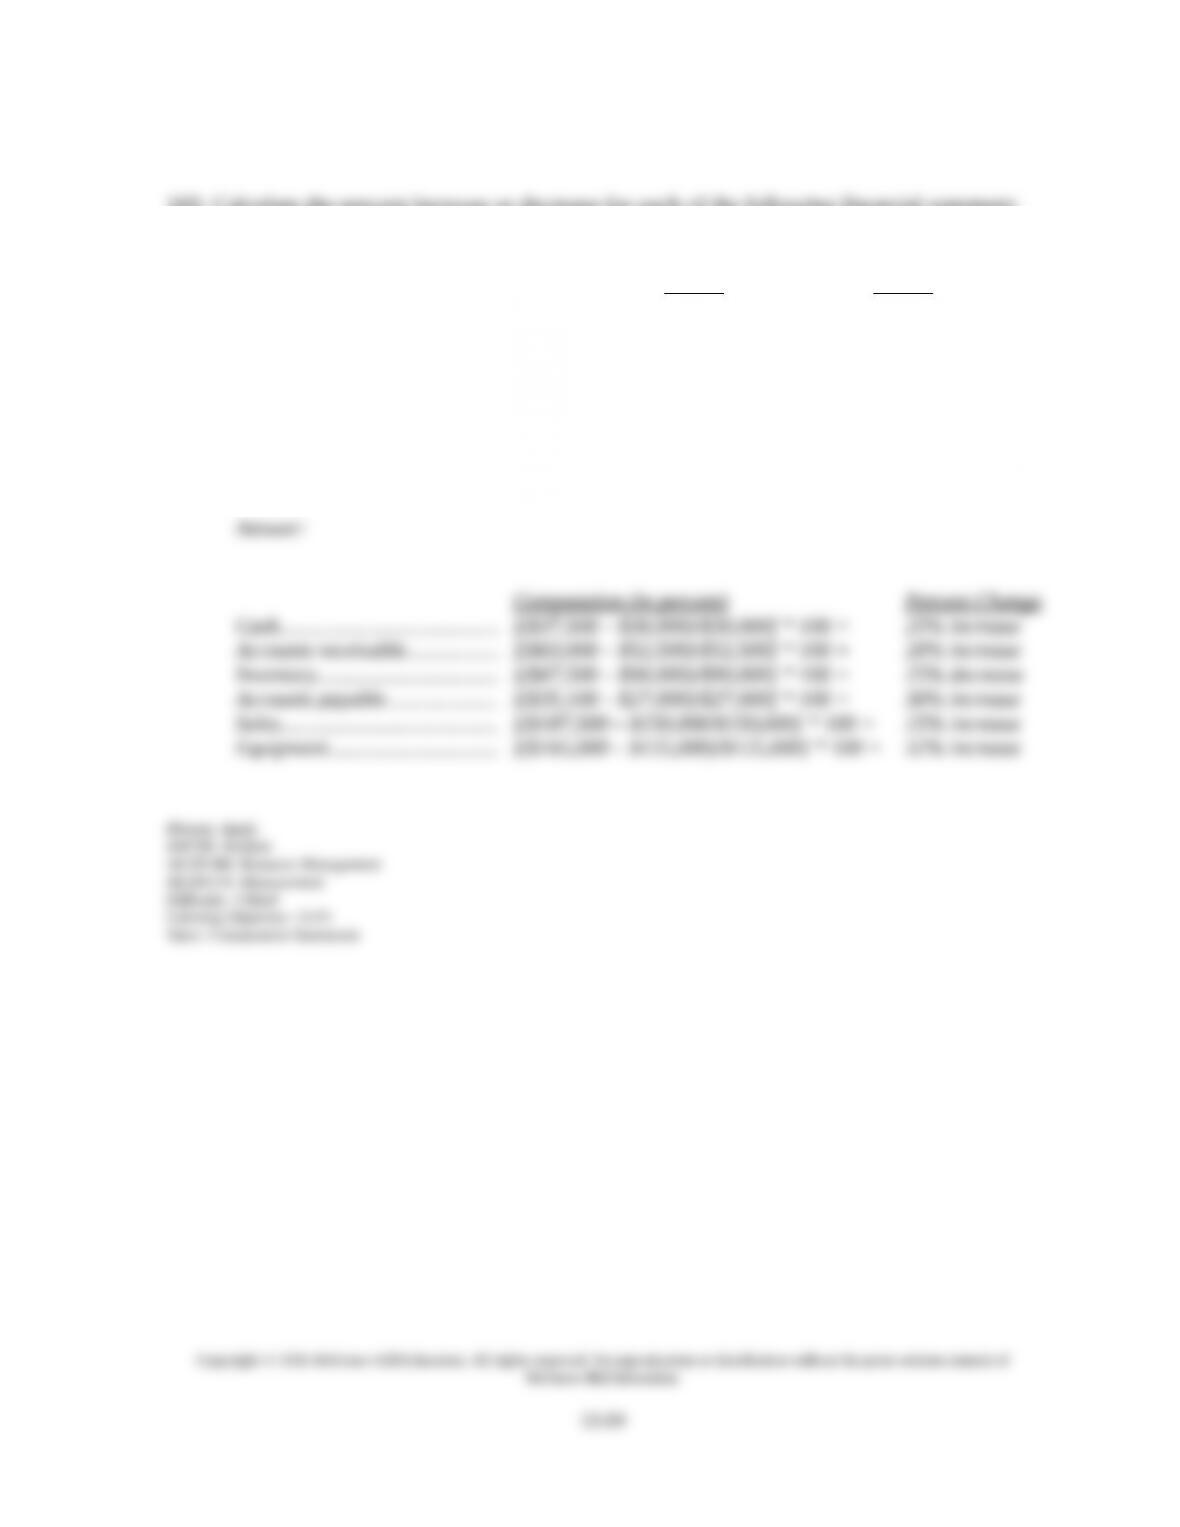
B. Solvency.
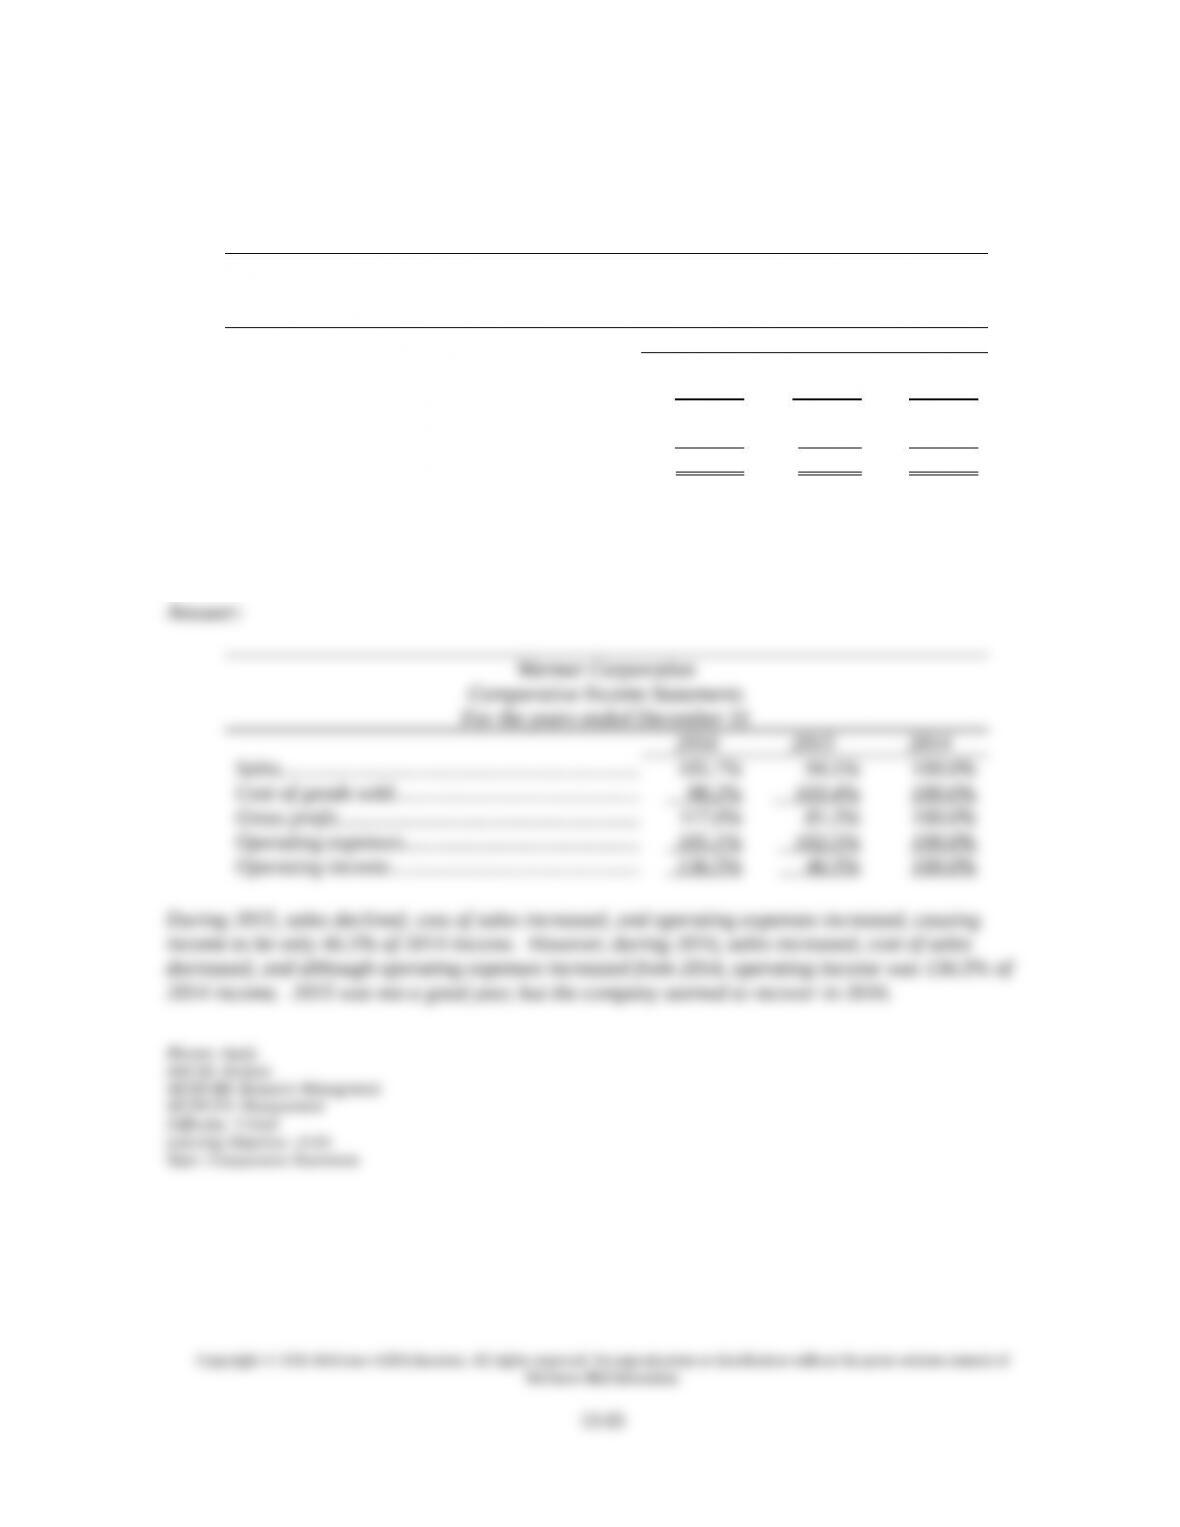
C. Profitability.
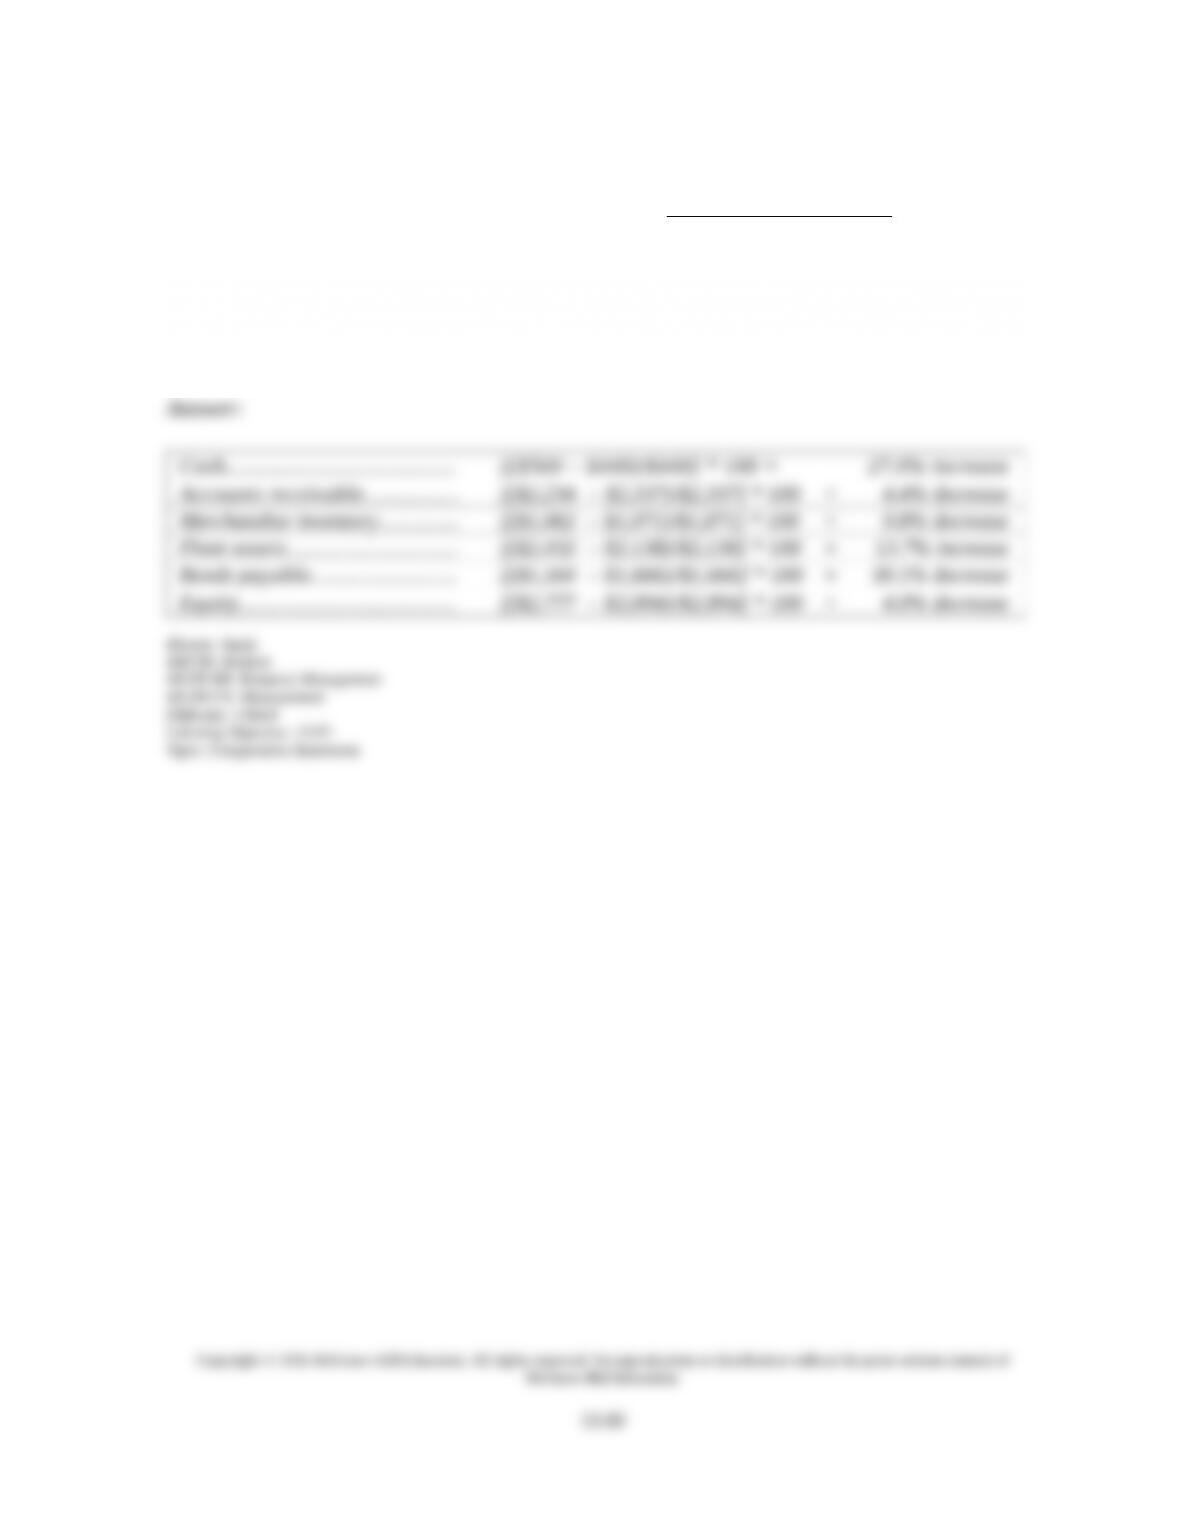
D. Market prospects.
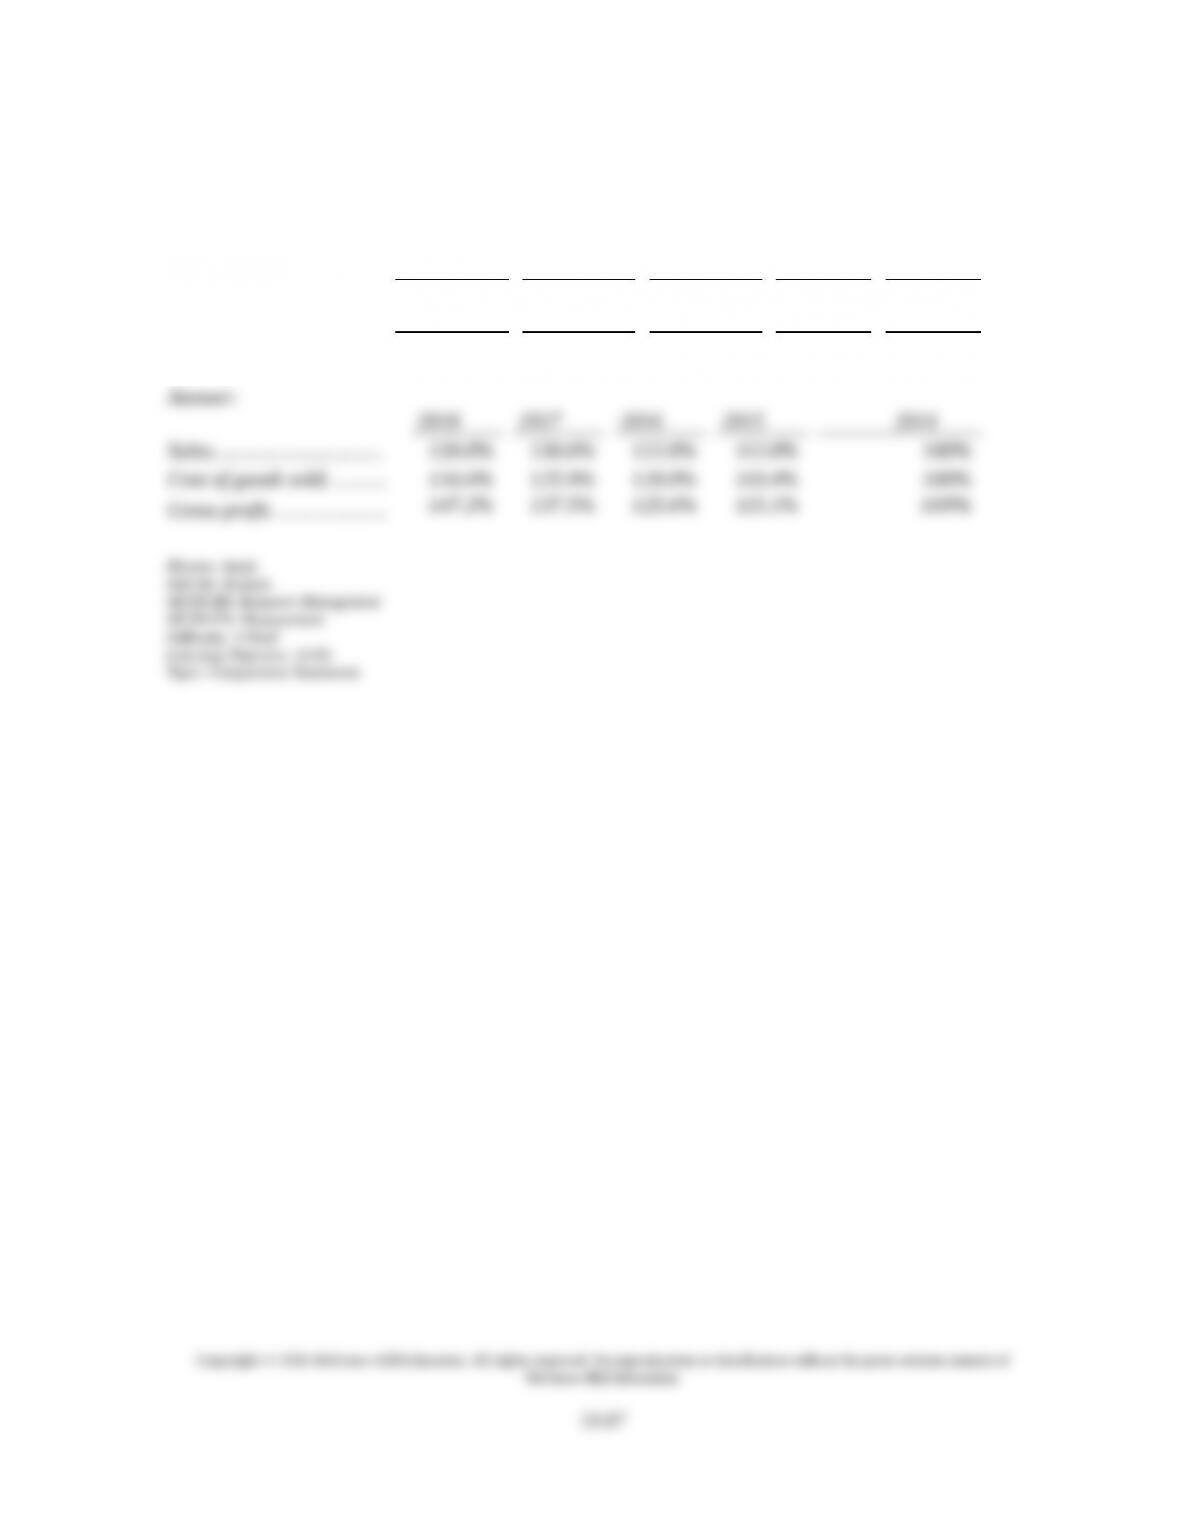
E. Creditworthiness.
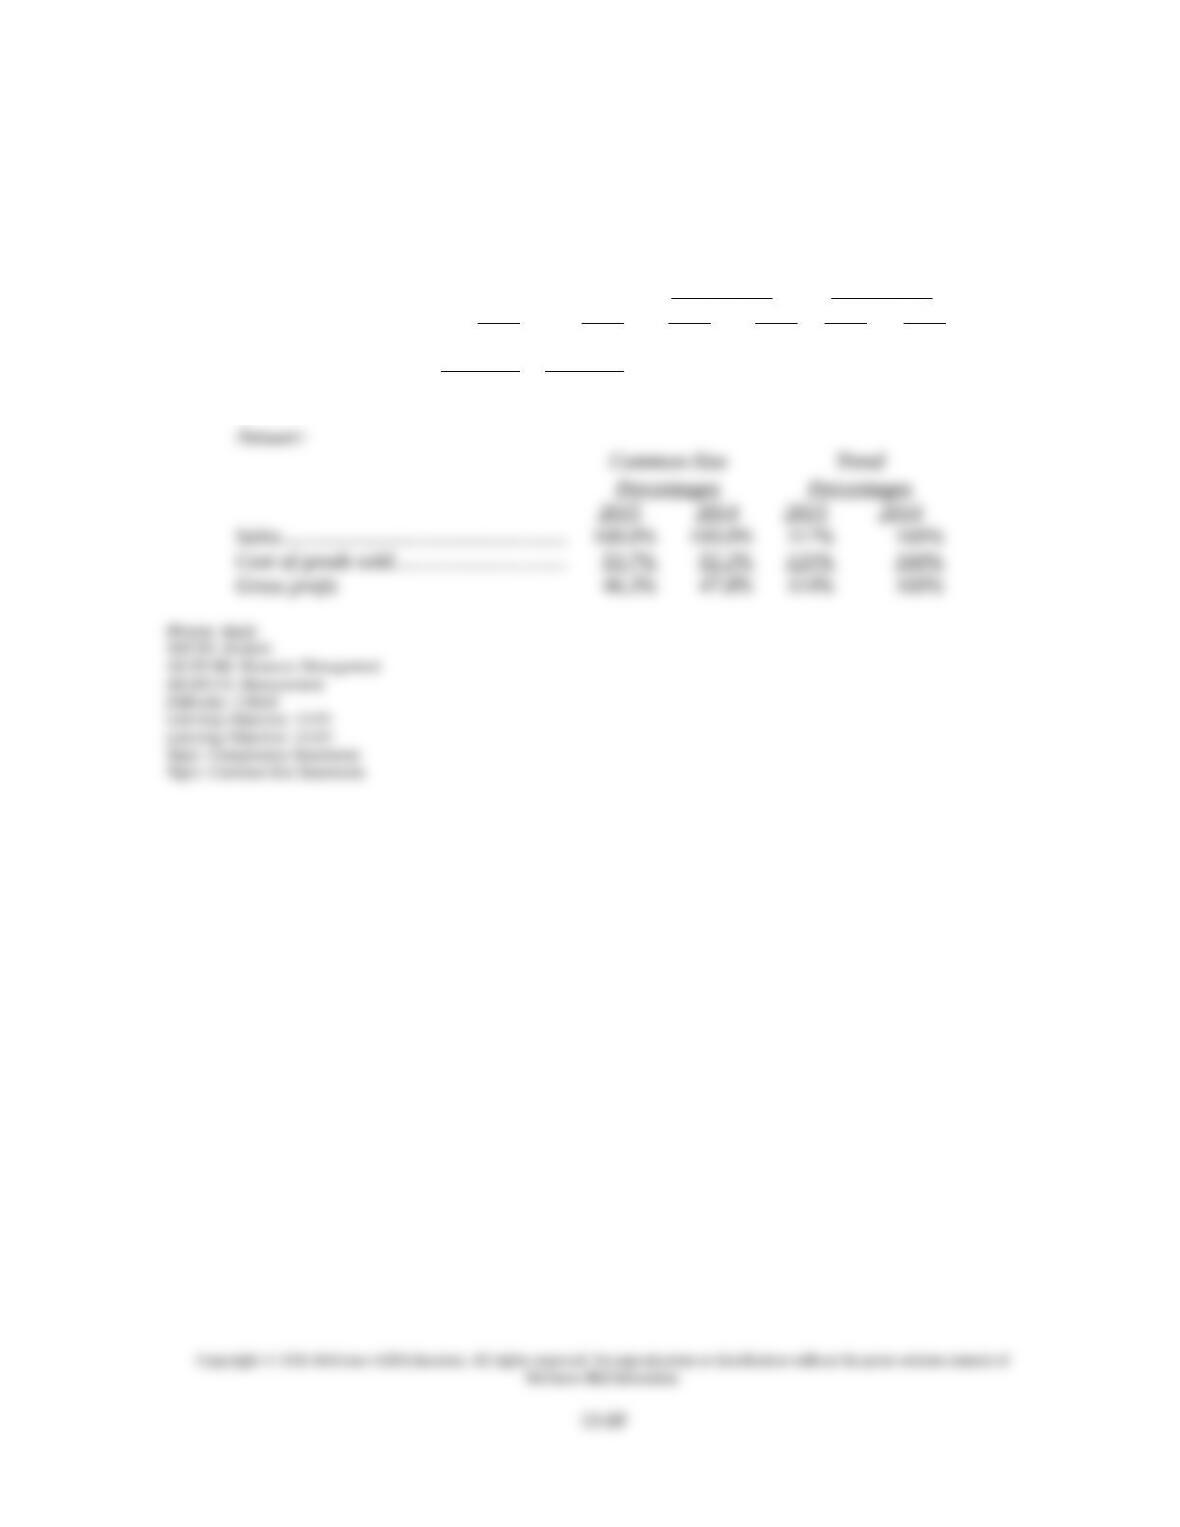
73. The ability to generate positive market expectations is called:
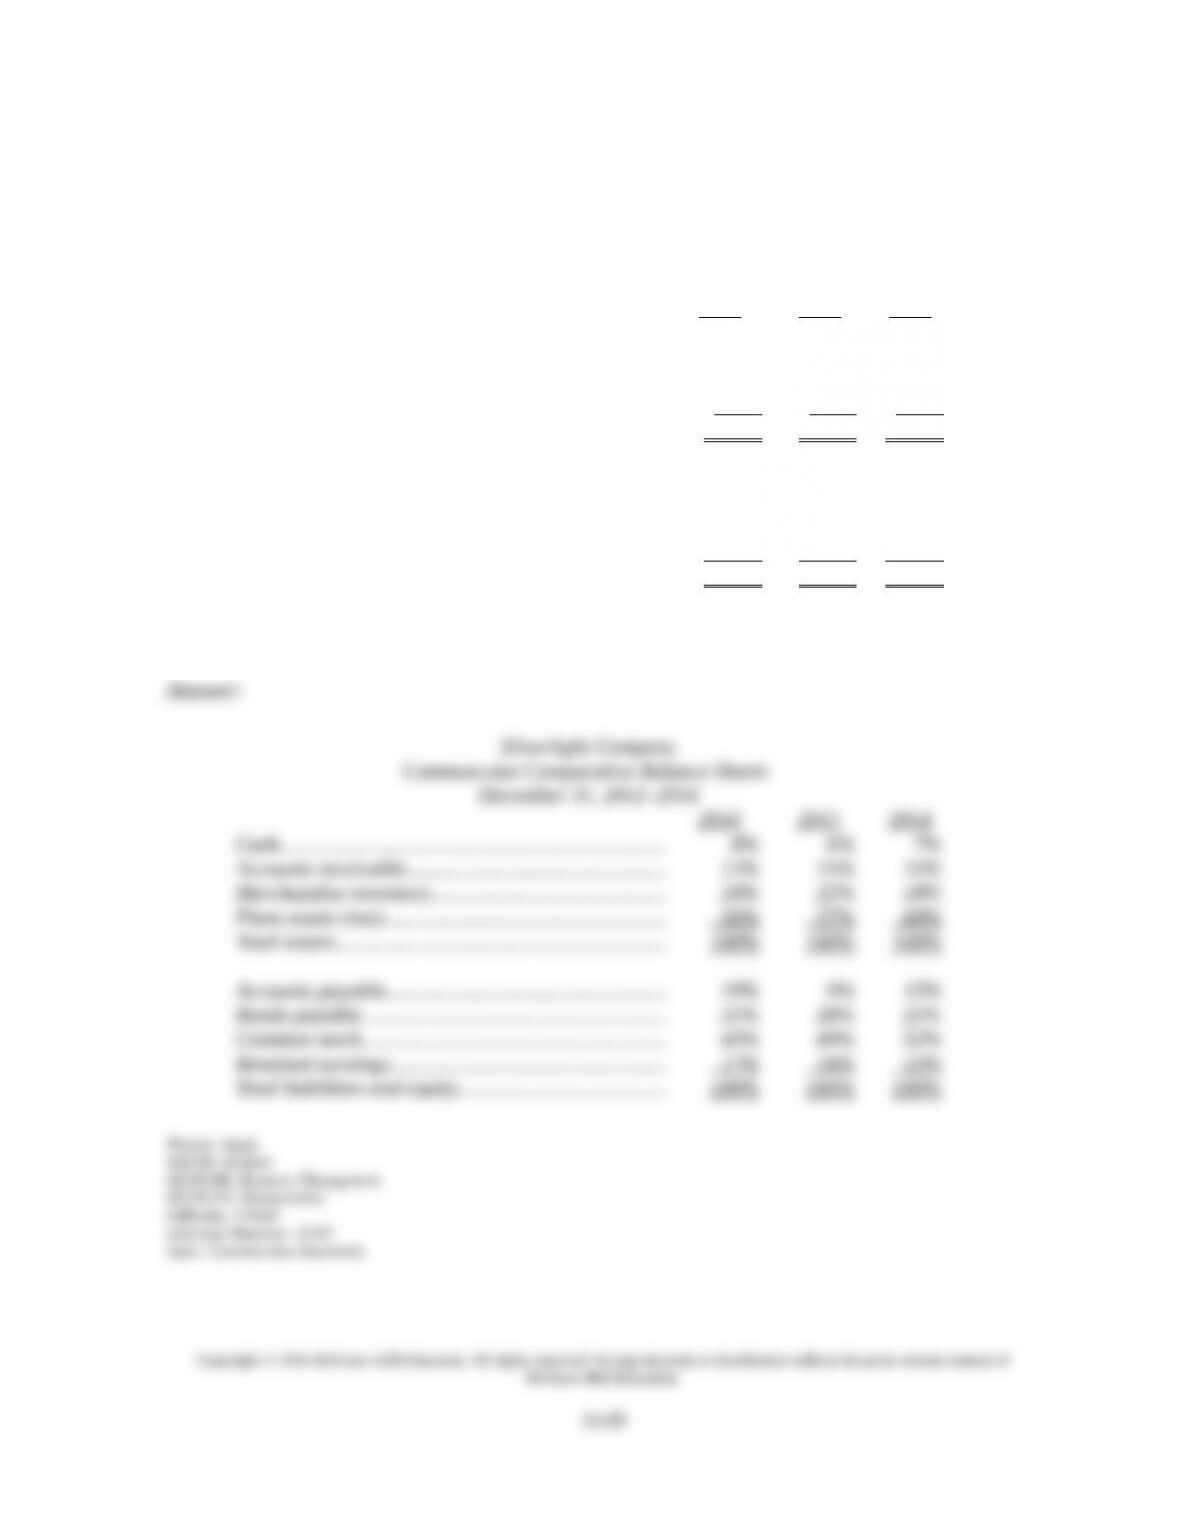
A. Liquidity and efficiency.
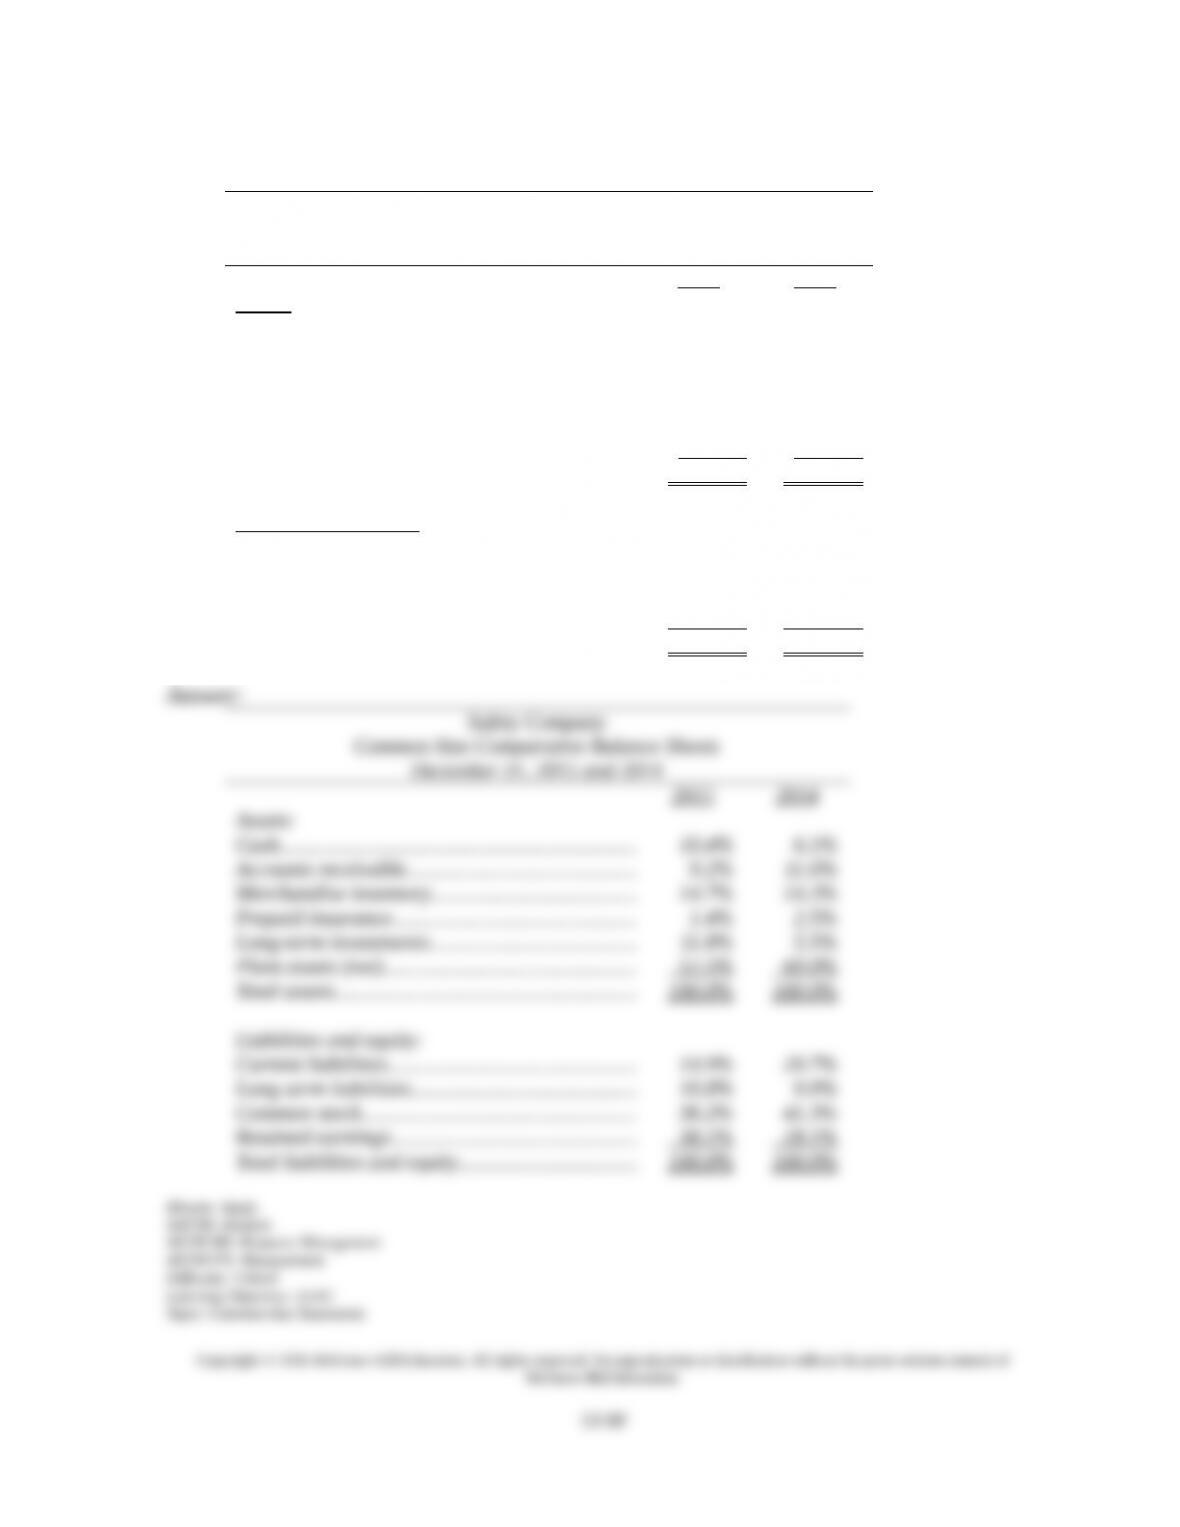
B. Liquidity and solvency.
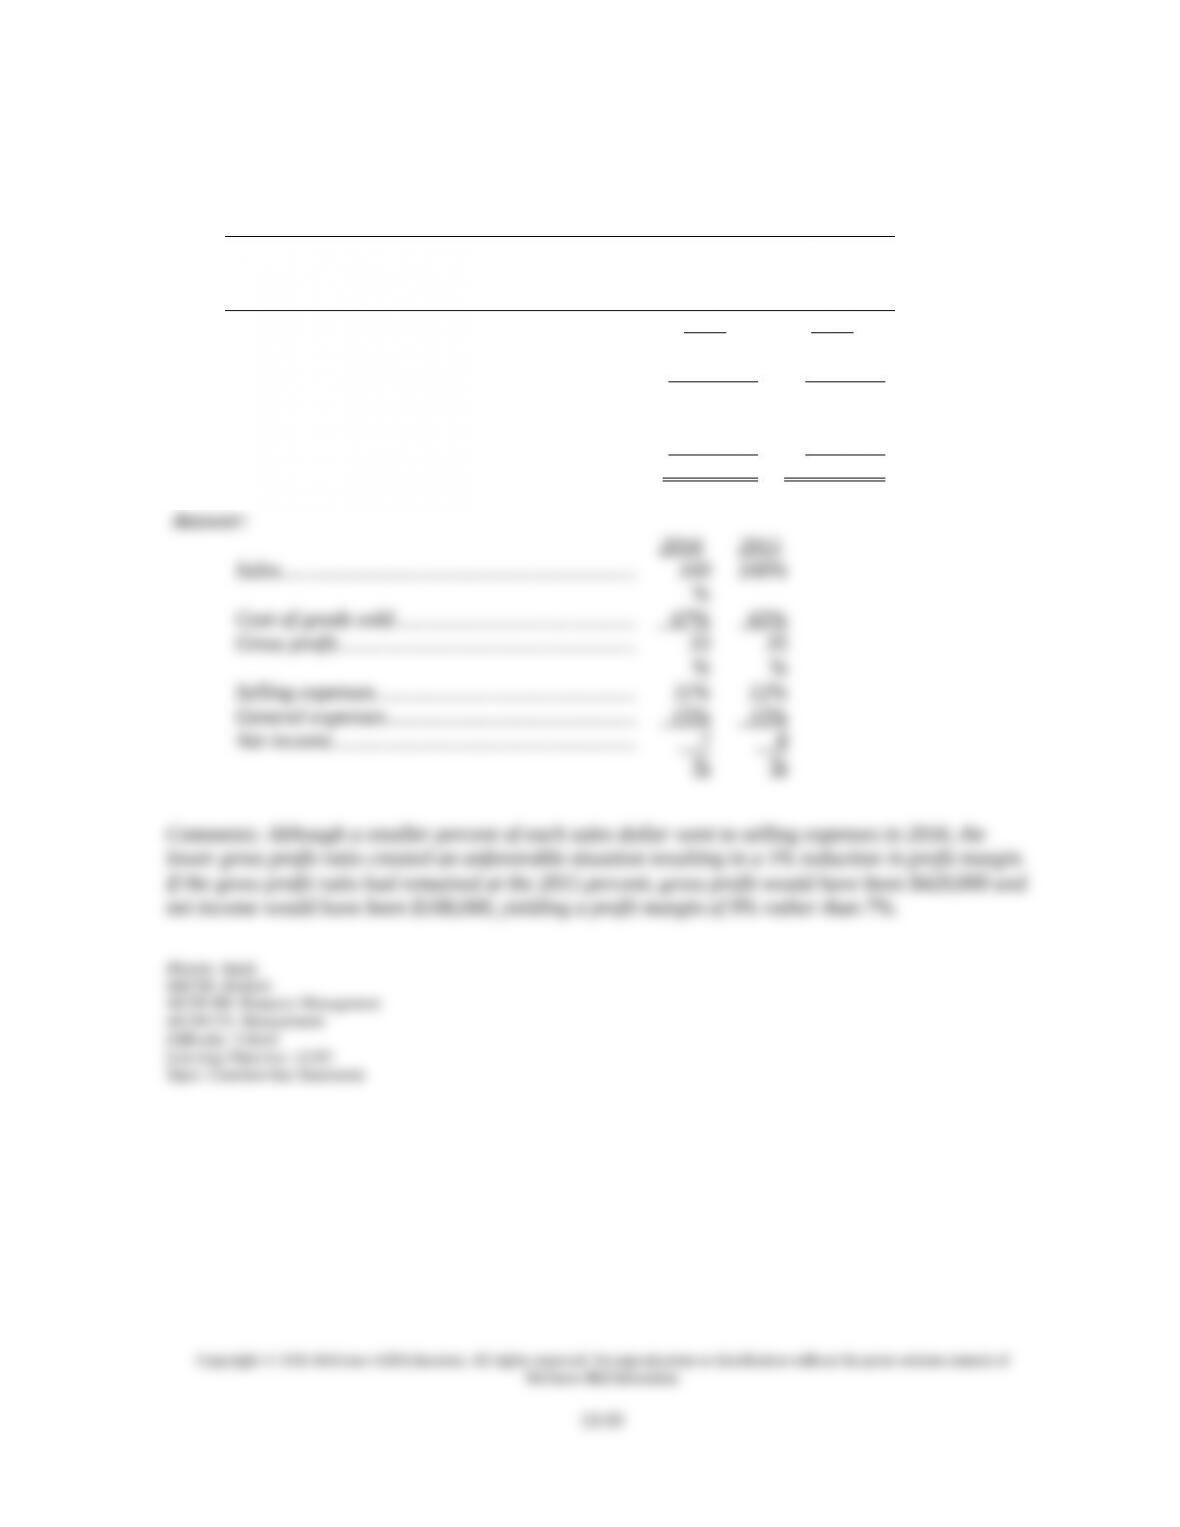
C. Profitability.
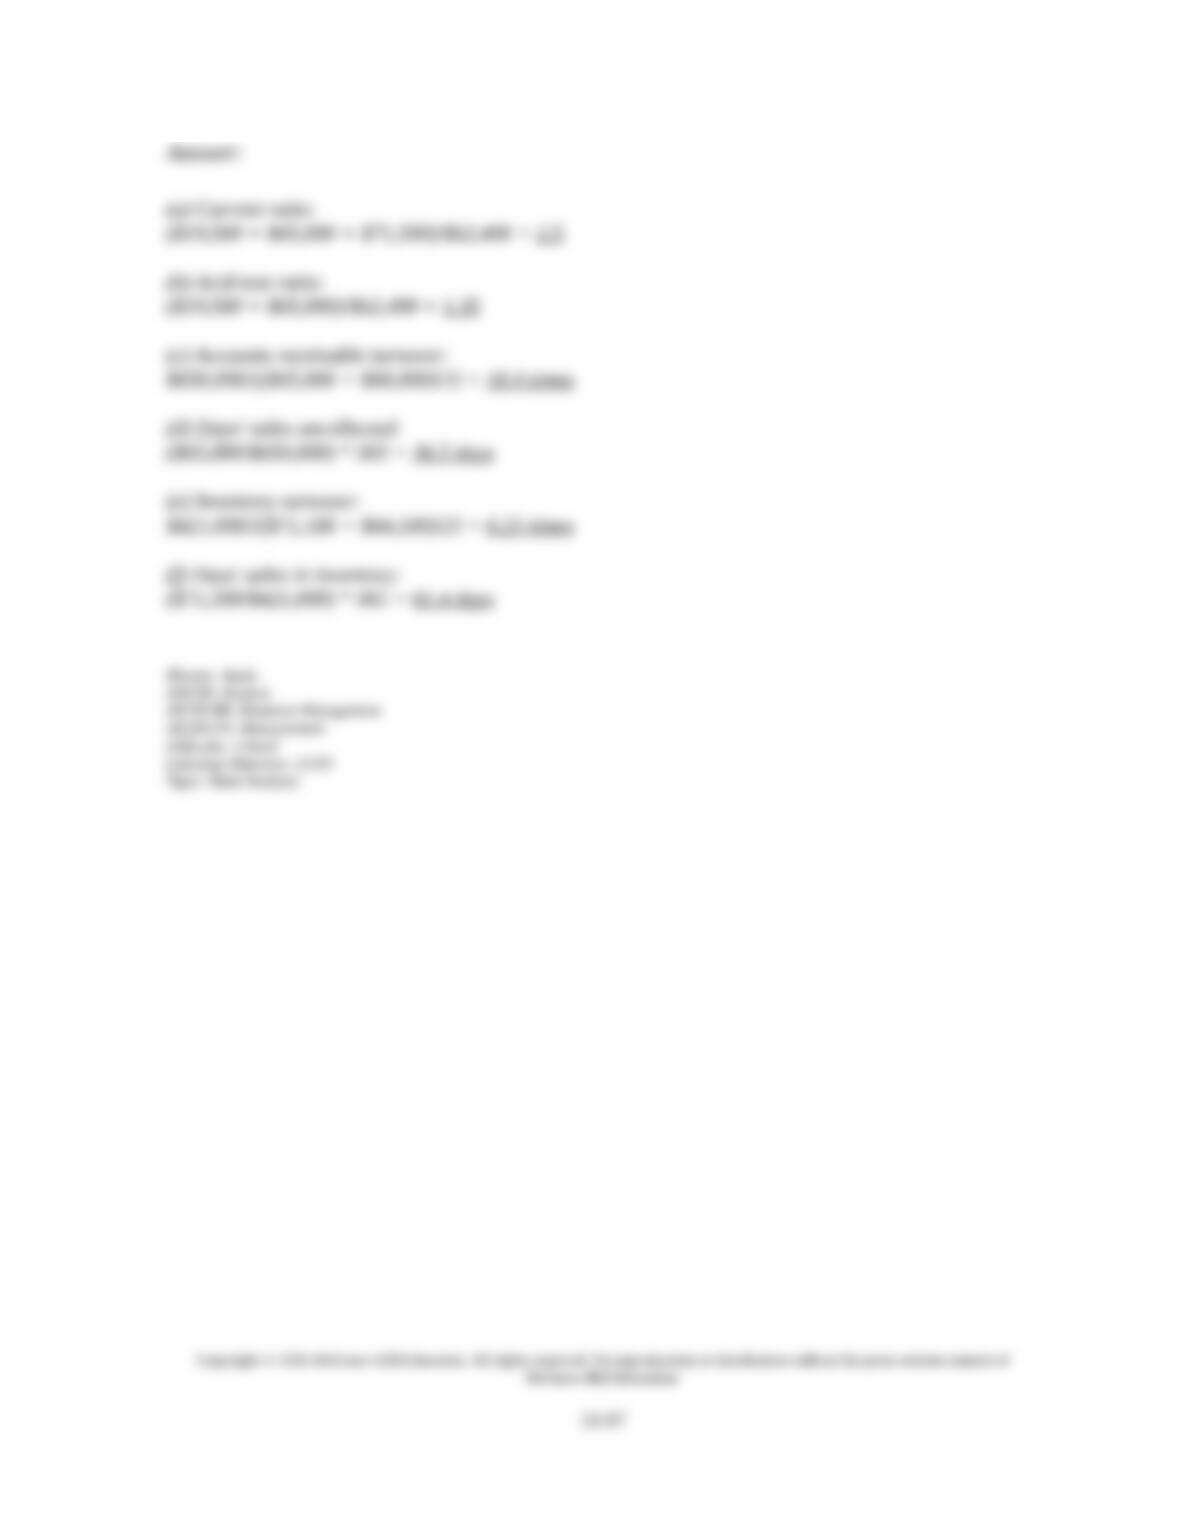
D. Market prospects.
E. Creditworthiness.
74. Standards for comparisons in financial statement analysis do not include:
A. Intra-company standards.
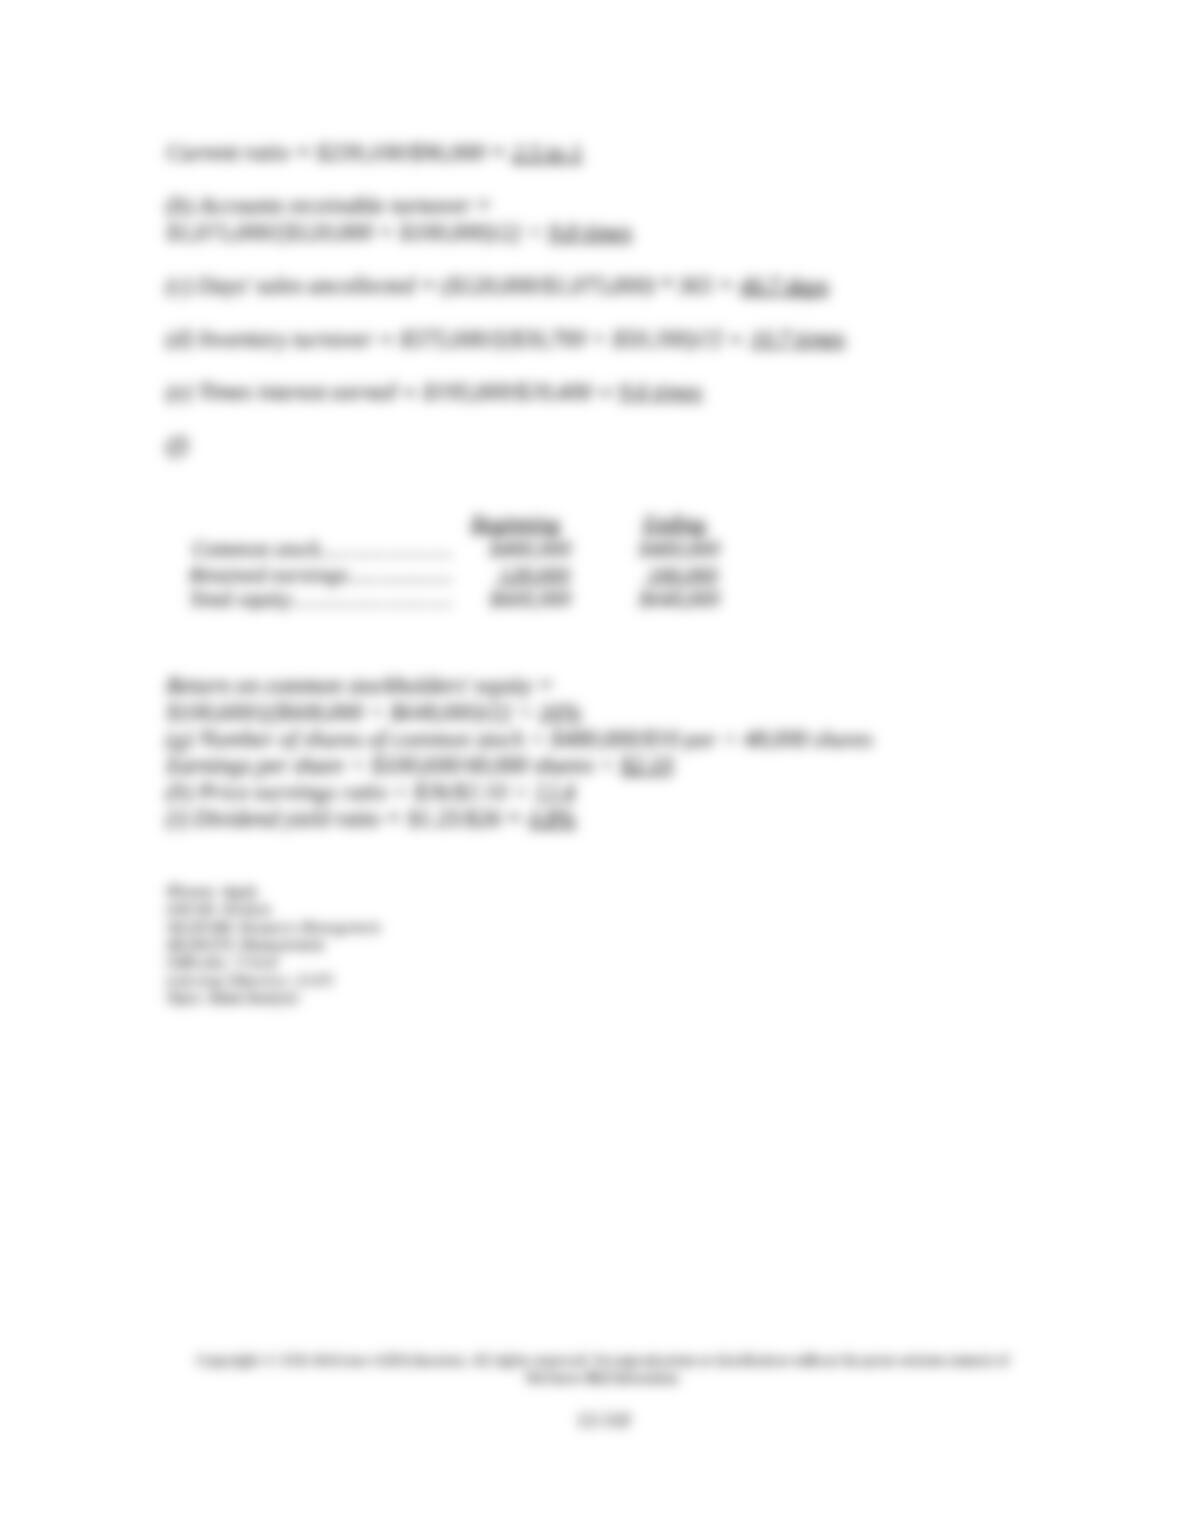
B. Competitors’ standards.
C. Industry standards.
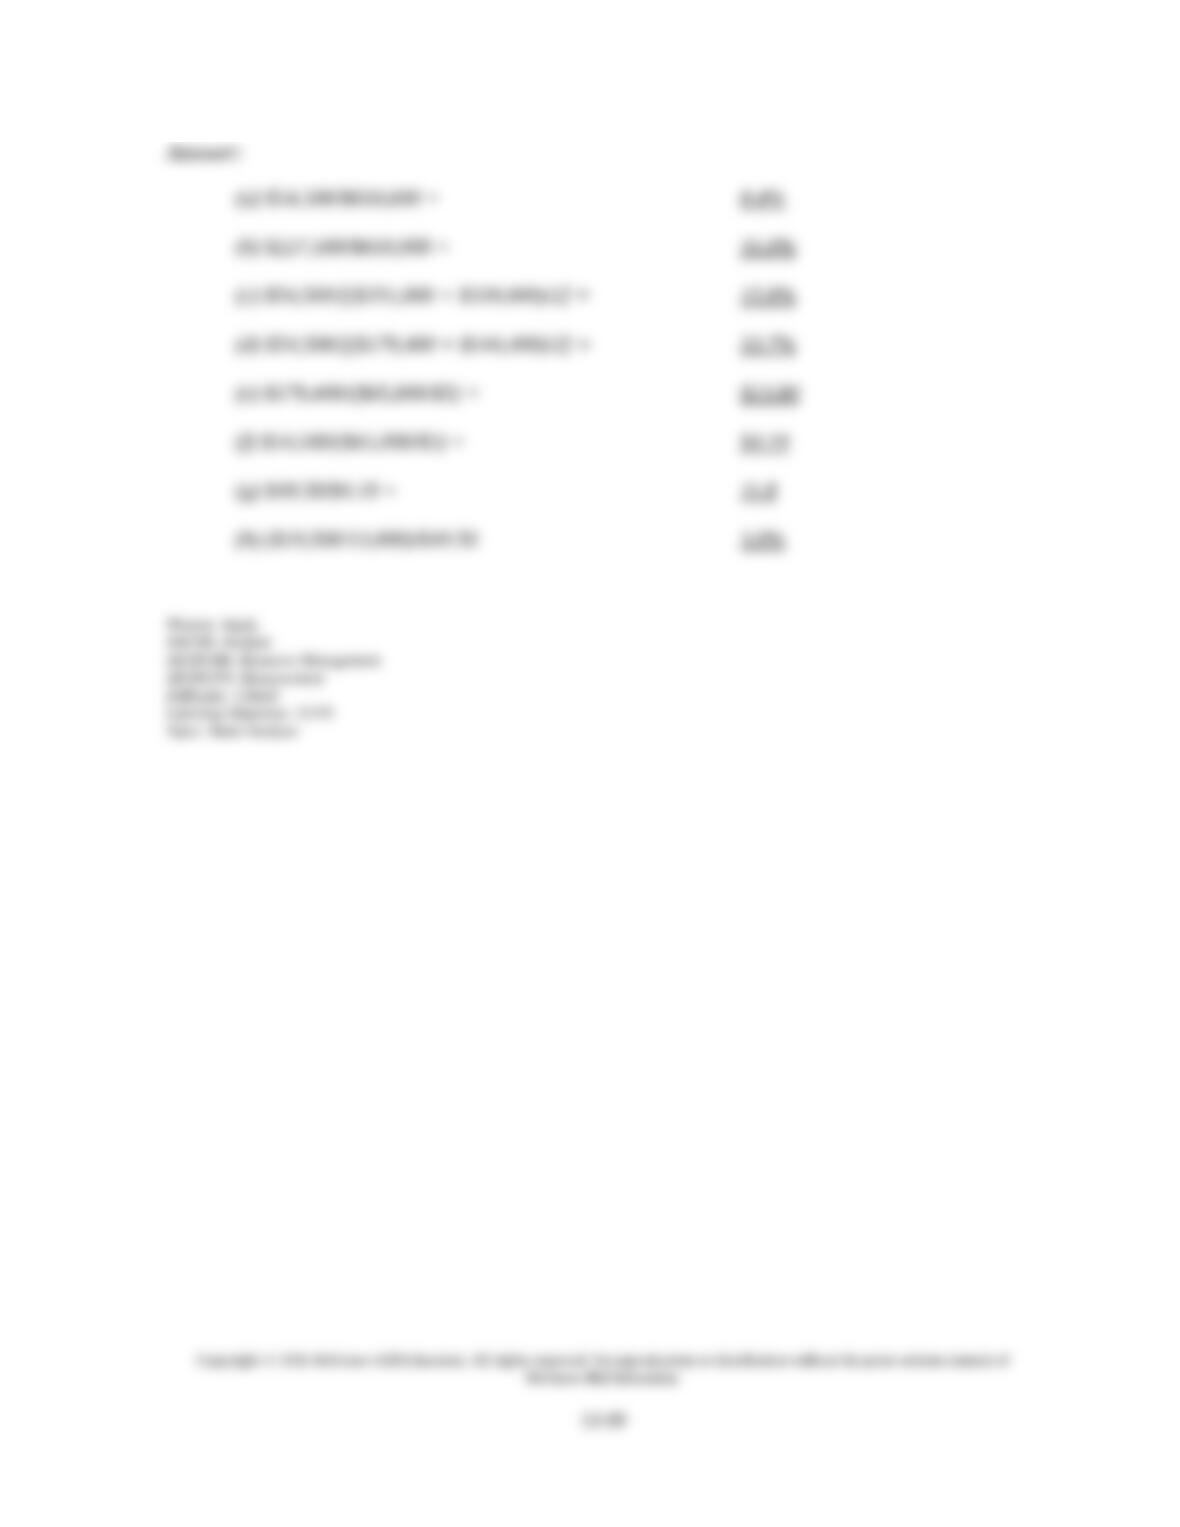
D. Management standards
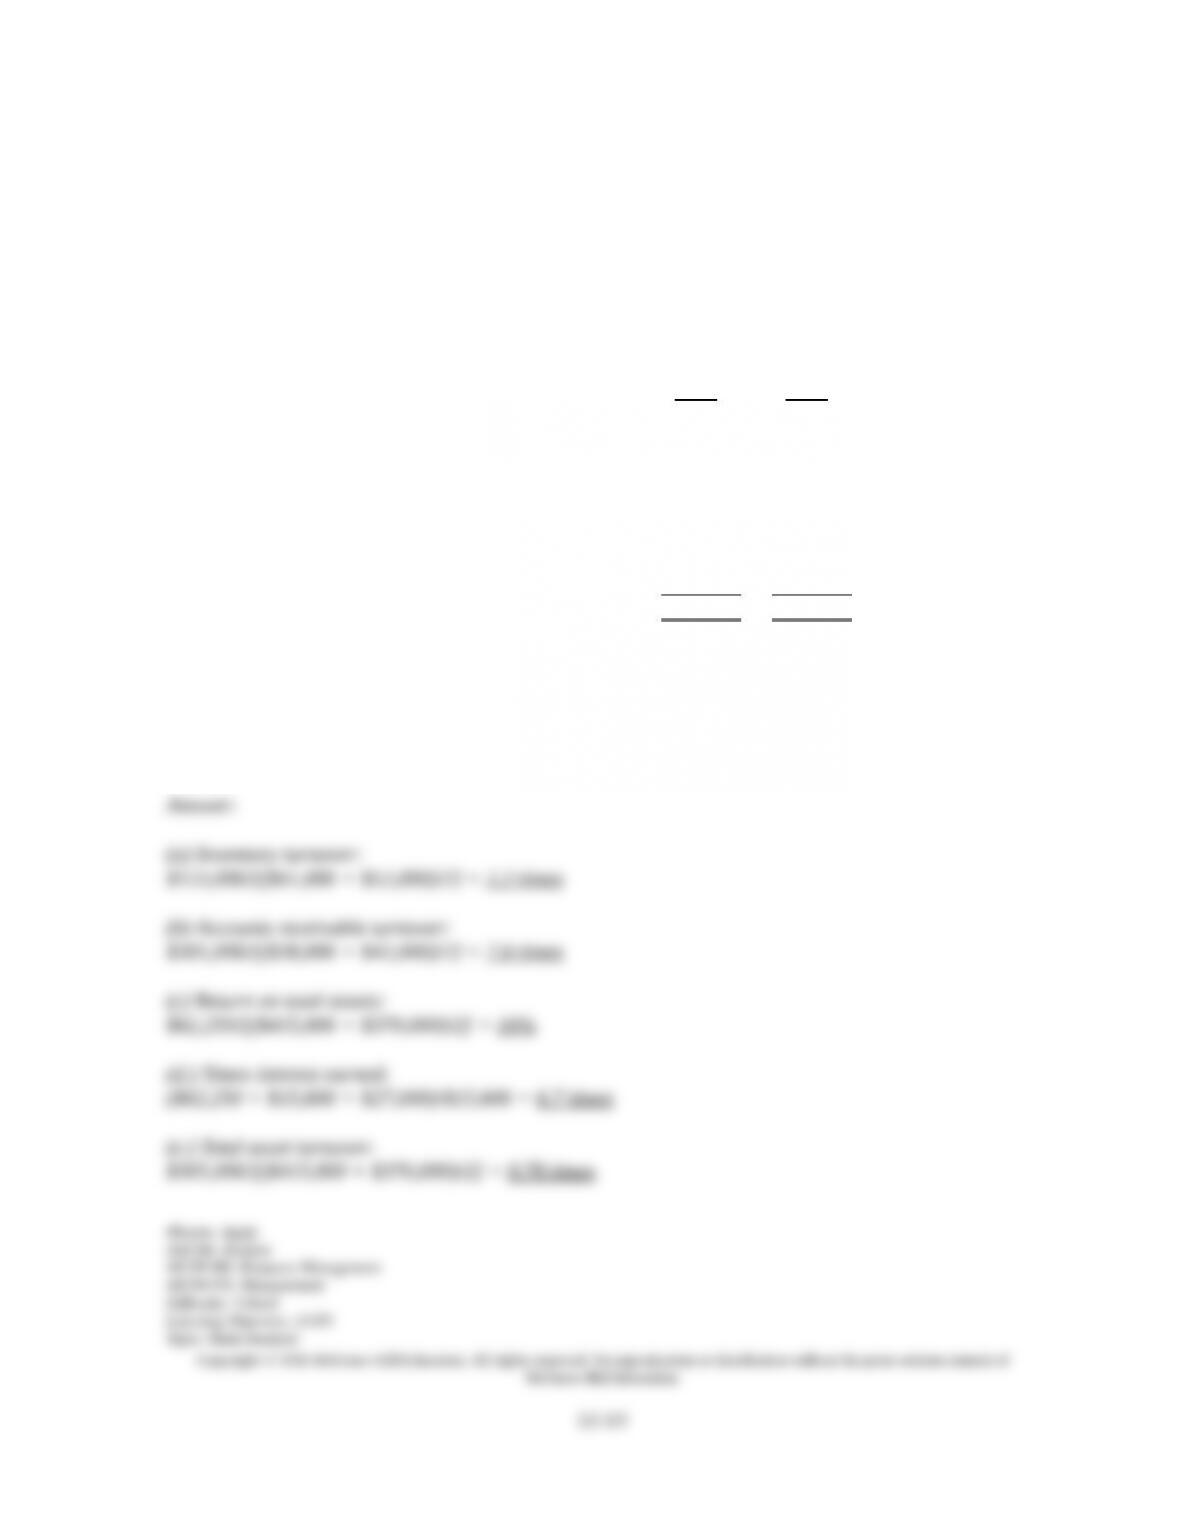
E. . Guidelines (rules of thumb).
75. Intra-company standards for financial statement analysis:
A. Are based on a company’s prior performance and relations between its financial items.
B. Are often set by competitors.
C. Are set by the company’s industry through published statistics.
D. Are based on rules of thumb.
E. Are published in Dun and Bradstreet.
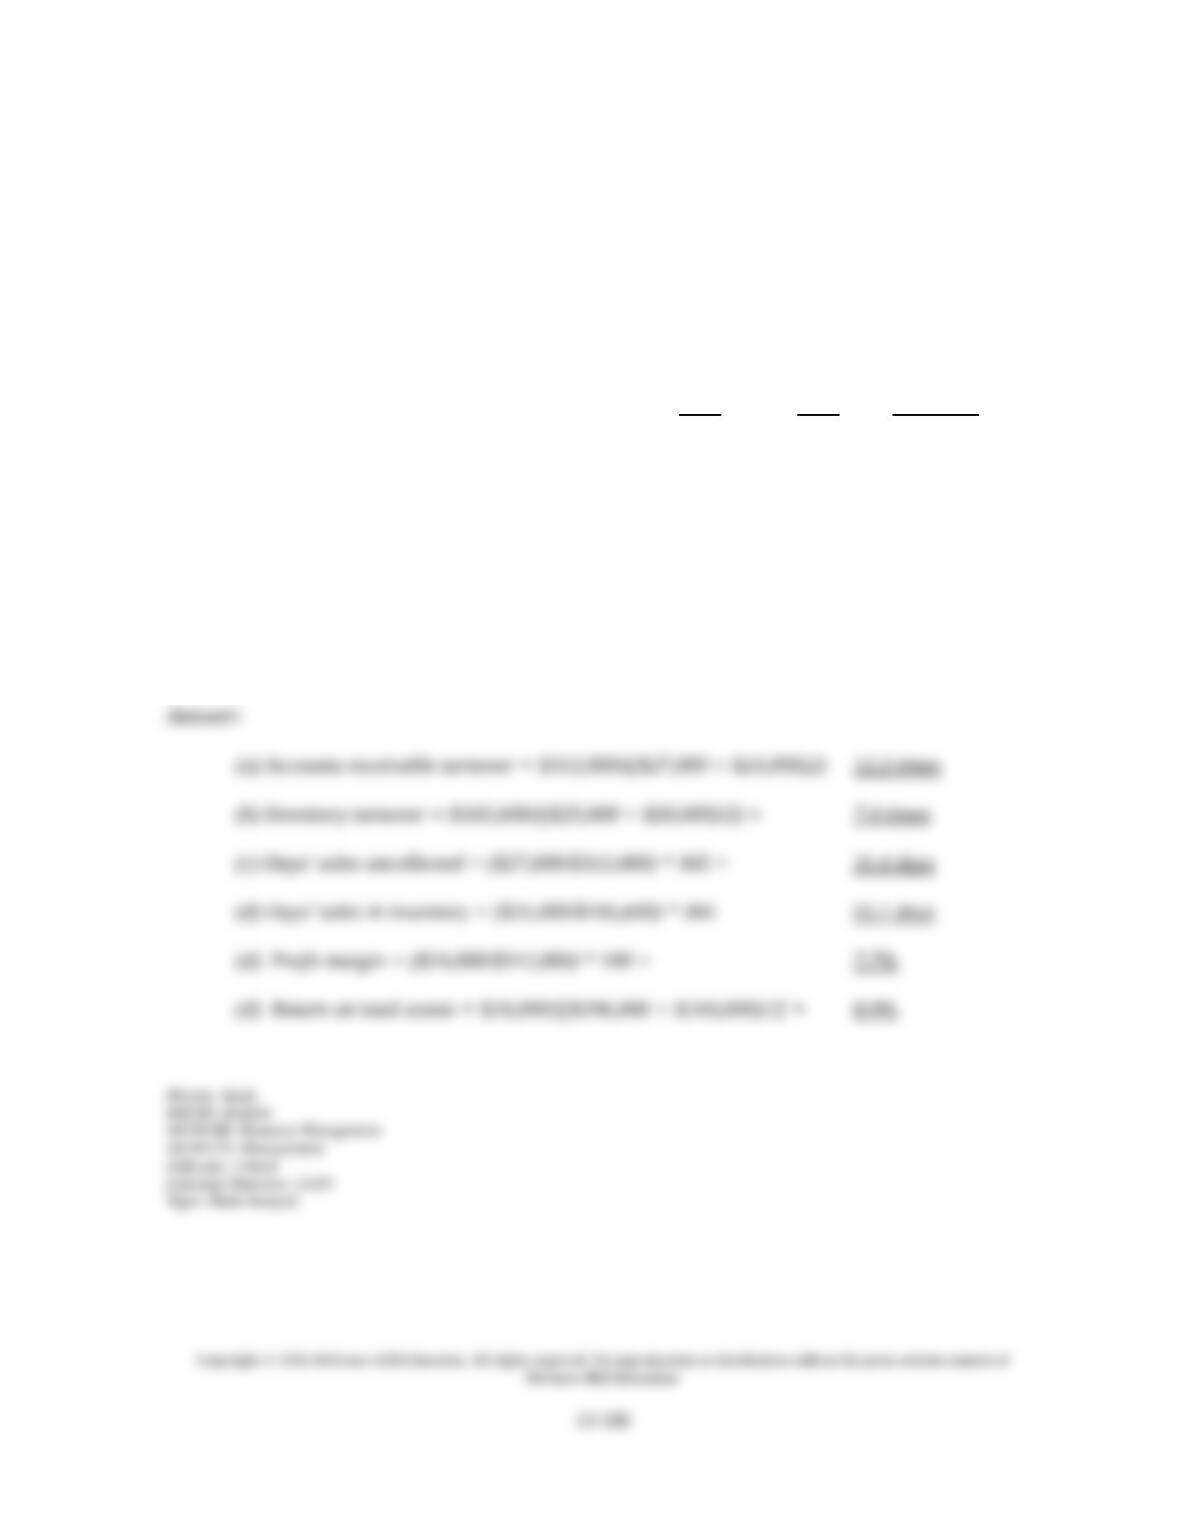
76. Industry standards for financial statement analysis:
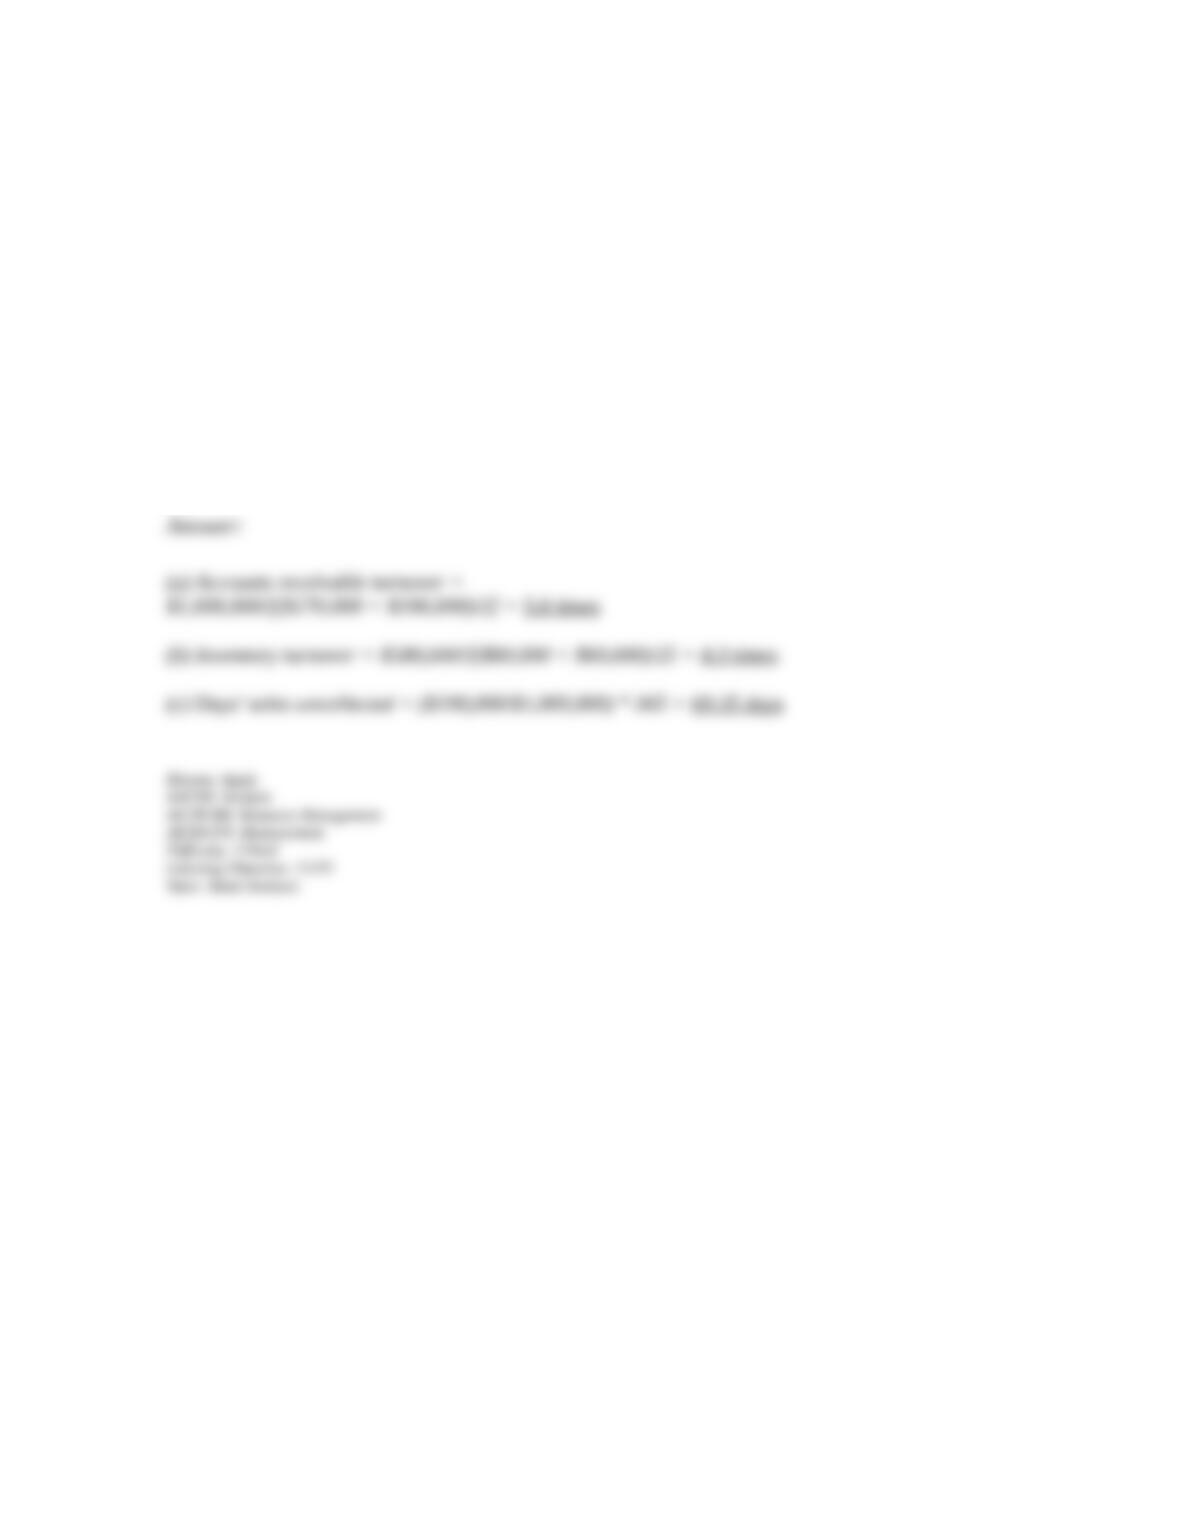
A. Are based on a single competitor’s financial performance.
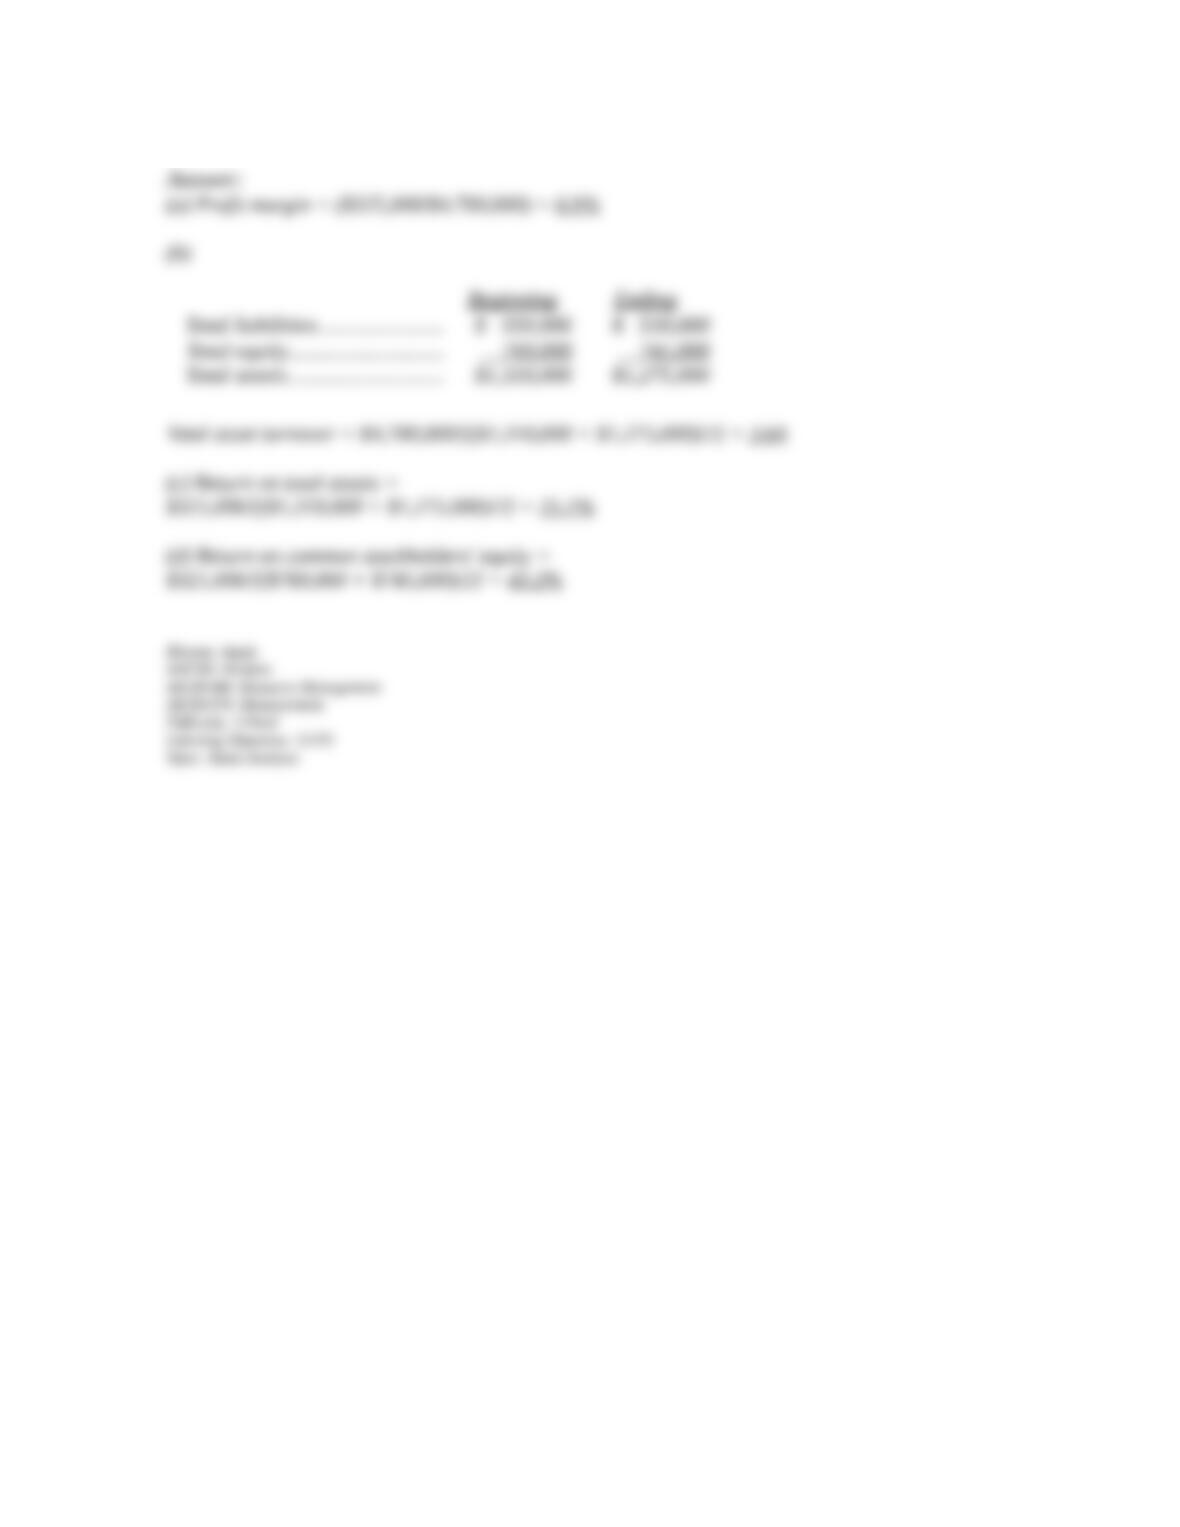
B. Are set by the government.
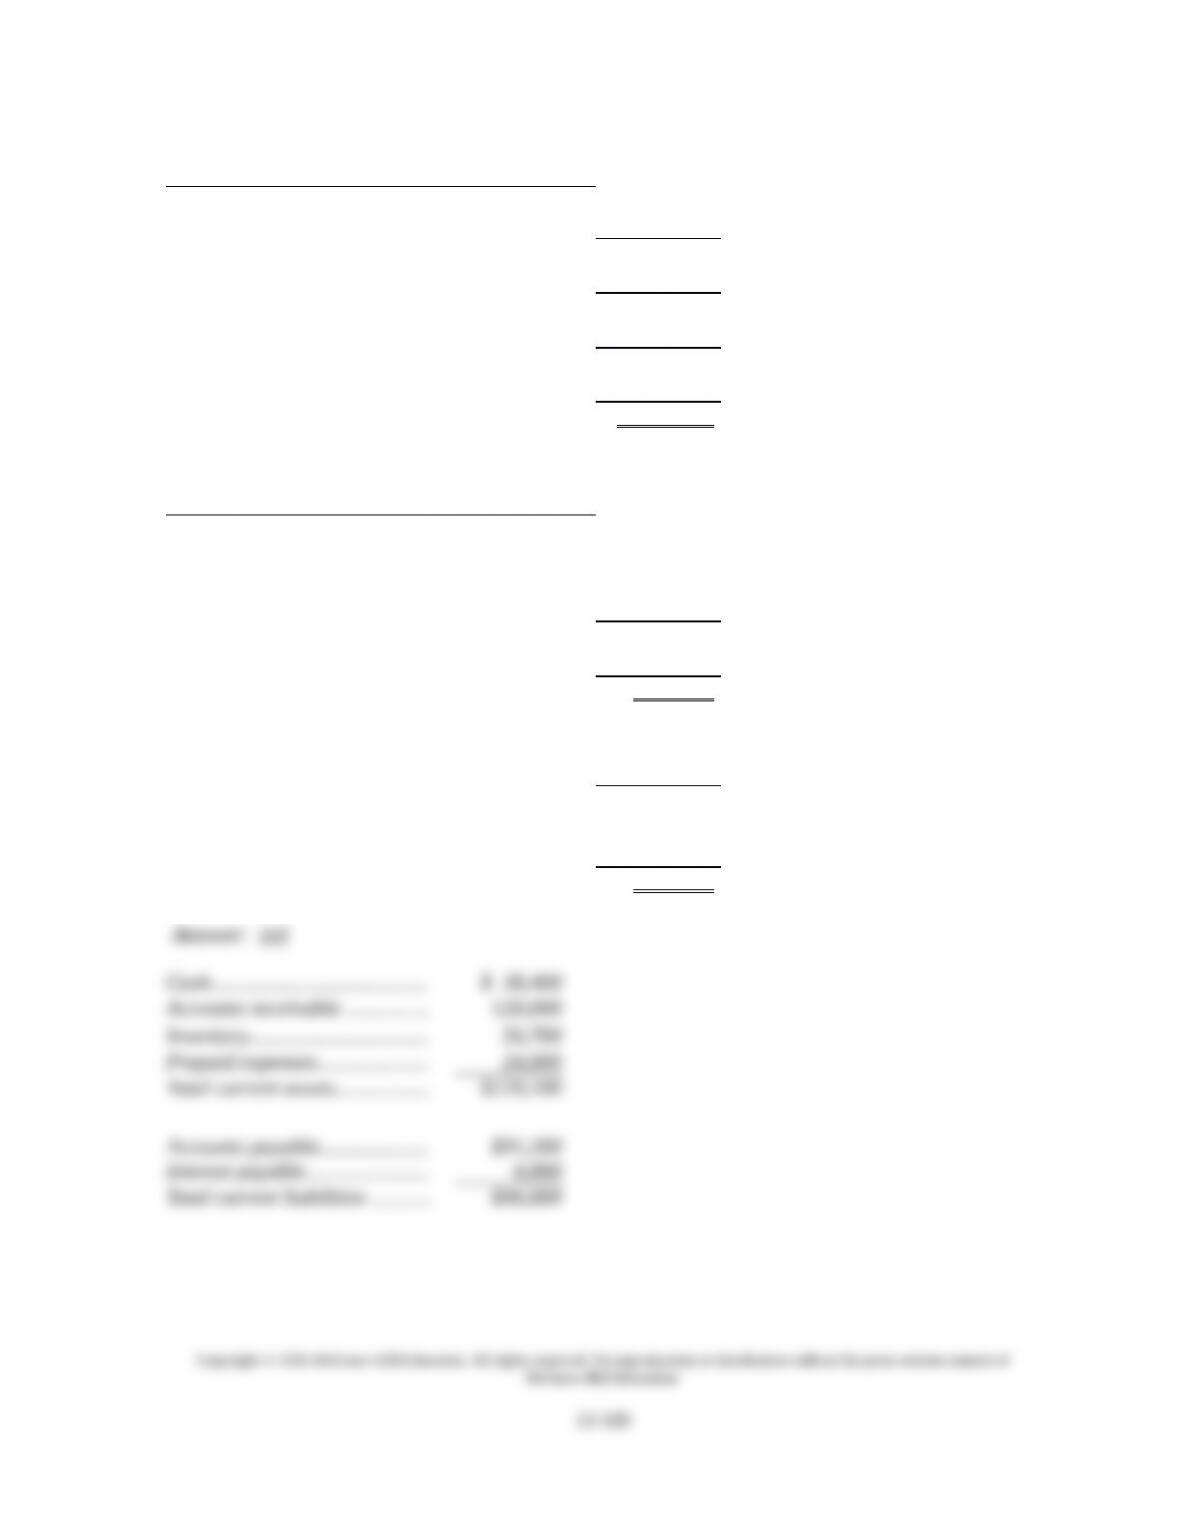
C. Are available for the financial performance and condition of the company’s industry.
D. Are based on rules of thumb.
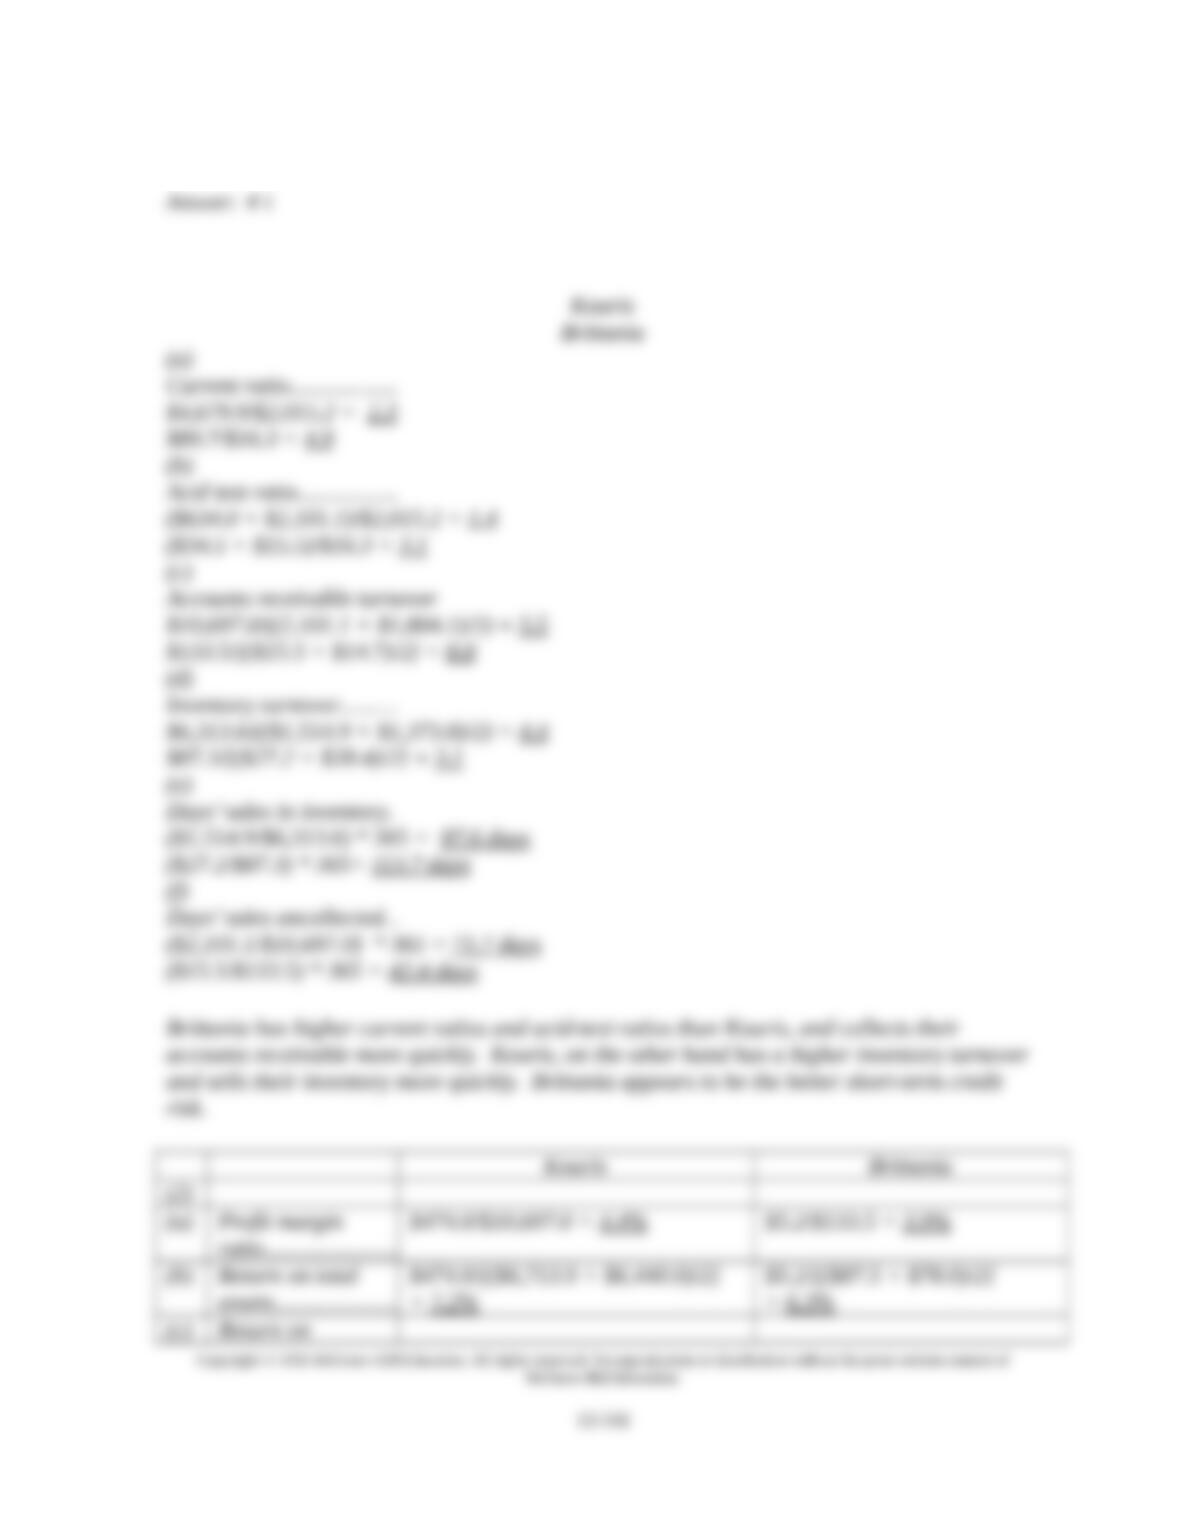
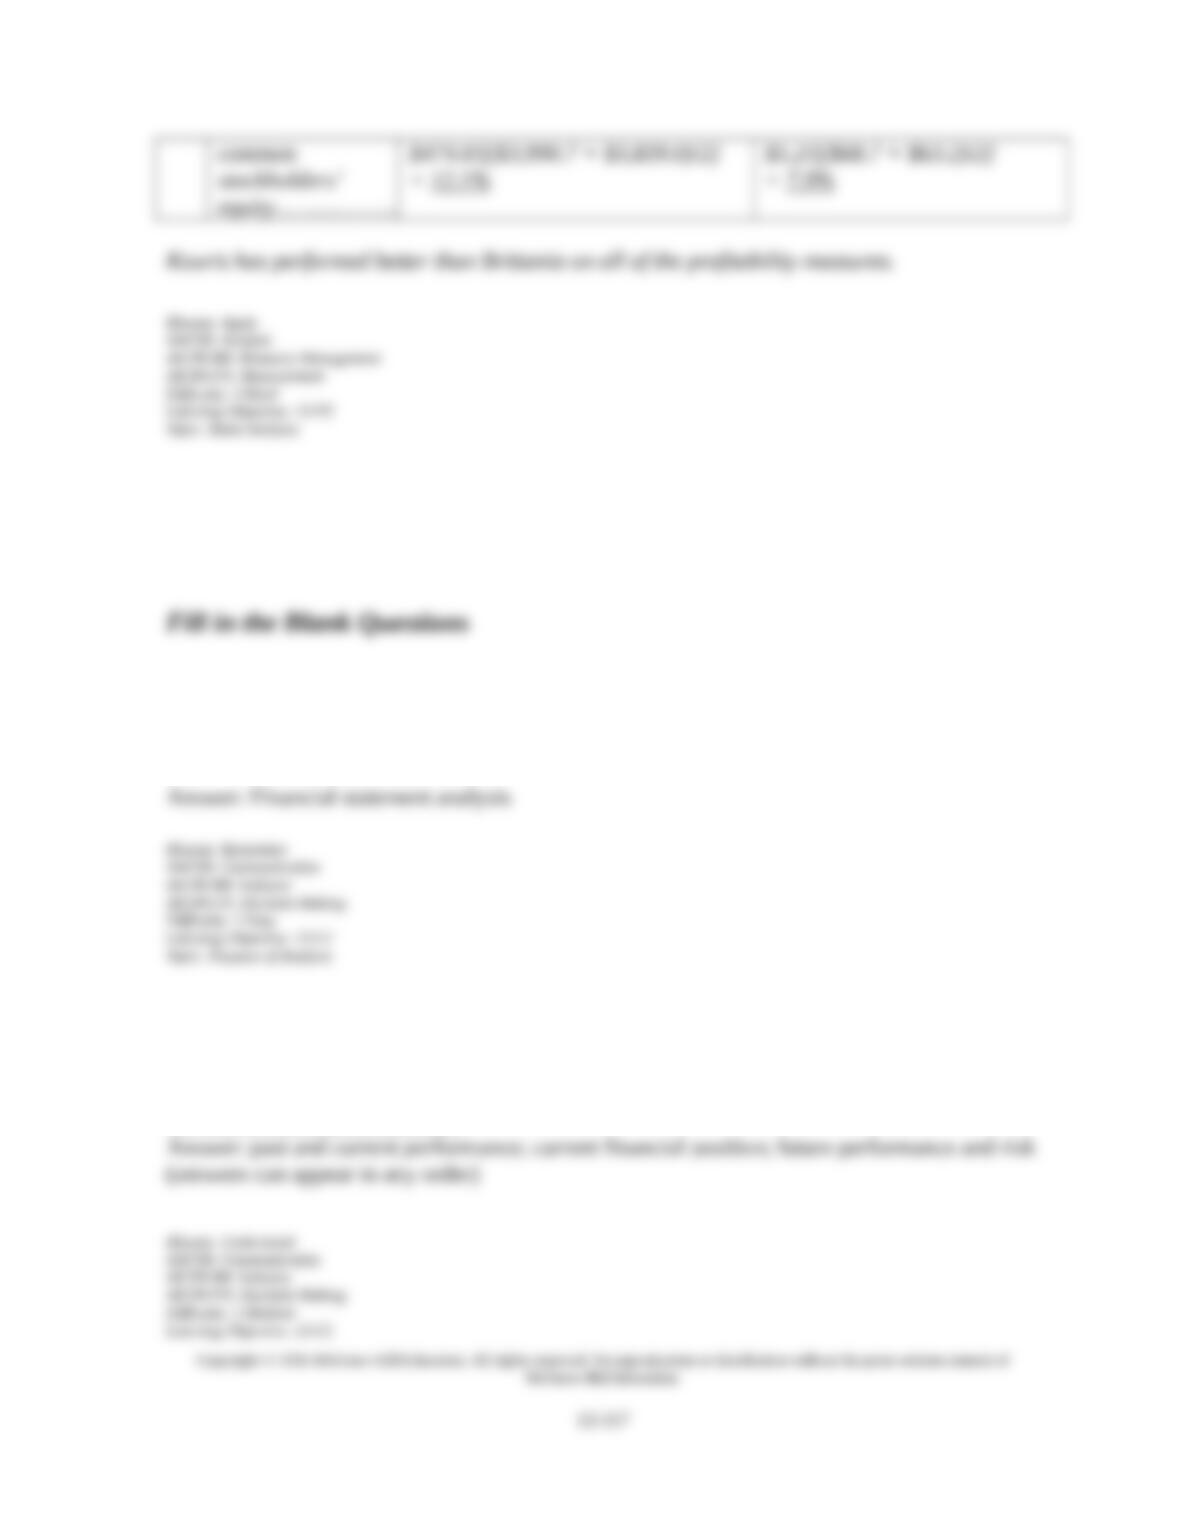
E. Compare a company’s income with its prior year’s income.
77. Guidelines (rules-of-thumb) are general standards of comparison developed from:
A. Industry statistics from the government.
B. Past experience.
C. Analysis of competitors.
D. Relations between financial items.
E. Dun and Bradstreet.
78. Three of the most common tools of financial analysis are:
A. Financial reporting, ratio analysis, vertical analysis.
B. Ratio analysis, horizontal analysis, financial reporting.
C. Horizontal analysis, vertical analysis, ratio analysis.
D. Trend analysis, financial reporting, ratio analysis.
E. Vertical analysis, political analysis, horizontal analysis.
79. The comparison of a company’s financial condition and performance across time is known
as:
A. Horizontal analysis.
B. Vertical analysis.
C. Political analysis.
D. Financial reporting.
E. Investment analysis.
80. The measurement of key relations among financial statement items is known as:
A. Financial reporting.
B. Horizontal analysis.
C. Investment analysis.
D. Ratio analysis.
E. Risk analysis.
81. The comparison of a company’s financial condition and performance to a base amount is
known as:
A. Financial reporting.
B. Horizontal ratios.
C. Investment analysis.
D. Risk analysis.
E. Vertical analysis.
82. A financial statement analysis report does not include:
A. An auditor statement.
B. An analysis overview.
C. Evidential matter.
D. Qualitative and quantitative key factors.
E. .Inferences such as forecasts
83. The background on a company, its industry, and its economic setting is usually included in
which of the following sections of a financial statement analysis report:
A. Executive summary.
B. Analysis overview.
C. Evidential conclusions.
D. Factor analysis.
E. Inferences.
84. All of the following are true of financial statement analysis report, except:
A. Contains ambiguities and qualifications.
B. Forces preparers to organize their reasoning and to verify the logic of analysis.
C. Serves as a method of communication to users.
D. Helps users and preparers to refine conclusions based on evidence from key building
blocks.
E. Enables readers to see the process and rationale of analysis.
85. When a company’s activities include income-related events not part of normal, continuing
operations, the complete income statement could potentially have the following sections:
A. Items from continuing operations and earnings per share for a corporation.
B. Income or loss from operating a discontinued segment for the current period.
C. The loss from disposing of the discontinued segment’s net assets.
D. Extraordinary items.
E. Continuing operations, discontinued segments, extraordinary items, changes in accounting
principles, and earnings per share for a corporation.

86. Which of the following items is not likely an extraordinary item?
A. Write down of inventories.
B. Condemnation of property by the city government.
C. Loss of use of property due to a new and unexpected environmental regulation.
D. Loss due to an unusual and infrequent calamity.
E. Expropriation of property by a foreign government.
87. Financial statements with data for two or more successive accounting periods placed in
columns side by side, sometimes with changes shown in both dollar amounts and percentages,
are referred to as:
A. Period-to-period statements.
B. Controlling statements.
C. Successive statements.
D. Comparative statements.
E. Serial statements.
88. Horizontal analysis:
A. Is a method used to evaluate changes in financial data across time.
B. Is also called vertical analysis.
C. Is the presentation of financial ratios.
D. Is a tool used to evaluate financial statement items relative to industry statistics.
E. Evaluates financial data across industries.
89. The dollar change for a comparative financial statement item is calculated by:
A. Subtracting the analysis period amount from the base period amount.
B. Subtracting the base period amount from the analysis period amount.
C. Subtracting the analysis period amount from the base period amount, dividing the result by
the base period amount, then multiplying that amount by 100.
D. Subtracting the base period amount from the analysis period amount, dividing the result by
the base period amount, then multiplying that amount by 100.
E. Subtracting the base period amount from the analysis amount, then dividing the result by
the base amount.
90. A company’s sales in Year 1 were $250,000 and in Year 2 were $287,500. Using Year 1 as
the base year, the percentage change for Year 2 compared to the base year is:
A. 87%.
B. 100%.
C. 115%.
D. 15%.
E. 13%.
91. Yeats Corporation’s sales in Year 1 were $396,000 and in Year 2 were $380,000. Using
Year 1 as the base year, the percentage change for Year 2 compared to the base year is:
A. 104%.
B. 100%.
C. 4%.
D. 96%.
E. 4.2%.
92. Ash Company reported sales of $400,000 for Year 1, $450,000 for Year 2, and $500,000
for Year 3. Using Year 1 as the base year, what were the percentage increases for Year 2 and
Year 3 compared to the base year?
A. 80% for Year 2 and 90% for Year 3.
B. 88% for Year 2 and 80% for Year 3.
C. 88% for Year 2 and 90% for Year 3.
D. 112.5% for Year 2 and 125% for Year 3.
E. 125% for Year 2 and 112.5% for Year 3.
93. In horizontal analysis the percent change is computed by:
A. Subtracting the analysis period amount from the base period amount.
B. Subtracting the base period amount from the analysis period amount.
C. Subtracting the analysis period amount from the base period amount, dividing the result by
the base period amount, then multiplying that amount by 100.
D. Subtracting the base period amount from the analysis period amount, dividing the result by
the base period amount, then multiplying that amount by 100.
E. Subtracting the base period amount from the analysis amount, then dividing the result by
the analysis period amount.
94. To compute trend percentages the analyst should:
A. Select a base period, assign each item in the base period statement a weight of 100%, and
then express financial numbers from other periods as a percent of their base period number.
B. Subtract the analysis period number from the base period number.
C. Subtract the base period amount from the analysis period amount, divide the result by the
analysis period amount, then multiply that amount by 100.
D. Compare amounts across industries using Dun and Bradstreet.
E. Compare amounts to a competitor.
95. Comparative financial statements in which each individual financial statement amount is
expressed as a percentage of a base amount are called:
A. Asset comparative statements.
B. Percentage comparative statements.
C. Common-size comparative statements.
D. Sales comparative statements.
E. General-purpose financial statements.

96. Common-size statements:
A. Reveal changes in the relative importance of each financial statement item to a base
amount.
B. Do not emphasize the relative importance of each item.
C. Compare financial statements over time.
D. Show the dollar amount of change for financial statement items.
E. Reveal patterns in data across successive periods.
97. The common-size percent is computed by:
A. Dividing the analysis amount by the base amount.
B. Dividing the base amount by the analysis amount.
C. Dividing the analysis amount by the base amount and multiplying the result by 100.
D. Dividing the base amount by the analysis amount and multiplying the result by 1,000.
E. Subtracting the base amount from the analysis amount and multiplying the result by 100.
98. A corporation reported cash of $14,000 and total assets of $178,300 on its balance sheet.
Its common-size percent for cash equals:
A. .0785%.
B. 7.85%.
C. 12.73%.
D. 1273%.
E. 7850%.
99. A corporation reported cash of $27,000 and total assets of $461,000 on its balance sheet.
Its common-size percent for cash equals:
A. 17.1%.
B. 58.6%.
C. 100%.
D. 5.86%.
E. 1707%.
100. Current assets minus current liabilities is:
A. Profit margin.
B. Financial leverage.
C. Current ratio.
D. Working capital.
E. Quick assets.
101. Jones Corp. reported current assets of $193,000 and current liabilities of $137,000 on its
most recent balance sheet. The working capital is:
A. 141%.
B. 71%.
C. ($56,000).
D. $56,000.
E. 41%.
102. Jones Corp. reported current assets of $193,000 and current liabilities of $137,000 on its
most recent balance sheet. The current ratio is:
A. 1.4:1
B. 0.7:1.
C. 0.3:1.
D. 1:1.
E. 0.4:1.
103. Jones Corp. reported current assets of $193,000 and current liabilities of $137,000 on its
most recent balance sheet. The current assets consisted of $62,000 Cash; $43,000 Accounts
Receivable; and $88,000 of Inventory. The acid-test (quick) ratio is:
A. 1.4:1
B. 0.77:1.
C. 0.54:1.
D. 1:1.
E. 0.64:1.
104. Current assets divided by current liabilities is the:
A. Current ratio.
B. Quick ratio.
C. Debt ratio.
D. Liquidity ratio.
E. Solvency ratio.
105. Quick assets divided by current liabilities is the:
A. Acid-test ratio.
B. Current ratio.
C. Working capital ratio.
D. Current liability turnover ratio.
E. Quick asset turnover ratio.

106. Net sales divided by Average accounts receivable, net is the:
A. Days’ sales uncollected.
B. Average accounts receivable ratio.
C. Current ratio.
D. Profit margin.
E. Accounts receivable turnover ratio.
107. Powers Company reported Net sales of $1,200,000 and average Accounts Receivable,
net of $78,500. The accounts receivable turnover ratio is:
A. 0.65 times
B. 14.3 times.
C. 28.6 times
D. 15.3 times
E. 16.3 times.

108. Powers Company reported Net sales of $1,200,000 and Accounts Receivable, net of
$78,500. The Day’s sales uncollected (rounded to whole days) is:
A. 24 days
B. 15 days.
C. 4 days.
D. 56 days.
E. 48 days.
109. Dividing Accounts receivable, net by Net sales and multiplying the result by 365 is the:
A. Profit margin.
B. Days’ sales uncollected.
C. Accounts receivable turnover ratio.
D. Average accounts receivable ratio.
E. Current ratio.
110. Dividing ending inventory by cost of goods sold and multiplying the result by 365 is the:
A. Inventory turnover ratio.
B. Profit margin.
C. Days’ sales in inventory.
D. Current ratio.
E. Total asset turnover.
111. Zhang Company reported Cost of goods sold of $835,000, beginning Inventory of
$37,200 and ending Inventory of $46,300. The average Inventory amount is:
A. $37,200
B. $46,300.
C. $83,500.
D. $41,750.
E. $9,100.
112. Zhang Company reported Cost of goods sold of $835,000 and average Inventory of
$41,750. The Inventory turnover ratio is:
A. 0.5 times
B. 418 times.
C. 20 times.
D. 56 times.
E. 19 times.
113. Zhang Company reported Cost of goods sold of $835,000 and ending Inventory of
$41,750. The Days’ sales in inventory (rounded to whole days) is:
A. 18 days
B. 418 days.
C. 10 days.
D. 56 days.
E. 20 days.

114. Net sales divided by average total assets is the:
A. Profit margin.
B. Total asset turnover.
C. Current ratio.
D. Sales return ratio.
E. Return on total assets.
115. Carducci Corporation reported Net sales of $3.6 million and average Total assets of $1.1
million. The Total asset turnover is:
A. 0.31 times
B. 3.27 times.
C. 4.30 times.
D. 2.27 times.
E. 0.77 times.
116. Carducci Corporation reported Net sales of $3.6 million and beginning Total assets of
$0.9 million and ending Total assets of 1.3 million. The average Total asset amount is:
A. $2.3 million
B. $2.7 million.
C. $0.25 million.
D. $0.36 million.
E. $1.1 million.
117. Net income divided by net sales is the:
A. Return on total assets.
B. Profit margin.
C. Current ratio.
D. Total asset turnover.
E. Days’ sales in inventory.

118. Martinez Corporation reported Net sales of $765,000 and Net income of $142,000. The
Profit margin is:
A. 539.0%.
B. 5.39%.
C. 81.4%.
D. 1.86%.
E. 18.56%.
119. Net income divided by average total assets is:
A. Profit margin.
B. Total asset turnover.
C. Return on total assets.
D. Days’ income in assets.
E. Current ratio.
120. Clairmont Industries reported Net income of $283,000 and average Total assets of
$637,000. The Return on total assets is:
A. 55.6%.
B. 88.8%.
C. 61.5%.
D. 44.4%.
E. 125.1%.
121. Annual cash dividends per share divided by market price per share is the:
A. Price-earnings ratio
B. Price-dividends ratio.
C. Profit margin.
D. Dividend yield ratio.
E. Earnings per share.
122. The market price of Horokhiv Corporation’s common stock at the start of 2014 was
$47.50 and it declared and paid cash dividends of $3.28 per share. The Dividend yield ratio
is:
A. 14.5%.
B. 7.4%.
C. 6.5%.
D. 144.8%.
E. 6.9%.
123. How long a company holds inventory before selling it can be measured by dividing cost
of goods sold by the average inventory balance to determine the:
A. Accounts receivable turnover.
B. Inventory turnover.
C. Days’ sales uncollected.
D. Current ratio.
E. Price earnings ratio.

124. A component of operating efficiency and profitability, calculated by expressing net
income as a percent of net sales, is the:
A. Acid-test ratio.
B. Merchandise turnover.
C. Price earnings ratio.
D. Accounts receivable turnover.
E. Profit margin ratio.
125. One of several ratios that reflects solvency includes the:
A. Acid-test ratio.
B. Current ratio.
C. Times interest earned ratio.
D. Total asset turnover.
E. Days’ sales in inventory.
126. A company had a market price of $27.50 per share, earnings per share of $1.25, and
dividends per share of $0.40. Its price-earnings ratio equals:
A. 3.1.
B. 22.0.
C. 93.8.
D. 32.0.
E. 3.3.
127. A company reports basic earnings per share of $3.50, cash dividends per share of $1.25,
and a market price per share of $64.75. The company’s dividend yield equals:
A. 1.93%.
B. 2.14%.
C. 4.67%.
D. 5.41%.
E. 18.50%.
128. Rajan Company’s most recent balance sheet reported total assets of $1.9 million, total
liabilities of $0.8 million, and total equity of $1.1 million. Its Debt to equity ratio is:
A. 0.42
B. 0.58
C. 1.38
D. 0.73
E. 1.00
129. Desjardin Landscaping’s income statement reports net income of $75,300, which
includes deductions for interest expense of $11,500 and income taxes of $34,900. Its times
interest earned is:
A. 10.6 times
B. 7.5 times
C. 4.0 times
D. 6.5 times
E. 0.15 times
130. Selected current year company information follows:
Net income ………………………………………………. $ 15,953
Net sales………………………………………………..…. 712,855
Total liabilities, beginning-year…….……........... 83,932
Total liabilities, end-of-year..………..…………….. 103,201
Total stockholders‘ equity, beginning-year….. 198,935
Total stockholders‘ equity, end-of-year............. 121,851
The total asset turnover is:
A. 2.24 times
B. 2.81 times
C. 3.64 times
D. 4.67 times
E. 6.28 times
131. Selected current year company information follows:
Net income ………………………………………………. $ 15,953
Net sales………………………………………………..…. 712,855
Total liabilities, beginning-year…….……........... 83,932
Total liabilities, end-of-year..………..…………….. 103,201
Total stockholders‘ equity, beginning-year…… 198,935
Total stockholders‘ equity, end-of-year............. 121,851
The return on total assets is:
A. 2.24%
B. 2.81%
C. 3.64%
D. 4.67%
E. 6.28%
132. All of the following statements regarding a business segment are true except:
A. A business segment is a part of a company’s operations that serves a particular product
line.
B. A segment has assets, liabilities, and financial results of operations that can be
distinguished from those of other parts of the company.
C. A company’s gain or loss from selling or closing down a segment is reported separately.
D. The income tax effects of a discontinued segment are combined with income tax from
continuing operations.
E. A segment’s income for the period prior to the disposal and the gain or loss resulting from
disposing of the segment’s assets are reported separately.
133. Use the following selected information from Wheeler, LLC to determine the 2015 and
2014 common size percentages for cost of goods sold using Net sales as the base.
2015 2014
Net sales $276,200 $231,400
Cost of goods sold 151,900 129,590
Operating expenses 55,240 53,240
Net earnings 27,820 19,820
A. 36.4% for 2015 and 41.1% for 2014.
B. 55.0% for 2015 and 56.0% for 2014.
C. 119.4% for 2015 and 100.0% for 2014.
D. 117.2% for 2015 and 100.0% for 2014.
E. 65.1% for 2015 and 56.0% for 2014.
134. Use the following selected information from Wheeler, LLC to determine the 2015 and
2014 common size percentages for operating expenses using Net sales as the base.
2015 2014
Net sales $276,200 $231,400
Cost of goods sold 151,900 129,590
Operating expenses 55,240 53,240
Net earnings 27,820 19,820
A. 36.4% for 2015 and 41.1% for 2014.
B. 55.0% for 2015 and 56.0% for 2014.
C. 23.9% for 2015 and 23.0% for 2014.
D. 103.8% for 2015 and 100.0% for 2014.
E. 20.0% for 2015 and 23.0% for 2014.
135. Use the following selected information from Wheeler, LLC to determine the 2015 and
2014 trend percentages for net sales using 2014 as the base.
2015 2014
Net sales $276,200 $231,400
Cost of goods sold 151,900 129,590
Operating expenses 55,240 53,240
Net earnings 27,820 19,820
A. 36.4% for 2015 and 41.1% for 2014.
B. 55.0% for 2015 and 56.0% for 2014.
C. 119.4% for 2015 and 100.0% for 2014.
D. 117.2% for 2015 and 100.0% for 2014.
E. 65.1% for 2015 and 64.6% for 2014.
136. Use the following selected information from Wheeler, LLC to determine the 2015 and
2014 trend percentages for cost of goods sold using 2014 as the base.
2015 2014
Net sales $276,200 $231,400
Cost of goods sold 151,900 129,590
Operating expenses 55,240 53,240
Net earnings 27,820 19,820
A. 36.4% for 2015 and 41.1% for 2014.
B. 55.0% for 2015 and 56.0% for 2014.
C. 119.4% for 2015 and 100.0% for 2014.
D. 117.2% for 2015 and 100.0% for 2014.
E. 65.1% for 2015 and 64.6% for 2014.
137. Refer to the following selected financial information from McCormik, LLC. Compute
the company’s working capital for Year 2.
Year 2 Year 1
Cash $37,500 36,850
Short-term investments 90,000 90,000
Accounts receivable, net 85,500 86,250
Merchandise inventory 121,000 117,000
Prepaid expenses 12,100 13,500
Plant assets 388,000 392,000
Accounts payable 113,400 111.750
Net sales 711,000 706,000
Cost of goods sold 390,000 385,500
A. $232,700.
B. $220,600.
C. $147,200.
D. $111,700.
E. $142,700.
138. Refer to the following selected financial information from McCormik, LLC. Compute
the company’s current ratio for Year 2.
Year 2 Year 1
Cash $37,500 36,850
Short-term investments 90,000 90,000
Accounts receivable, net 85,500 86,250
Merchandise inventory 121,000 117,000
Prepaid expenses 12,100 13,500
Plant assets 388,000 392,000
Accounts payable 113,400 111.750
Net sales 711,000 706,000
Cost of goods sold 390,000 385,500
A. 2.26.
B. 1.98.
C. 2.95.
D. 3.05.
E. 1.88.
139. Refer to the following selected financial information from McCormik, LLC. Compute
the company’s acid-test ratio for Year 2.
Year 2 Year 1
Cash $37,500 36,850
Short-term investments 90,000 90,000
Accounts receivable, net 85,500 86,250
Merchandise inventory 121,000 117,000
Prepaid expenses 12,100 13,500
Plant assets 388,000 392,000
Accounts payable 113,400 111.750
Net sales 711,000 706,000
Cost of goods sold 390,000 385,500
A. 2.26.
B. 1.98.
C. 2.95.
D. 3.05.
E. 1.88.

140. Refer to the following selected financial information from McCormik, LLC. Compute
the company’s accounts receivable turnover for Year 2.
Year 2 Year 1
Cash $37,500 36,850
Short-term investments 90,000 90,000
Accounts receivable, net 85,500 86,250
Merchandise inventory 121,000 117,000
Prepaid expenses 12,100 13,500
Plant assets 388,000 392,000
Accounts payable 113,400 111.750
Net sales 711,000 706,000
Cost of goods sold 390,000 385,500
A. 8.62.
B. 8.28.
C. 8.94.
D. 5.78.
E. 7.90.
141. Refer to the following selected financial information from McCormik, LLC. Compute
the company’s inventory turnover for Year 2.
Year 2 Year 1
Cash $37,500 36,850
Short-term investments 90,000 90,000
Accounts receivable, net 85,500 86,250
Merchandise inventory 121,000 117,000
Prepaid expenses 12,100 13,500
Plant assets 388,000 392,000
Accounts payable 113,400 111.750
Net sales 711,000 706,000
Cost of goods sold 390,000 385,500
A. 4.72.
B. 4.33.
C. 3.28.
D. 5.78.
E. 3.86.

142. Refer to the following selected financial information from McCormik, LLC. Compute
the company’s days’ sales uncollected for Year 2.
Year 2 Year 1
Cash $37,500 36,850
Short-term investments 90,000 90,000
Accounts receivable, net 85,500 86,250
Merchandise inventory 121,000 117,000
Prepaid expenses 12,100 13,500
Plant assets 388,000 392,000
Accounts payable 113,400 111.750
Net sales 711,000 706,000
Cost of goods sold 390,000 385,500
A. 43.9.
B. 42.3.
C. 46.2.
D. 80.0.
E. 113.3.
143. Refer to the following selected financial information from McCormik, LLC. Compute
the company’s days’ sales in inventory for Year 2.
Year 2 Year 1
Cash $37,500 36,850
Short-term investments 90,000 90,000
Accounts receivable, net 85,500 86,250
Merchandise inventory 121,000 117,000
Prepaid expenses 12,100 13,500
Plant assets 388,000 392,000
Accounts payable 113,400 111.750
Net sales 711,000 706,000
Cost of goods sold 390,000 385,500
A. 43.9.
B. 42.3.
C. 46.2.
D. 80.0.
E. 113.3.

144. Refer to the following selected financial information from Frankle Corp. Compute the
company’s working capital.
Current Assets 306,450
Plant assets 338,000
Current Liabilities 107,800
Net sales 676,000
Net Income 75,000
A. $536,650.
B. $230,200.
C. $568,200.
D. $198,650.
E. $231,450.
145. Refer to the following selected financial information from Frankle Corp. Compute the
company’s current ratio.
Current assets 306,450
Plant assets 388,000
Current Liabilities 107,800
Net sales 676,000
Net Income 75,000
A. 6.44.
B. 2.84.
C. 6.27.
D. 3.60.
E. 1.44.
146. Refer to the following selected financial information from Dodge Company. Compute
the company’s acid-test ratio.
Cash $42,250
Short-term investments 60,000
Accounts receivable, net 79,500
Merchandise inventory 115,000
Prepaid expenses 9,700
Accounts payable 111,400
A. 2.75.
B. 2.66.
C. 0.92.
D. 1.12.
E. 1.63.

147. Refer to the following selected financial information from Marston Company. Compute
the company’s accounts receivable turnover for Year 2.
Year 2 Year 1
Accounts receivable, net 86,500 82,750
Net sales 723,000 693,000
A. 8.36.
B. 8.37.
C. 4.78.
D. 8.59.
E. 8.54.
148. Refer to the following selected financial information from Marston Company. Compute
the company’s days’ sales uncollected for Year 2.
Year 2 Year 1
Accounts receivable, net 86,500 82,750
Net sales 723,000 693,000
A. 43.9.
B. 43.7.
C. 46.2.
D. 85.4.
E. 42.7.
149. Refer to the following selected financial information from Graceworks Corp. Compute
the company’s inventory turnover for Year 2.
Year 2 Year 1
Merchandise inventory 271,000 253,500
Cost of goods sold 486,400 433,100
A. 1.79.
B. 1.71.
C. 1.85.
D. 0.93.
E. 1.75.

150. Refer to the following selected financial information from Graceworks, Corp. Compute
the company’s days’ sales in inventory for Year 2.
Year 2 Year 1
Merchandise inventory 271,000 253,500
Cost of goods sold 486,400 433,100
A. 203.4.
B. 228.4.
C. 179.5.
D. 215.1.
E. 113.3.
151. Refer to the following selected financial information from Shakley’s Incorporated.
Compute the company’s profit margin for Year 2.
Year 2 Year 1
Net sales $478,500 $426,250
Cost of goods sold 276,300 250,120
Interest expense 9,700 10,700
Net income before tax 67,250 52,680
Net income after tax 46,050 39,900
Total assets 317,100 288,000
Total liabilities 181,400 167,300
Total equity 135,700 120,700
A. 14.1%.
B. 11.7%.
C. 9.6%.
D. 16.7%.
E. 33.9%.
152. Refer to the following selected financial information from Shakley’s Incorporated.
Compute the company’s return on total assets for Year 2.
Year 2 Year 1
Net sales $478,500 $426,250
Cost of goods sold 276,300 250,120
Interest expense 9,700 10,700
Net income before tax 67,250 52,680
Net income after tax 46,050 39,900
Total assets 317,100 288,000
Total liabilities 181,400 167,300
Total equity 135,700 120,700
A. 9.6%.
B. 15.2%.
C. 2.6%.
D. 22.2%.
E. 14.5%.
153. Refer to the following selected financial information from Shakley’s Incorporated.
Compute the company’s debt-to-equity ratio for Year 2.
Year 2 Year 1
Net sales $478,500 $426,250
Cost of goods sold 276,300 250,120
Interest expense 9,700 10,700
Net income before tax 67,250 52,680
Net income after tax 46,050 39,900
Total assets 317,100 288,000
Total liabilities 181,400 167,300
Total equity 135,700 120,700
A. 1.75.
B. 2.34.
C. 0.75.
D. 1.34.
E. 2.63.

154. Refer to the following selected financial information from Shakley’s Incorporated.
Compute the company’s times interest earned for Year 2.
Year 2 Year 1
Net sales $478,500 $426,250
Cost of goods sold 276,300 250,120
Interest expense 9,700 10,700
Net income before tax 67,250 52,680
Net income after tax 46,050 39,900
Total assets 317,100 288,000
Total liabilities 181,400 167,300
Total equity 135,700 120,700
A. 6.9.
B. 4.8.
C. 5.8.
D. 14.0.
E. 7.9.
155. Refer to the following selected financial information from Graphics, Inc. Compute the
company’s times interest earned.
Interest expense 9,100
Income tax expense 22,700
Net income after tax 56,500
A. 6.2.
B. 2.5.
C. 8.7.
D. 9.7.
E. 3.7.
156. Refer to the following selected financial information from Keller Company. Compute the
company’s debt to equity for Year 2.
Year 2 Year 1
Total assets 327,800 301,000
Total liabilities 171,400 169,300
Total equity 156,400 131,700
A. 0.9.
B. 1.1.
C. 0.5.
D. 1.9.
E. 2.1.
157. Match each of the following terms with the appropriate definitions.
A. Comparative financial statement
B. Horizontal analysis
C. Liquidity and efficiency
D. Vertical analysis
E. Financial statement analysis
F. Market prospects
G. Solvency
H. Debt to equity ratio
I. Profitability
J. Common-size financial statement
______ (1) A company’s ability to generate positive market expectations.
______ (2) The application of analytical tools to general-purpose financial statements and
related data for making business decisions.
______ (3) A measure of solvency presented as the ratio of total liabilities to total equity.
______ (4) A statement with data for two or more successive accounting periods placed in
side-by-side columns, often with changes shown in dollar amounts and percentages.
______ (5) A company’s ability to provide financial rewards sufficient to attract and retain
capital.
______ (6)A statement where each amount is expressed as a percent of a base amount to
reveal the relative importance of each financial statement item.
______ (7) The comparison of a company’s financial condition and performance to a base
amount.
______ (8) Examination of financial data across time.
______ (9) A company’s ability to generate future revenues and meet long-term obligations.
______ (10) The availability of resources to meet short-term obligations and to efficiently
generate revenues.
1. F; 2. E; 3. H; 4. A; 5. I; 6. J; 7. D; 8. B; 9. G; 10. C
Blooms: Remember
AACSB: Analytic
AICPA BB: Resource Management
AICPA FN: Measurement
Difficulty: 1 Easy
Learning Objective: 13-C1
Learning Objective: 13-C2
Learning Objective: 13-P1
Learning Objective: 13-P2
Learning Objective: 13-P3
Topic: Purpose of Analysis
Topic: Standards for Comparisons
Topic: Comparative Statements
Topic: Common-Size Statements
Topic: Ratio Analysis
Copyright © 2016 McGraw-Hill Education. All rights reserved. No reproduction or distribution without the prior written consent of
McGraw-Hill Education.
13-77

158. Match each of the following terms with the appropriate formulas.
A. Days’ sales in inventory
B. Dividend yield
C. Total asset turnover
D. Inventory turnover
E. Return on common stockholders’ equity
F. Gross margin ratio
G. Days’ sales uncollected
H. Profit margin ratio
I. Times interest earned
J. Debt ratio
__________ (1) Net income – Preferred dividends
Average common stockholders’ equity
__________(2) Accounts receivable * 365
Net sales
__________(3) Total liabilities
Total assets
__________ (4) Income before interest expense and income taxes
Interest expense
__________ (5) Annual cash dividends per share
Market price per share
__________ (6) Net sales – Cost of goods sold
Net sales
__________ (7) Cost of goods sold
Average inventory
__________ (8) Net sales
Average total assets
__________(9) Net income
Net sales
__________(10) Ending inventory * 365
Cost of goods sold
1. E; 2. G; 3. J; 4. I; 5. B; 6. F; 7. D; 8. C; 9. H; 10. A
Copyright © 2016 McGraw-Hill Education. All rights reserved. No reproduction or distribution without the prior written consent of
McGraw-Hill Education.
13-78
Blooms: Understand
AACSB: Analytic
AICPA BB: Resource Management
AICPA FN: Measurement
Difficulty: 2 Medium
Learning Objective: 13-P3
Topic: Ratio Analysis
159. Identify the financial analysis building block most appropriately associated with each
ratio listed below by placing the letter of the building block a through d beside each ratio 1
through 10. Each building block may be used more than once.
A. Liquidity and Efficiency
B. Solvency
C. Profitability
D. Market Prospects
__________ (1) Price Earnings Ratio
__________ (2) Dividend Yield
__________ (3) Accounts Receivable Turnover
__________ (4) Days’ Sales in Inventory
__________ (5) Return on Total Assets
__________ (6) Equity Ratio
__________ (7) Debt Ratio
__________ (8) Inventory Turnover
__________ (9) Basic Earnings per Share
__________ (10) Times Interest Earned
1. D; 2. D; 3. A; 4. A; 5. C; 6. B; 7. B; 8. A; 9. C; 10. B
Blooms: Understand
AACSB: Analytic
AICPA BB: Industry
AICPA FN: Measurement
Difficulty: 2 Medium
Learning Objective: 13-P3
Topic: Ratio Analysis
Copyright © 2016 McGraw-Hill Education. All rights reserved. No reproduction or distribution without the prior written consent of
McGraw-Hill Education.
13-79
Short Answer Questions
160. Explain the purpose of financial statement analysis for both external and internal users.
161. Identify and explain the four building blocks of financial statement analysis.
162. What are the four standards for comparisons in financial analysis? Give an example of
each.
163. Identify and describe three common tools of financial statement analysis.
Analysis: Three common tools of financial statement analysis are: (1) horizontal analysis,
which compares a company’s financial condition and performance across time; (2) vertical
analysis, which compares a company’s financial condition and performance to a base amount;
and (3) ratio analysis, which uses key relations between financial statement items.
Blooms: Understand
AACSB: Analytic
AICPA BB: Resource Management
AICPA FN: Measurement
Difficulty: 2 Medium
Learning Objective: 13-C2
Topic: Standards for Comparisons
Copyright © 2016 McGraw-Hill Education. All rights reserved. No reproduction or distribution without the prior written consent of
McGraw-Hill Education.
13-81
164. What is the purpose of a good financial statement analysis report? What are the key
components?
165. Describe the purpose of horizontal financial statement analysis and how it is applied.
166. Describe the purpose of vertical financial statement analysis and how it is applied.
167. Describe ratio analysis including its purpose, application, and interpretation.
168. A company’s sales in Year 1 were $280,000, and its sales in Year 2 were $341,600. Using
Year 1 as the base year, what is the sales trend percent for Year 2?
169. Calculate the percent increase or decrease for each of the following financial statement
items:
Year 2 Year 1
Cash…………………………………………..…..……..… $ 37,500 $ 30,000
Accounts receivable……………..………................ 63,000 52,500
Inventory………………………………………………..... 67,500 90,000
Accounts payable…….………..…………................ 35,100 27,000
Sales……………………………………………………..…. 187,500 150,000
Equipment……………………………………………...… 165,000 125,000
170. Comparative statements for Warmer Corporation are shown below:
Warmer Corporation
Comparative Income Statements
For the years ended December 31
2016 2015 2014
Sales……………..…………………............................ $14,800 $13,229 $13,994
Cost of goods sold……..………..…....................... 8,225 8,661 8,375
Gross profit…………………………………………...….. 6,575 4,568 5,619
Operating expenses………..……………..…….......... 3,664 3,576 3,487
Operating income…..…..………........................... $ 2,911 $ 992 $ 2,132
Calculate trend percentages for all income statement amounts shown and comment on the
results. Use 2014 as the base year. Comment on the results.
171. Calculate the percent increases for each of the following selected balance sheet items.
2016 2015
Cash……………………………………………………………... $ 569 $ 448
Accounts receivable………………………………………… 2,234 2,337
Merchandise inventory…..………..……..................... 1,062 1,071
Plant assets………………………………………..…..……... 2,432 2,138
Bonds payable…….…..…………………....................... 1,164 1,666
Equity……………………………………………….…..…..…. 2,777 2,894
172. For the following financial statement items, calculate trend percentages using 2014 as the
base year:
2018 2017 2016 2015 2014
Sales…………………… $1,195,400 $1,118,000 $1,049,000 $963,200 $860,000
Cost of sales………….. 752,400 704,000 671,000 616,700 559,000
Gross profit……………. $443,000 $414,000 $378,000 $346,500 $301,000
173. Express the following income statement information in common-size percentages and in
trend percentages using 2014 as the base year.
Common-Size Trend
Percentages Percentages
2015 2014 2015 2014 2015 2014
Sales……..................... $540,000 $460,000 ____ ____ ____ ____
Cost of goods sold...... 290,000 240,000 ____ ____ ____ ____
Gross profit…….…….... $250,000 $220,000 ____ ____ ____ ____
174. The comparative balance sheet for Silverlight Co. is shown below. Express the balance
sheet in common-size percentages.
Silverlight Company
Comparative Balance Sheets (in $000)
December 31, 2014–2016
2016 2015 2014
Cash……………………………………………………………... $ 49.6 $ 34.2 $ 35.7
Accounts receivable………………………………………… 74.4 85.5 76.5
Merchandise inventory…..………..……..................... 148.8 125.4 91.8
Plant assets (net)…………………………………………..… 347.2 324.9 306.0
Total assets….…..…………………..….......................... $620.0 $570.0 $510.0
Accounts payable……………………………………………. $117.8 $ 51.3 $ 76.5
Bonds payable…….…..…………………....................... 130.2 159.6 107.1
Common stock……………………………………………….. 266.6 279.3 265.2
Retained earnings….…………………..…..................... 105.4 79.8 61.2
Total liabilities and equity.…..…............................. $620.0 $570.0 $510.0
175. Express the following balance sheets for Safety Company in common-size percentages.
Safety Company
Balance Sheets
December 31, 2015 and 2014
2015 2014
Assets
Cash…………………………………………..…..……..… $ 43,000 $ 22,000
Accounts receivable……………..………................ 38,000 42,000
Merchandise inventory…..………..……………....... 61,000 52,000
Prepaid insurance…….………..…………................ 6,000 9,000
Long-term investments……………………………….. 49,000 20,000
Plant assets (net)…..……………........................... 218,000 218,000
Total assets…………………………………………..…... $415,000 $363,000
Liabilities and Equity
Current liabilities………..……….......................... $ 62,000 $ 75,000
Long-term liabilities…………………………………… 45,000 36,000
Common stock…..…………………..…................... 150,000 150,000
Retained earnings………………………………….…... 158,000 102,000
Total liabilities and equity.…..…………............... $415,000 $363,000
176. Express the following income statement information in common-size percentages (round
to nearest whole percent). Comment on the results.
Haans Corp.
Comparative Income Statements
For Years Ended December 31, 2016 and 2015
2016 2015
Sales……………………………………………………..…. $1,200,000 $1,000,000
Cost of goods sold…………………………………..…. 804,000 650,000
Gross profit…….………..………………................... $ 396,000 $ 350,000
Selling expenses…………………………………….….. 132,000 120,000
Administrative expenses…..……........................ 180,000 150,000
Net income…………………………………………..…... $ 84,000 $ 80,000
177. Use the balance sheets of Glover shown below to calculate the following ratios for 2016
(round to the hundredths):
(a) Current ratio.
(b) Acid-test ratio.
(c) Debt ratio.
(d) Equity ratio.
Glover Company
Balance Sheets
December 31, 2016 and 2015
2016 2015
Assets:
Cash…………………………………………..…..……..… $ 43,000 $ 22,000
Accounts receivable……………..………................ 38,000 42,000
Merchandise inventory…..………..……………....... 61,000 52,000
Prepaid insurance…….………..…………................ 6,000 9,000
Long-term investments……………………………….. 49,000 20,000
Plant assets (net)…..……………........................... 218,000 218,000
Total assets…………………………………………..…... $415,000 $363,000
Liabilities and Equity:
Current liabilities………..……….......................... $ 62,000 $ 75,000
Long-term liabilities…………………………………… 45,000 36,000
Common stock…..…………………..…................... 150,000 150,000
Retained earnings………………………………….…... 158,000 102,000
Total liabilities and equity.…..…………............... $415,000 $363,000
178. The following information is available for the Starr Corporation:
Sales……………………………………………………. $750,000
Cost of goods sold……….……………………….. 450,000
Gross profit……………………………….…………. 300,000
Operating income……….………………………… 85,000
Net income………………………………………..…. 42,000
Inventory, beginning-year………………………. 71,200
Inventory, end-of-year…………………………… 48,800
Calculate the company’s inventory turnover and its days’ sales in inventory.
179. The following current year information is available from a manufacturing company:
Sales…………………………………………..……….. $740,000
Gross profit on sales……………………………… 276,000
Operating income……………………….………… 64,000
Income before taxes….…….……………………. 44,000
Net income………………………………………….. 33,600
Accounts Receivable, beginning-year……… 58,000
Accounts Receivable, end-of-year…..……… 72,000
Calculate the company’s accounts receivable turnover and its days’ sales uncollected.
180. Information from a manufacturing company’s current year income statement follows.
Calculate the company’s (a) profit margin ratio, (b) gross margin ratio, and (c) times interest
earned.
Blooms: Apply
AACSB: Analytic
AICPA BB: Resource
Management
AICPA FN: Measurement
Difficulty: 3 Hard
Learning Objective: 13-P3
Topic: Ratio Analysis
181. A company
reported net income
of $78,000 and had
15,000 common
shares outstanding
throughout the
current year. At year-
end, the price per share of the company’s stock was $49.40. What is the company’s year-end
price-earnings ratio?
Answer: Earnings per share = $78,000/15,000 shares = $5.20 per share
Price-earnings ratio = $49.40/$5.20 = 9.5
Blooms: Apply
AACSB: Analytic
AICPA BB: Resource Management
AICPA FN: Measurement
Difficulty: 3 Hard
Learning Objective: 13-P3
Topic: Ratio Analysis
Copyright © 2016 McGraw-Hill Education. All rights reserved. No reproduction or distribution without the prior written consent of
McGraw-Hill Education.
13-95
Sales……………………………….………………….. $850,000
Cost of goods sold……….……………………….
455,000
Gross profit…………………………….…………… $395,000
Operating expenses………………………….……
260,000
Operating income……….……………………….. $ 135,000
Interest expense…………………………………….
32,000
Income before taxes……………………………... $103,000
Income taxes expense……………………………
12,400
Net income………………………………………….. $ 90,600
Answer:
(a) $90,600/$850,000 = 10.7%
(b) $395,000/$850,000 = 46.5%
(c) $135,000/$32,000 = 4.2

182. A company paid cash dividends on its preferred stock of $40,000 in the current year
when its net income was $120,000 and its average common stockholders’ equity was
$640,000. What is the company’s return on common stockholders’ equity?
183. Use the financial data shown below to calculate the following ratios for the current year:
(a) Current ratio.
(b) Acid-test ratio.
(c) Accounts receivable turnover.
(d) Days’ sales uncollected.
(e) Inventory turnover.
(f) Days’ sales in inventory.
Income statement data
Sales (all on credit)………………………………… $650,000
Cost of goods sold…………………………………. 425,000
Income before taxes……………………………….. 78,000
Net income………………………………………… 54,600
Ending
Balances
Beginning
Balances
Cash…………………………………………………….. $ 19,500 $ 15,000
Accounts receivable (net) ……………………… 65,000 60,000
Inventory………………………………….………….. 71,500 64,500
Plant and equipment (net)…………………….…
195,000
183,900
Total assets……………………….………………….. $351,000 $323,400
Current liabilities ….….………………………….. $ 62,400 $ 52,700
Long-term notes payable…..….……………….. 97,500 100,000
Copyright © 2016 McGraw-Hill Education. All rights reserved. No reproduction or distribution without the prior written consent of
McGraw-Hill Education.
13-96

184. A company’s calendar-year financial data are shown below. The company had total assets
of $339,000 and total equity of $144,400 for the prior year. No additional shares of common
stock were issued during the year. The December 31 market price per share is $49.50. Cash
dividends of $19,500 were paid during the year. Calculate the following ratios for the
company:
(a) profit margin ratio
(b) gross margin ratio
(c) return on total assets
(d) return on common stockholders’ equity
(e) book value per common share
(f) basic earnings per share
(g) price earnings ratio
(h) dividend yield.
Net sales………………………………………………...… $650,000
Cost of goods sold…………………………………..…. 422,500
Gross profit………………………………....…..…..….. $227,500
Operating expenses………..………….................... 140,500
Operating income………………………………….…... $ 87,000
Interest expense…………………………………………. 9,100
Income before taxes…………………..................... $ 77,900
Income taxes………..…………………..................... 23,400
Net income…………………………………………..…... $ 54,500
Ending
Balances
Cash…………………………………………..…..……..… $ 19,500
Accounts receivable (net)………………………..….. 65,000
Inventory………………………………………………..... 71,500
Plant assets (net)…..……………........................... 195,000
Total assets…………………………………………..…... $351,000
Current liabilities………..……….......................... $ 74,100
Long-term notes payable…..…………………......... 97,500
Common stock, $5 par value …..………..…......... 65,000
Retained earnings………………………………….…... 114,400
Total liabilities and equity.…..…………............... $351,000
Copyright © 2016 McGraw-Hill Education. All rights reserved. No reproduction or distribution without the prior written consent of
McGraw-Hill Education.
13-98
185. A company’s calendar-year financial data are shown below. The company had total assets
of $339,000 and total equity of $144,400 for the prior year. No additional shares of common
stock were issued during the year. The December 31 market price per share is $49.50. Cash
dividends of $19,500 were paid during the year. Calculate the following ratios for the
company:
(a) debt ratio
(b) equity ratio
(c) debt-to-equity ratio
(d) times interest earned
(e) total asset turnover
Net sales………………………………………………...… $650,000
Cost of goods sold…………………………………..…. 422,500
Gross profit………………………………....…..…..….. $227,500
Operating expenses………..………….................... 140,500
Operating income………………………………….…... $ 87,000
Interest expense…………………………………………. 9,100
Income before taxes…………………..................... $ 77,900
Income taxes………..…………………..................... 23,400
Net income…………………………………………..…... $ 54,500
Ending
Balances
Cash…………………………………………..…..……..… $ 19,500
Accounts receivable (net)………………………..….. 65,000
Inventory………………………………………………..... 71,500
Plant assets (net)…..……………........................... 195,000
Total assets…………………………………………..…... $351,000
Current liabilities………..……….......................... $ 74,100
Long-term notes payable…..…………………......... 97,500
Common stock, $5 par value …..………..…......... 65,000
Retained earnings………………………………….…... 114,400
Total liabilities and equity.…..…………............... $351,000
186. Comparative calendar-year financial data for a company are shown below. Calculate the
following ratios for the company for 2016:
(a) accounts receivable turnover
(b) day’s sales uncollected
(c) inventory turnover
(d) days’ sales in inventory
2016 2015
Sales……………………………………………………..…. $ 720,000 $607,500
Cost of goods sold…………………………………..…. 450,000 382,700
Operating expenses………..………….................... 168,500 134,900
Net income…………………………………………..…... 51,200 51,700
December 31, December 31,
2016 2015
Accounts receivable (net)….…..……………..…..... $ 157,500 $162,500
Inventory………………………………………………..... 139,500 110,500
Total assets…………………………………………..…... 1,012,500 944,800
187. Comparative calendar year financial data for a company are shown below. Calculate the
following ratios for 2016:
(a) return on total assets
(b) return on common stockholders’ equity.
2016 2015
Sales……………………………………………………..…. $ 720,000 $ 607,500
Gross profit…….………..………………................... 270,000 224,800
Income before taxes…………………..................... 79,200 78,700
Net income…………………………………………..…... 51,200 51,700
December 31, December 31,
2016 2015
Liabilities……………………………………..…..……... $ 493,500 $ 452,500
Common stock ($12 par)…….………..…………..... 180,000 180,000
Contributed capital in excess of par.................. 135,000 135,000
Retained earnings………………………………….…... 204,000 177,300
Total liabilities and equity.…..…………............... $1,012,500 $ 944,800
188. The current year-end balance sheet data for a company are shown below. Calculate the
company’s:
(a) working capital
(b) current ratio
(c) acid-test ratio.
Assets:
Cash………………………………………………………….. $ 38,000
Marketable securities……………………................. 45,000
Accounts receivable (net)….………..................... 127,500
Merchandise inventory………….......................... 149,500
Long-term investments…………..…..................... 135,000
Plant assets (net)….…………………....................... 517,500
Total assets………………………………………...…..…. $ 1,012,500
Liabilities and equity:
Accounts payable………………………………..……... $ 148,700
Accrued liabilities……………………………...…..….. 90,000
Notes payable (secured by plant assets) 254,800
Common stock ($12 par)……..…........................ 180,000
Contributed capital in excess of par.................. 135,000
Retained earnings……………………………………..... 204,000
Total liabilities and equity.….............................. $
1,012,500
189. The comparative income statements for Silverlight Company are shown below. Calculate
the following ratios for 2016:
(a) profit margin
(b) gross margin
(c) times interest earned.
Silverlight Company
Income Statements
For Years Ended December 31,
2016 2015
Net sales………………………………………………...… $720,000 $607,500
Cost of goods sold…………………………………..…. 450,000 382,700
Gross profit…….………..………………................... $270,000 $224,800
Operating expense……………………………………... 168,500 134,900
Income from operations…………........................ $101,500 $ 89,900
Interest expense…………………………………………. 22,300 11,200
Income before taxes…………………..................... $ 79,200 $ 78,700
Income taxes………..…………………..................... 28,000 27,000
Net income…………………………………………..…... $ 51,200 $ 51,700
190. A corporation reports the following year-end balance sheet data. Calculate the following
ratios:
(a) working capital
(b) acid-test ratio
(c) current ratio
(d) debt ratio
(e) equity ratio
(f) debt-to-equity ratio
Cash……………………….. $ 50,000 Current liabilities……………..………….. $ 64,000
Accounts receivable………. 35,000 Long-term liabilities………..…………….72,000
Inventory………………….. 60,000 Common stock……………...…………..100,000
Equipment………………… 140,000
Retained earnings………………………….49 ,000
Total assets……………….. $285,000
Total liabilities and equity…..…….$285 ,000
191. Selected balances from a company’s financial statements are shown below. Calculate the
following ratios for 2016:
(a) accounts receivable turnover
(b) inventory turnover
(c) days’ sales uncollected
(d) days’ sales in inventory
(d) profit margin.
(e) return on total assets.
Dec. 31, Dec. 31, For the
2016 2015 Year 2016
Accounts receivable……………..………................ $ 27,000 $ 24,000
Merchandise inventory…..………..……………....... 25,000 20,000
Total assets…………………………………………..…... 296,000 244,000
Accounts payable…….………..…………................ 26,000 32,000
Salaries payable……………..…............................ 3,000 4,400
Sales (all on credit)…..…..……........................... $312,000
Cost of goods sold…………………………………..…. 165,600
Salaries expense………………………………....…..… 48,000
Other expenses……………………………….…..…..… 75,000
Net income…………………………………………..…... 24,000
192. The following selected financial information for a company was reported for the current
year end. Calculate the following company ratios:
(a) Accounts receivable turnover.
(b) Inventory turnover.
(c) Days’ sales uncollected
Accounts receivable, beginning-year……………. $170,000
Accounts receivable, year-end…………………… 190,000
Merchandise inventory, beginning-year…………. 80,000
Merchandise inventory, year-end………………… 60,000
Cost of goods sold………………………………… 580,000
Credit sales………………………………………… 1,000,000
193. Selected current year end financial information for a company is presented below.
Calculate the following company ratios:
(a) Profit margin.
(b) Total asset turnover.
(c) Return on total assets.
(d) Return on common stockholders’ equity (assume the company has no preferred stock).
Net income……………………………….. $ 325,000
Net sales………………………………….. 4,700,000
Total liabilities, beginning-year………….. 550,000
Total liabilities, end-of-year……………… 530,000
Total stockholders’ equity, beginning-year. 760,000
Total stockholders’ equity, end-of-year….. 745,000
Copyright © 2016 McGraw-Hill Education. All rights reserved. No reproduction or distribution without the prior written consent of
McGraw-Hill Education.
13-107
194. Use the following information from the current year financial statements of a company to
calculate the ratios below:
(a) Current ratio.
(b) Accounts receivable turnover. (Assume the prior year’s accounts receivable balance was
$100,000.)
(c) Days’ sales uncollected.
(d) Inventory turnover. (Assume the prior year’s inventory was $50,200.)
(e) Times interest earned ratio.
(f) Return on common stockholders’ equity. (Assume the prior year’s common stock balance
was $480,000 and the retained earnings balance was $128,000.)
(g) Earnings per share (assuming the corporation has a simple capital structure, with only
common stock outstanding).
(h) Price earnings ratio. (Assume the company’s stock is selling for $26 per share.)
(i) Divided yield ratio. (Assume that the company paid $1.25 per share in cash dividends.)
Copyright © 2016 McGraw-Hill Education. All rights reserved. No reproduction or distribution without the prior written consent of
McGraw-Hill Education.
13-108
Income statement data:
Sales (all on credit) ..…..………………................. $1,075,000
Cost of goods sold.……………............................ 575,000
Gross profit on sales………………….................... $ 500,000
Operating expenses………………………………..…..
305,000
Operating income…..………..….......................... $ 195,000
Interest expense….………..………........................ 20,400
Income before taxes………………………………..…. $ 174,600
Income taxes…………………………………..…..….... 74,000
Net income..………..……………........................... $ 100,600
Balance sheet data:
Cash $ 38,400
Accounts receivable 120,000
Inventory 56,700
Prepaid Expenses 24,000
Total current assets $239,100
Total plant assets 708,900
Total assets $948,000
Accounts payable $ 91,200
Interest payable 4,800
Long-term liabilities 204,000
Total liabilities $300,000
Common stock, $10 par 480,000
Retained earnings 168,000
Total liabilities and equity $948,000
195. Financial information for Sigma Company is presented below. Calculate the following
ratios for 2016:
(a) Inventory turnover.
(b) Accounts receivable turnover.
(c) Return on total assets.
(d) Times interest earned.
(e) Total asset turnover.
2016 2015
Assets:
Cash…………………………………………..…..……..… $ 18,000 $ 22,000
Marketable securities…..……….......................... 25,000 0
Accounts receivable……………..………................ 38,000 42,000
Inventory………………………………………………..... 61,000 52,000
Prepaid insurance…….………..…………................ 6,000 9,000
Long-term investments……………………………….. 49,000 20,000
Plant assets, net……………..……………................. 218,000 225,000
Total assets…………………………………………..…... $415,000 $370,000
Net income…………………………………………..…... $ 62,250
Sales (all on credit)…..…..……........................... 305,000
Cost of goods sold…………………………………..…. 123,000
Interest expense…………………………………………. 15,600
Income tax expense………………………………….... 27,000
196. The following summaries from the income statements and balance sheets of Kouris
Company and Brittania, Inc. are presented below.
(1) For both companies for 2016, compute the:
(a) Current ratio
(b) Acid-test ratio
(c) Accounts receivable turnover
(d) Inventory turnover
(e) Days’ sales in inventory
(f) Days’ sales uncollected
Which company do you consider to be the better short-term credit risk? Explain.
(2) For both companies for 2016, compute the:
(a) Profit margin ratio
(b) Return on total assets
(c) Return on common stockholders’ equity
Which company do you consider to have better profitability ratios?
Copyright © 2016 McGraw-Hill Education. All rights reserved. No reproduction or distribution without the prior written consent of
McGraw-Hill Education.
13-112

Kouris Company Consolidated Balance Sheets
(in millions)
May 31
2016 2015
Assets
Current assets:
Cash and cash equivalents…..…………………..……….................. $ 634.0 $575.5
Accounts receivable, net of allowance….…..……………..…........ 2,101.1 1,804.1
Inventories………………………………………………………………....… 1,514.9 1,373.8
Other current assets………..…………………..………...................... 429.9 401.3
Total current assets……………………..…………......................... 4,679.9 4,154.7
Property, plant, and equipment, net..…..……………....................... 1,620.8 1,614.5
Other long term assets…………………………………………...…..……... 413.2 670.8
Total assets……………………………………………..…..…..…..……... $6,713.9 $6,440.0
Liabilities and Stockholders’ Equity
Current liabilities:
Current portion of long-term debt…………………………………..... $ 205.7 $ 55.3
Notes payable……………………………………………………..…..….... 75.4 425.2
Accounts payable………………………………………………………...… 572.7 504.4
Accrued liabilities……………………………………………………..…... 1,054.2 765.3
Income taxes payable…………………..…………........................... 107.2 83.0
Total current liabilities……………………………………………..….. 2,015.2 1,833.2
Long term liabilities……………………………………….…..…..…..….... 708.0 767.8
Total liabilities………………………………………………………..….. 2,723.2 2,601.0
Stockholders’ equity:
Common stock………………………………………………………………. 2.8 2.8
Contributed capital in excess of par value………...................... 589.0 538.7
Unearned stock compensation….……………..……….................. (0.6) (5.1)
Accumulated other comprehensive loss..……………..…….......... (239.7) (192.4)
Retained earnings………………………………………….…..……..…... 3,639.2 3,495.0
Total stockholders’ equity……………………………………..…..….. 3,990.7 3,839.0
Total liabilities and stockholders’ equity.……………..……….... $6,713.9 $6,440.0
Copyright © 2016 McGraw-Hill Education. All rights reserved. No reproduction or distribution without the prior written consent of
McGraw-Hill Education.
13-113

Kouris Company
Consolidated Statement of Income
May 31, 2016
(in millions)
Revenues……………………………………………………………………. $10,697.0
Cost of sales……………………………………………………….…..….. 6,313.6
Gross profit……………………………………………………..…..…..… 4,383.4
Operating expenses………………………………………….…..…..…. 3,137.6
Operating income……………………………………………………..…. 1,245.8
Interest expense…………………………………………………………… 42.9
Other revenues and expenses……………..………...................... 79.9
Income before tax…..………..…………………............................ 1,123.0
Income taxes………………………………………………….…..…….... 382.9
Income before effect of accounting change.………………........ 740.1
Cumulative effect of accounting change, net of tax.............. 266.1
Net income…………………………………………………………………. $ 474.0
Brittania, Inc.
Consolidated Balance Sheets
Jan. 3, Jan. 4,
2016 2015
Assets
Current assets:
Cash and cash equivalents…..…………………..……….................. $34.5 $22.2
Accounts receivable, net of allowance….…..……………..…........ 15.5 14.7
Inventories………………………………………………………………....… 27.2 28.4
Other current assets……………………………………..……..…..…..… 3.5 4.2
Total current assets……………………..…………......................... 80.7 69.5
Property, plant, and equipment, net..…..……………....................... 5.7 7.0
Other long term assets…………………………………………...…..……... 1.1 1.5
Total assets……………………………………………..…..…..…..……... $87.5 $78.0
Copyright © 2016 McGraw-Hill Education. All rights reserved. No reproduction or distribution without the prior written consent of
McGraw-Hill Education.
13-114

Liabilities and Stockholders’ Equity
Current liabilities:
Accounts payable………………………………………………………...… $ 8.5 $ 6.6
Accrued liabilities……………………………………………………..…... 7.8 5.6
Total current liabilities……………………………………………..….. 16.3 12.2
Long term liabilities……………………………………….…..…..…..….... 2.5 2.6
Total liabilities………………………………………………………..….. 18.8 14.8
Stockholders’ equity:
Common stock………………………………………………………………. 2.3 2.3
Contributed capital in excess of par value………...................... 17.8 17.4
Unearned stock compensation….……………..……….................. (0.1) (0.5)
Accumulated other comprehensive loss..……………..…….......... (0.9) (1.3)
Treasury stock…………………………………………..……..…..…..….. (6.3) (5.4)
Retained earnings………………………………………….…..……..…... 55.9 50.7
Total stockholders’ equity……………………………………..…..….. 68.7 63.2
Total liabilities and stockholders’ equity.……………..……….... $87.5 $78.0
Brittania, Inc.
Consolidated Statement of Income
January 3, 2016
(in millions)
Revenues…………………………………………………………………….
$133.5
Cost of sales……………………………………………………….…..…..
87.3
Gross profit……………………………………………………..…..…..…
46.2
Operating expenses………………………………………….…..…..….
37.3
Operating income……………………………………………………..….
8.9
Interest expense……………………………………………………………
(0.1)
Other revenues and expenses……………..………......................
0.3
Income before tax…..………..…………………............................
9.1
Income taxes………………………………………………….…..……....
3.9
Net income………………………………………………………………….
$ 5.2
Copyright © 2016 McGraw-Hill Education. All rights reserved. No reproduction or distribution without the prior written consent of
McGraw-Hill Education.
13-115
197. _________________ applies analytical tools to general-purpose financial statements and
related data for making business decisions.
198. A common focus of financial statement users in evaluating a company’s performance and
financial condition includes evaluating its (1) __________________, (2) ______________,
and (3) ___________________.
199. General-purpose financial statements include the (1)______________, (2)
_____________, (3) _______________, (4) ______________ and (5) ________________.
200. The four building blocks of financial analysis are (1)_____________, (2) ____________,
(3) ____________ and (4) _________________.
201. The standards for comparisons when interpreting measures from financial statement
analysis include (1) ___________, (2) ____________, (3) _____________, and (4)
_______________.
202. The comparison of a company’s financial condition and performance across time is
known as ____________________.
203. The comparison of a company’s financial condition and performance to a base amount is
known as _________________.
204. The measurement of key relationships between financial statement items is known as
________________.
205. Three of the most common tools of financial analysis are (1) ____________, (2)
__________________, and (3) ______________________.
Copyright © 2016 McGraw-Hill Education. All rights reserved. No reproduction or distribution without the prior written consent of
McGraw-Hill Education.
13-119
206. A good financial statement analysis report usually includes the following six sections: (1)
________________________, (2) ______________________, (3) _________________, (4)
__________________ (5) ____________________, and (6) ______________________.
207. _______________ financial statements are reports where financial amounts are placed
side-by-side in columns on a single statement for analytical purposes.
208. Trend percentage is calculated by dividing _________________________ by
___________________________ and multiplying the result by 100.
Copyright © 2016 McGraw-Hill Education. All rights reserved. No reproduction or distribution without the prior written consent of
McGraw-Hill Education.
13-120
209. ____________ is a method of analysis used to evaluate individual financial statement
items or groups of items in terms of a specific base amount.
210. The current ratio and acid-test ratio are used to reflect the ____________ of a business.
211. The debt ratio, the equity ratio, pledged assets to secured liabilities, and times interest
earned are all ___________________ ratios.
212. The gross margin ratio, return on total assets, and basic earnings per share are all
_____________ ratios.
213. ______________________ ratios include the price-earnings ratio and dividend yield.
214. Ratios may be expressed as (1) ________________, (2) __________________, or (3)
__________________.
215. In order to be classified as an extraordinary gain or loss, the item must be both (1)
_______________ and (2) ____________.
205. The income level most likely to continue into the future and is commonly used in PE
ratios and other market-based measures of performance is the ________________________.