Problem A-7 (continued)
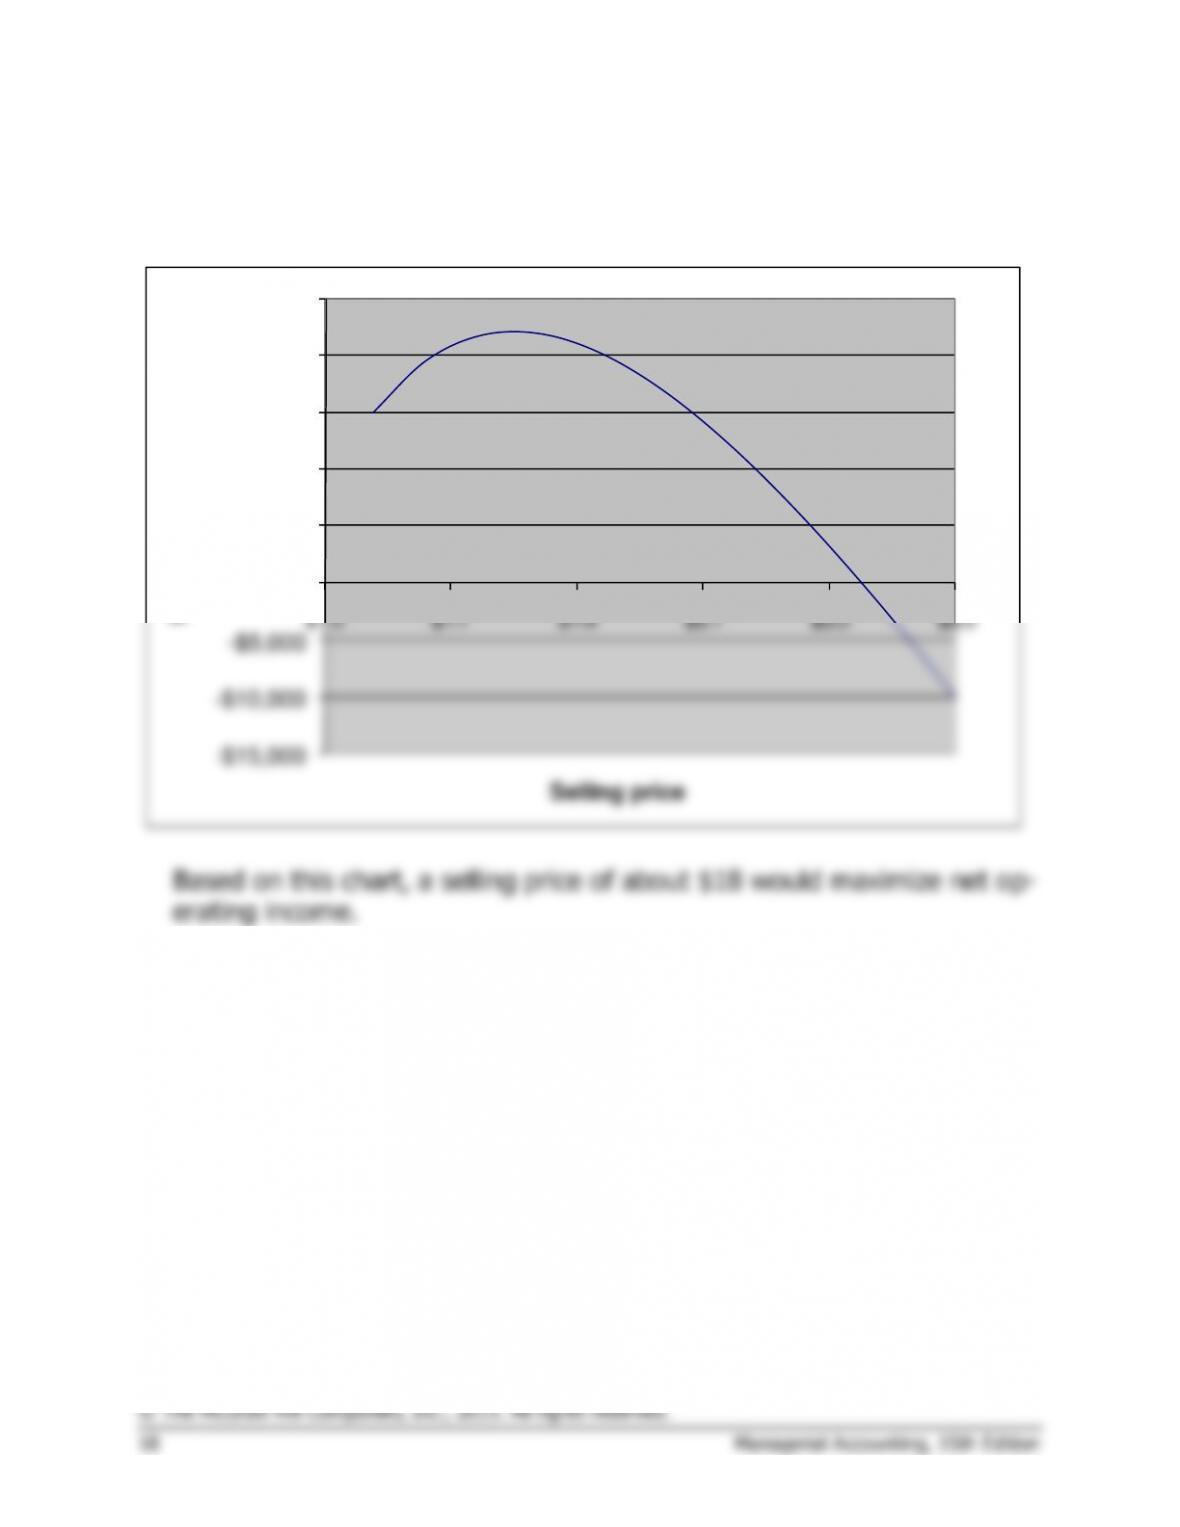
2. A chart based on the above table would look like the following:
–$15,000
–$10,000
–$5,000
$0
$5,000
$10,000
$15,000
$20,000
$25,000
$15 $17 $19 $21 $23 $25
Net operating income
Selling price
Problem A-7 (continued)
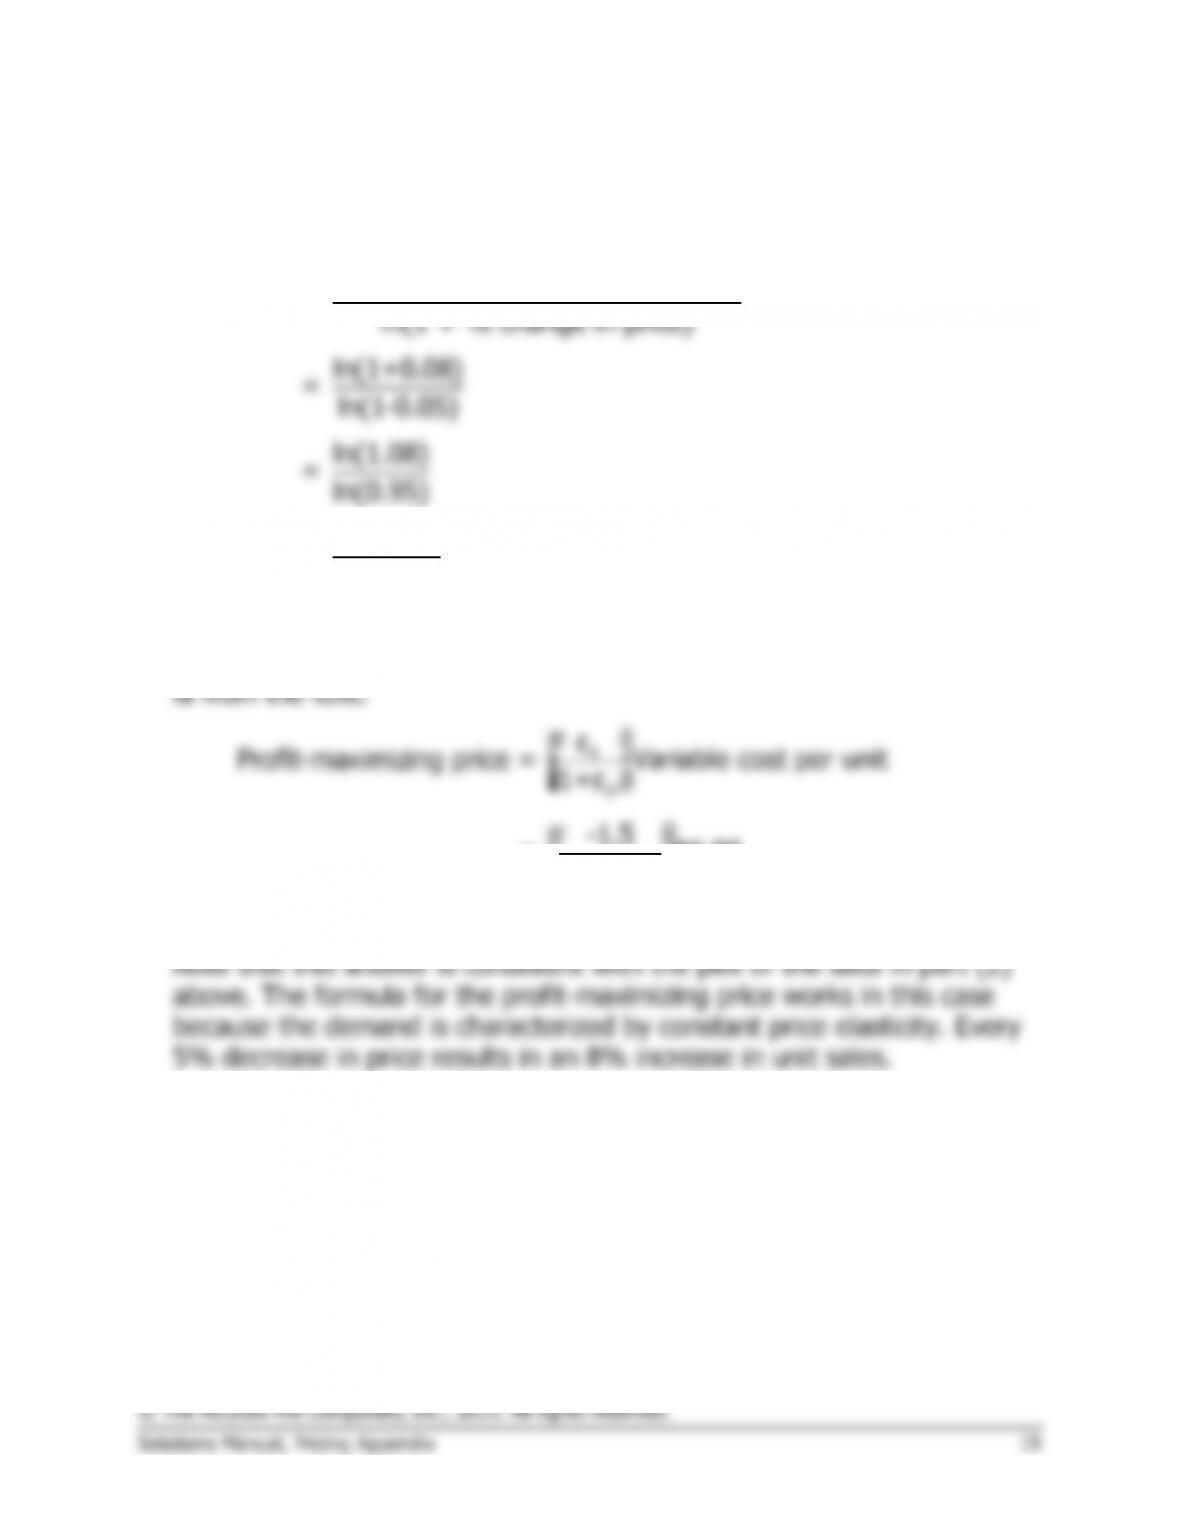
3. The price elasticity of demand, as defined in the text, is computed as
follows:
d =
ln(1 + % change in quantity sold)
ln(1 + % change in price)
ln(1+0.08)
ln(0.95)
=
0.07696
-0.05129
= -1.500
The profit-maximizing price can be estimated using the following formu-
d
1+ε
ç÷
ç
èø
=
-1.5 $6.00
1+(-1.5)
æö
÷
ç÷
ç÷
÷
ç
ç
èø
= 3.00 × $6.00 = $18.00
Problem A-7 (continued)
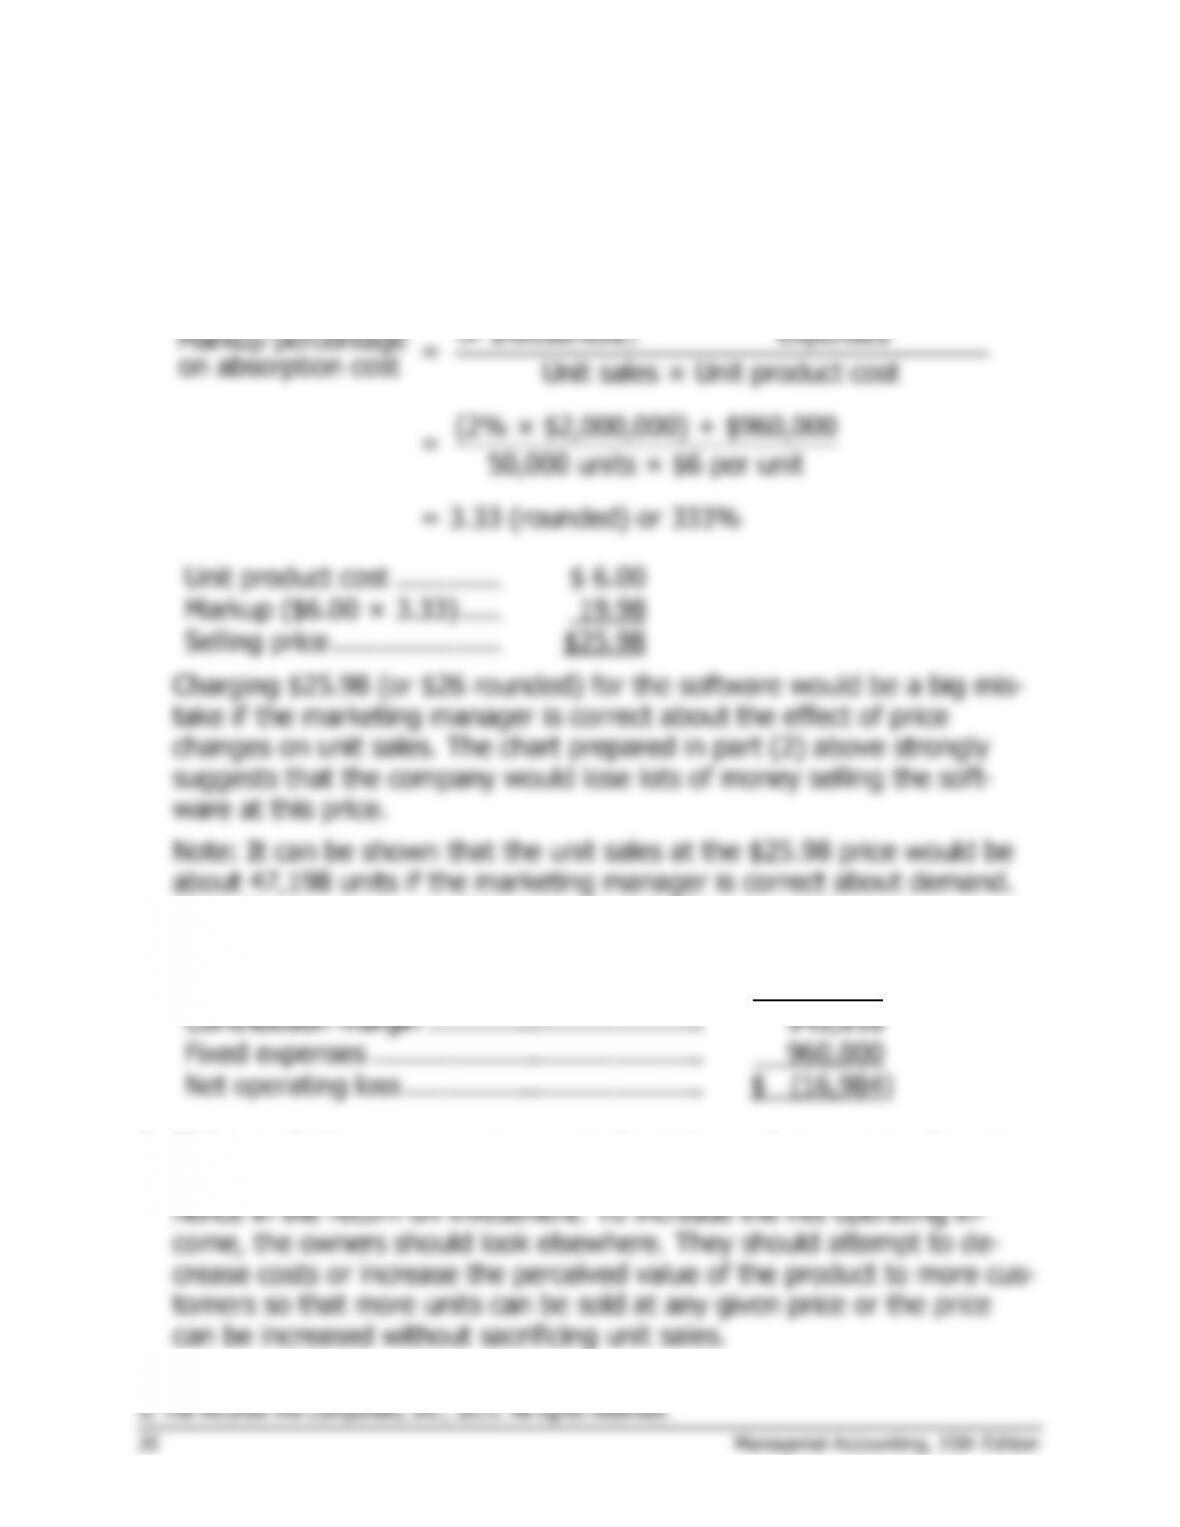
4. We must first compute the markup percentage, which is a function of
the required ROI of 2%, the investment of $2,000,000, the unit product
cost of $6, and the SG&A expenses of $960,000.
( )
Required ROI Selling and administrative
+
× Investment expenses
Markup percentage =
on absorption cost Unit sales × Unit product cost
(2% × $2,000,000) + $960,000
= 50,000 units × $6 per unit
= 3.33 (rounded) or 333%
Unit product cost ………….
$ 6.00
Markup ($6.00 × 3.33) …..
19.98
Selling price …………………
$25.98
Charging $25.98 (or $26 rounded) for the software would be a big mis-
take if the marketing manager is correct about the effect of price
changes on unit sales. The chart prepared in part (2) above strongly
suggests that the company would lose lots of money selling the soft-
ware at this price.
Note: It can be shown that the unit sales at the $25.98 price would be
about 47,198 units if the marketing manager is correct about demand.
If so, the company would lose about $16,984 per month:
Sales (47,198 units × $25.98 per unit) …….
$1,226,204
Variable cost (47,198 units × $6 per unit) ..
283,188
Contribution margin …………………………….
943,016
Fixed expenses …………………………………..
960,000
Net operating loss ……………………………….
$ (16,984)
5. If the marketing manager is correct about demand, increasing the price
above $18 per unit will result in a decrease in net operating income and
Problem A-8 (45 minutes)
1.
Projected sales (100 machines × $4,950 per machine) ..
$495,000
Less desired profit (15% × $600,000) ……………………..
90,000
Target cost for 100 machines …………………………………
$405,000
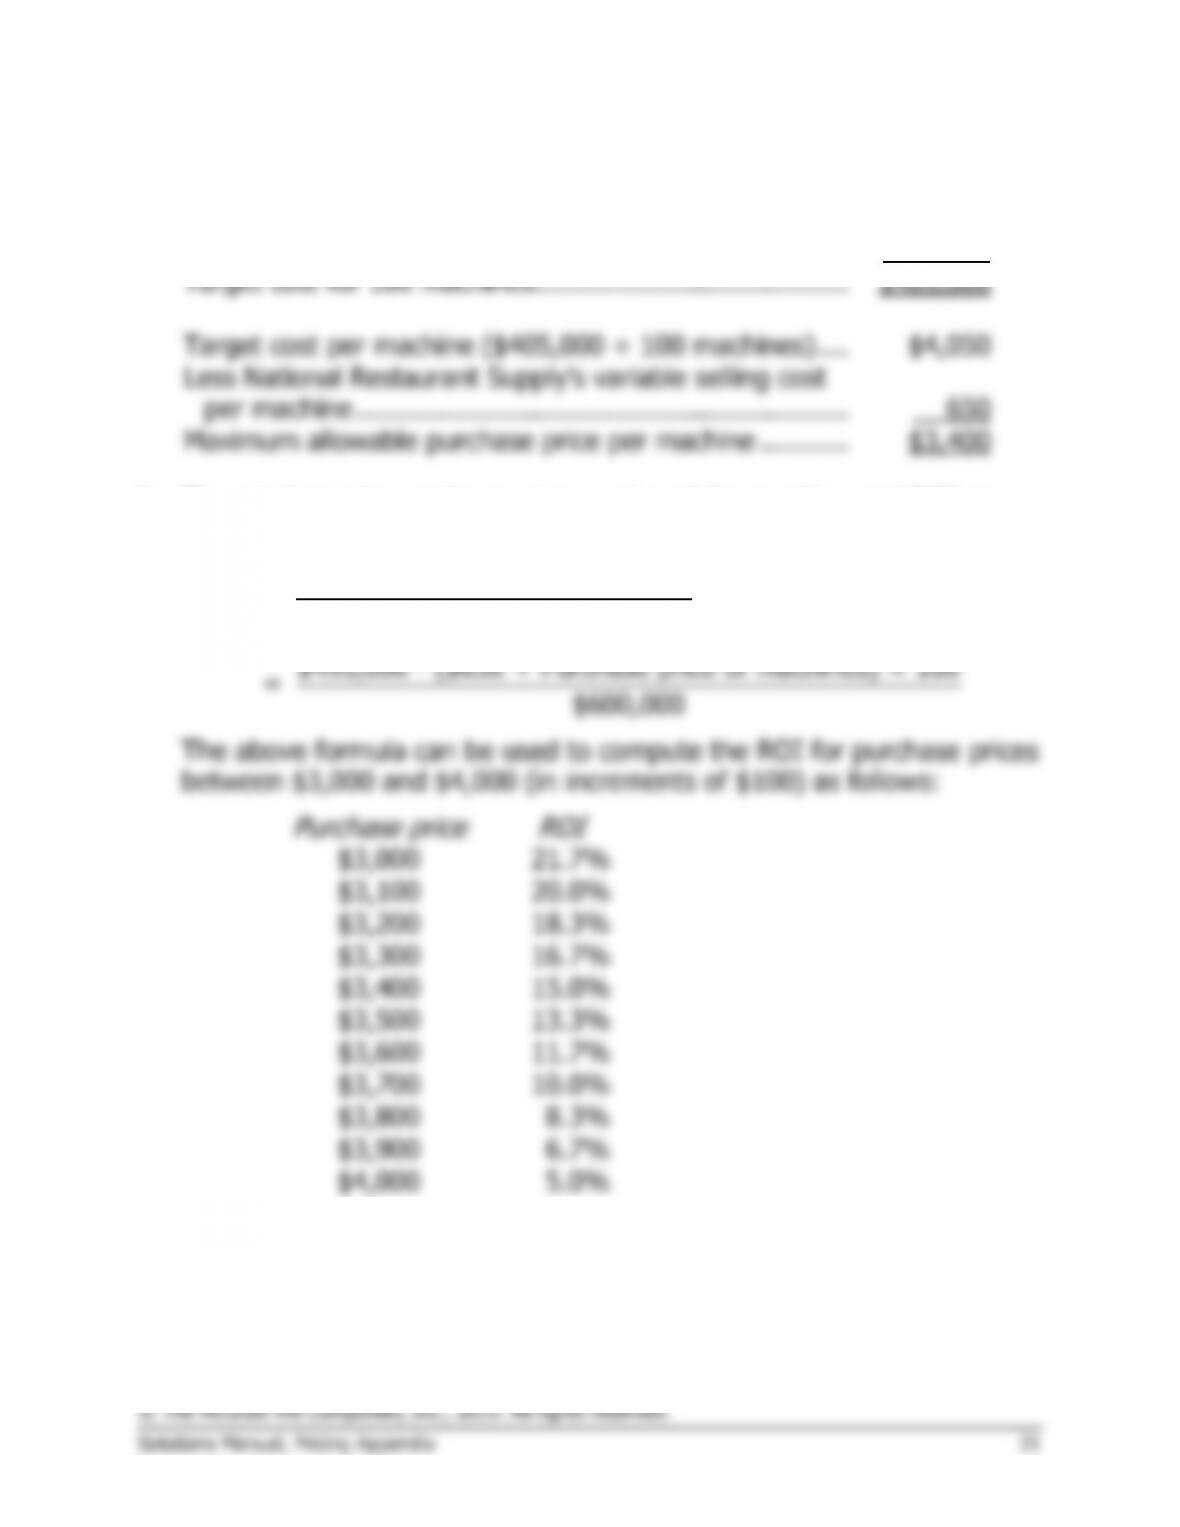
Target cost per machine ($405,000 ÷ 100 machines) ….
$4,050
Less National Restaurant Supply’s variable selling cost
per machine …………………………………………………….
650
Maximum allowable purchase price per machine ………..
$3,400
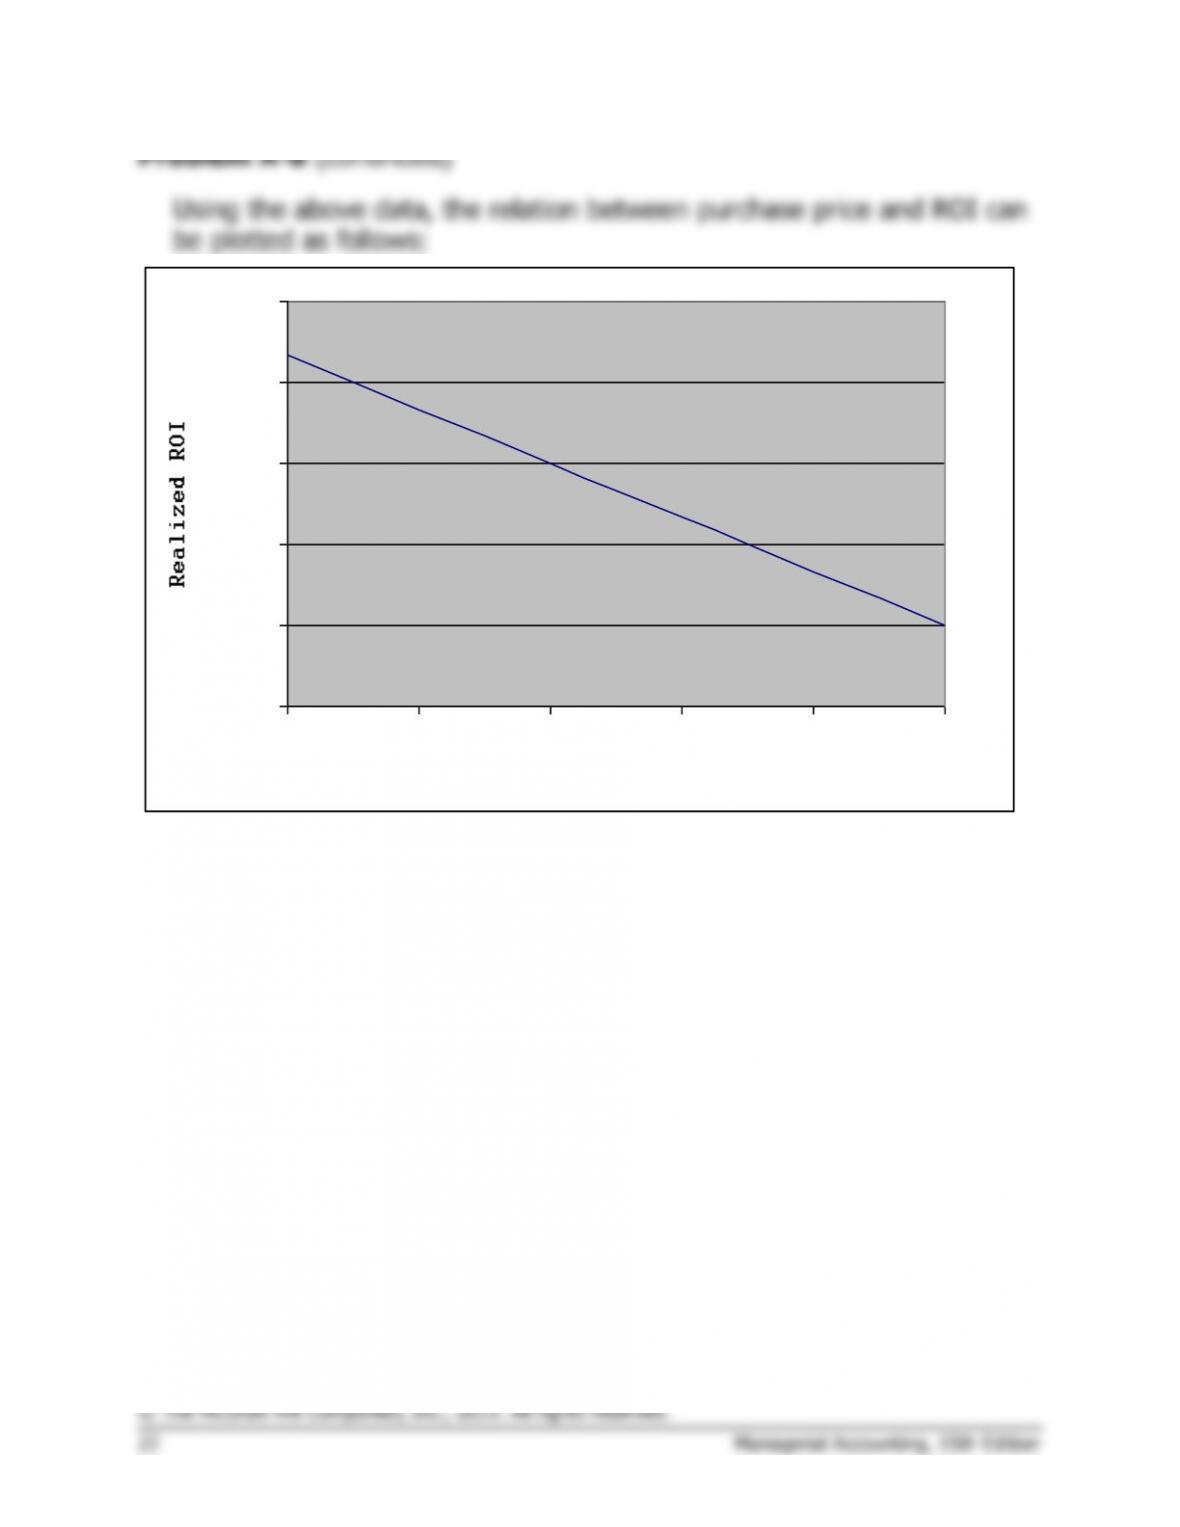
2. The relation between the purchase price of the machine and ROI can
be developed as follows:
Total projected sales – Total cost
ROI = Investment
$495,000 – ($650 + Purchase price of machines) × 100
= $600,000
21.7%
16.7%
15.0%
13.3%
© The McGraw-Hill Companies, Inc., 2015. All rights reserved.
22 Managerial Accounting, 15th Edition
Problem A-8 (continued)
Using the above data, the relation between purchase price and ROI can
be plotted as follows:
0.0%
5.0%
10.0%
15.0%
20.0%
25.0%
$3,000 $3,200 $3,400 $3,600 $3,800 $4,000
Purchase price
Problem A-8 (continued)
3. A number of options are available in addition to simply giving up on
adding the new sorbet machines to the company’s product lines. These
options include:
• Check the projected unit sales figures. Perhaps more units could be