Chapter 09 – Quality Control and Improvement
9-1
Chapter 9 Quality Control and Improvement Answer Key
Multiple-Choice Questions
1. A complete system of quality control
2. Sampling inspection by attributes
3. Which of the following statements about process quality control is NOT true?
Chapter 09 – Quality Control and Improvement
7. Which of the following statements about process capability is accurate?
8. Suppose that a process is in a state of control and we have the following information for a
human weights measurement study:
Average weight of males in the study = 150 lbs.
Average range of the male weights = 100 lbs.
A2 = .577
D3 = 0
D4 = 2.115
What is the upper control limit for the average (mean) chart?
9. Using the information from Question 8, what is the upper control limit for the range chart?
9-4
10. Suppose that you have taken 30 samples of 200 units each and calculated the proportion
defective as p = .075. What is the upper control limit for a p-chart?
11. Using the same data as in Question 10, what is the lower control limit for a p-chart?
12. Of the four choices below, which is the earliest step in designing a quality control
system?
Chapter 09 – Quality Control and Improvement
9-5
13. The appearance of a restaurant meal that is not satisfactory is an example of
14. Which of the following is/are assumption(s) of process control?
15. Which of the following quality control sample statistics indicates a quality characteristic
that is an attribute?
9-6
16. For which of the following would a p-chart be used?
17. Which of the following techniques are used for continuous improvement?
18. The ability of the process to meet, or exceed, its specifications can be determined by
Chapter 09 – Quality Control and Improvement
9-7
19. Which of the following statements is NOT true about six sigma quality?
20. The chair of the Quality Department at Motorola University wants to construct a p-chart
for determining whether the four faculty members teaching the course are in a state of control
concerning the number of students who fail in the course. Accordingly, the chair sampled 500
final grades from last year for each instructor, and computed the number of failures per
instructor as 13, 11, 0, and 16 respectively. Compute the upper and lower standard control
limits for this chart.
9-8
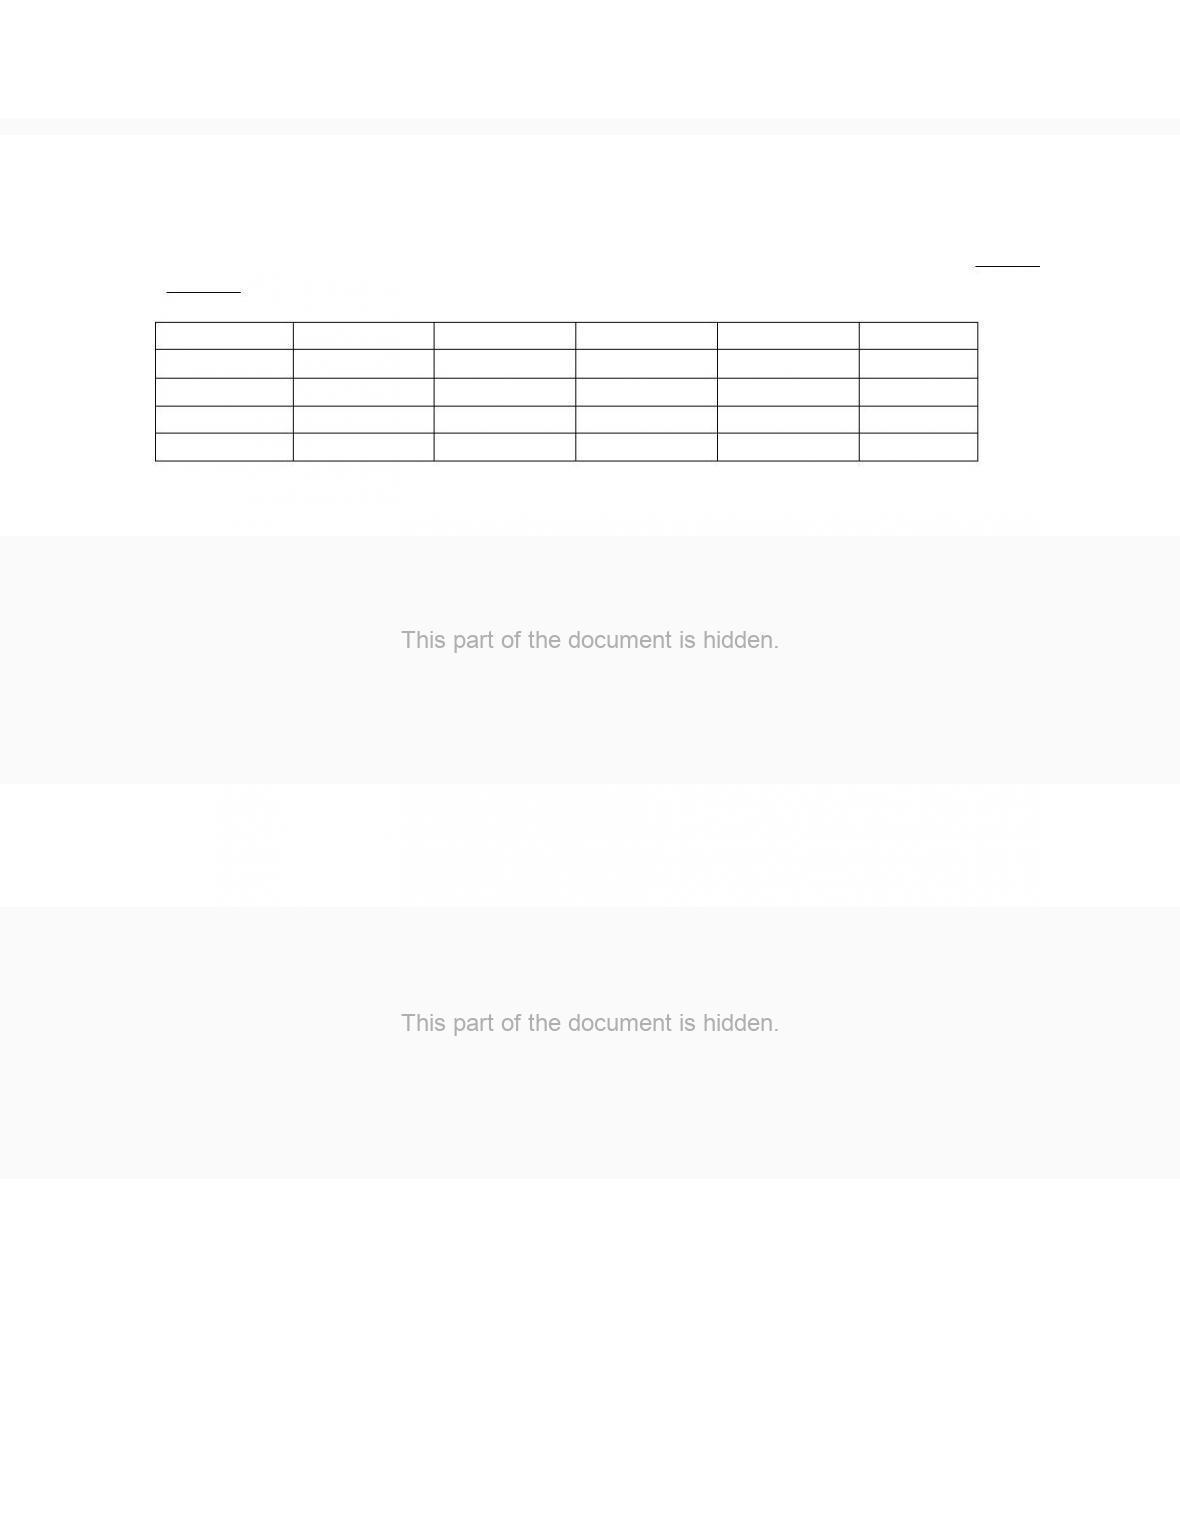
21. A process for filling liquid laundry detergent bottles monitors the volume in each bottle.
The operations manager has taken 5 samples with 4 observations (bottles) in each sample to
determine if the variation in volume is reasonable. The measurement unit is fluid ounces.
Calculate the center line for a process control chart that indicates whether the variation within
samples is reasonable (in a state of control).
Bottle
Sample 1
Sample 2
Sample 3
Sample 4
Sample 5
1
11.8
12.0
11.8
11.9
10.7
2
12.1
12.0
11.8
12.0
11.2
3
12.0
11.9
11.9
11.8
11.9
4
12.2
11.8
11.7
11.9
11.7
22. A machining process is capable of producing a component with an average specification
of 5 inches and a process standard deviation of 0.1 inch. Supposing the customer accepts the
component as long as it falls between 4.8 inches and 5.2 inches, then the process capability is
9-9
23. Which of the following is a critical inspection point where inspection and testing of
products occur in a quality control system?
24. Generally, two types of data may be collected from sampling at an inspection point.
These two types of data are
25. Regarding the design of a quality control system, which of the following statements is
correct?
9-10
26. While monitoring a production process that is in a state of statistical control, a control
chart that uses a large confidence interval compared to one that uses a small confidence
interval will
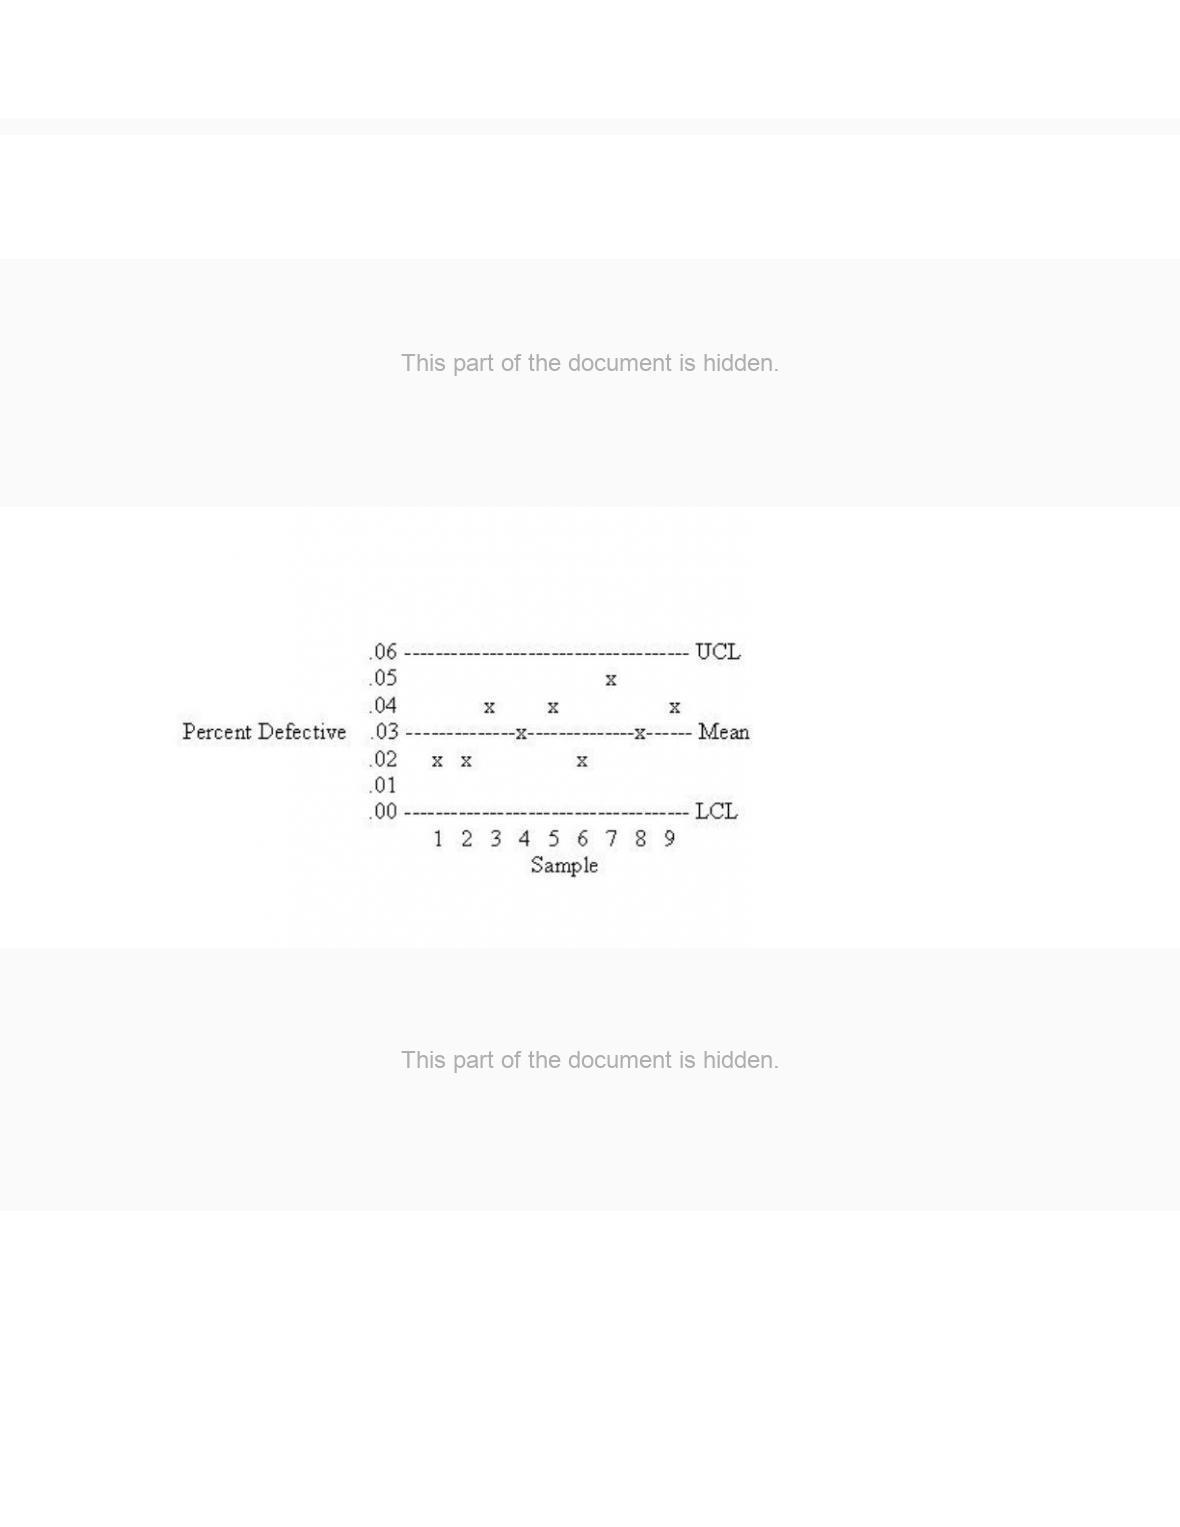
27. The figure shown below represents a control chart determined from attribute data. Given
this chart and the plotted observations, the most appropriate action would be