Chapter 05 Cost Behavior Answer Key
True / False Questions
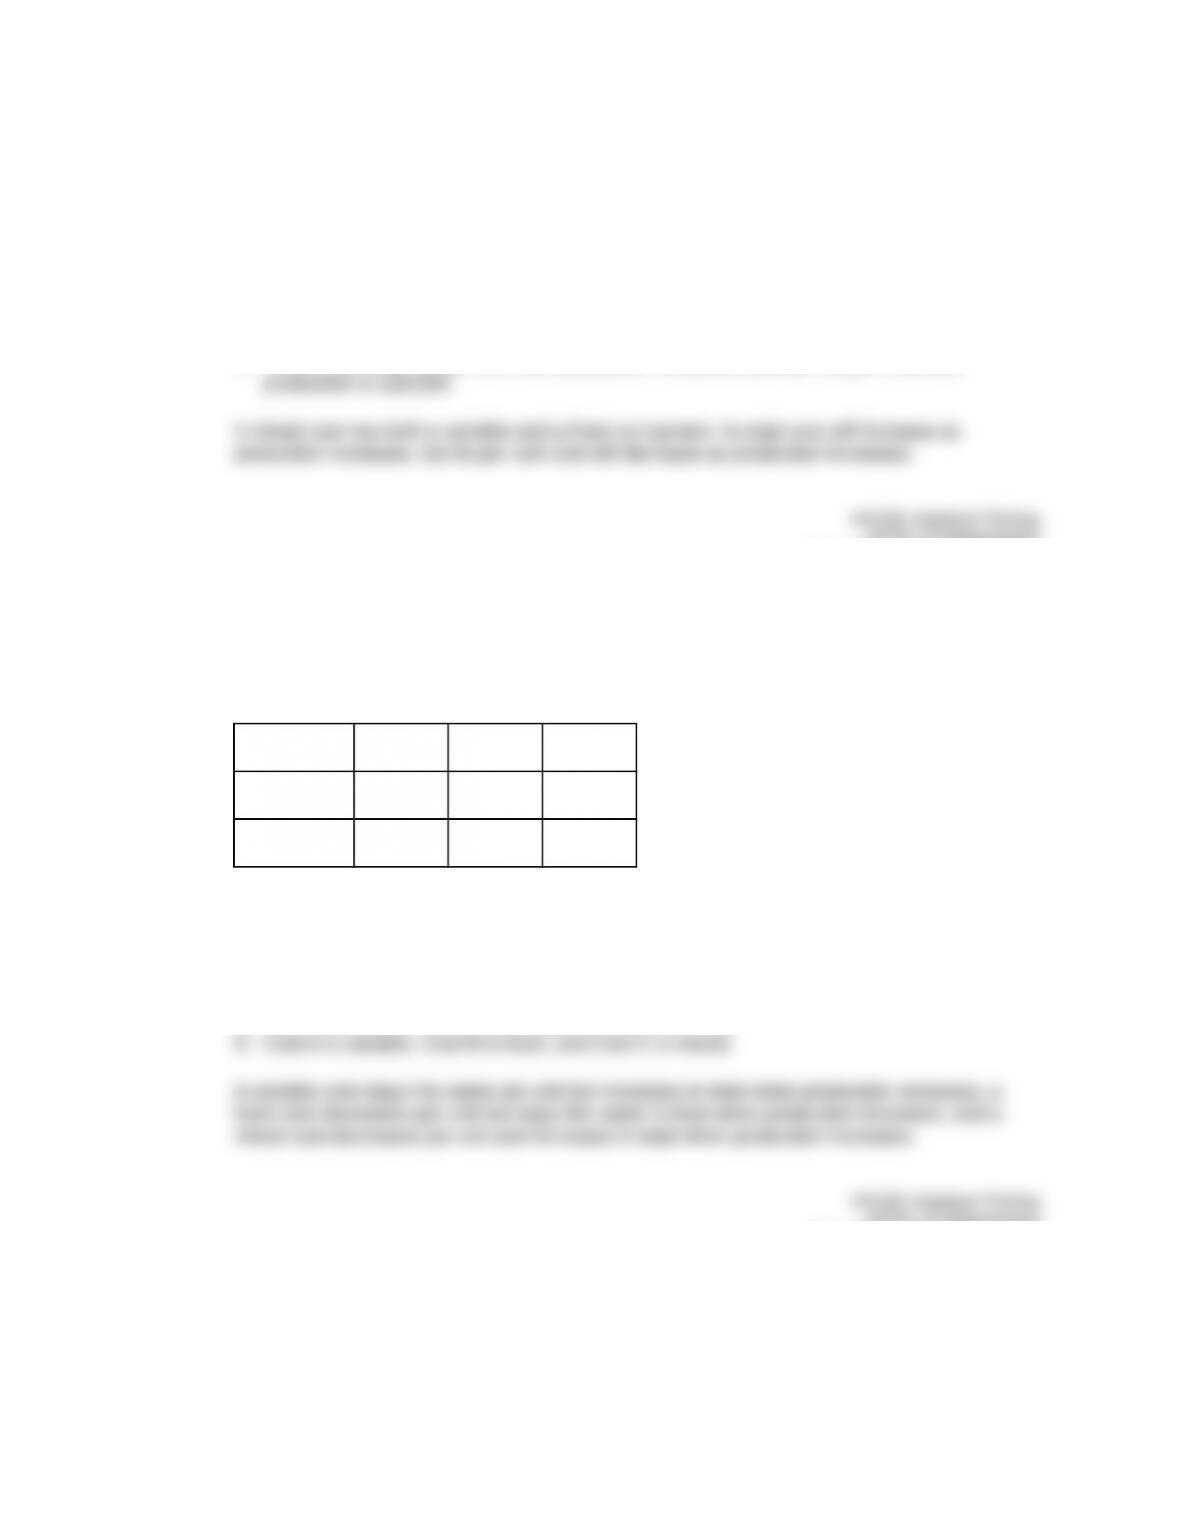
1. A variable cost increases in total as the volume increases.
AICPA: FN Measurement
Accessibility: Keyboard Navigation
Blooms: Remember
Difficulty: 1 Easy
Learning Objective: 05-01 Identify costs as variable, fixed, step, or mixed.
Topic: Variable costs
2. A fixed cost will stay constant on a per unit basis as the volume increases.
AICPA: FN Measurement
Accessibility: Keyboard Navigation
Blooms: Remember
Difficulty: 1 Easy
Learning Objective: 05-01 Identify costs as variable, fixed, step, or mixed.
Topic: Fixed costs
3. Step costs are fixed over some range of activity and then increase like a variable cost.
AICPA: BB Critical Thinking
Accessibility: Keyboard Navigation
Blooms: Understand
Difficulty: 2 Medium
Learning Objective: 05-01 Identify costs as variable, fixed, step, or mixed.
Topic: Step costs
5-1
Copyright © 2017 McGraw-Hill Education. All rights reserved. No reproduction or distribution without the prior written consent of
McGraw-Hill Education.
4. A scattergraph is useful in recognizing unusual patterns in the cost data.
AICPA: FN Measurement
Accessibility: Keyboard Navigation
Blooms: Remember
Difficulty: 1 Easy
Learning Objective: 05-02 Prepare a scattergraph to illustrate the relationship between total cost and activity.
Topic: Scattergraph
5. The high-low method requires three observations of costs to calculate the cost formula.
AICPA: FN Measurement
Accessibility: Keyboard Navigation
Blooms: Remember
Difficulty: 1 Easy
Learning Objective: 05-03 Use the high-low method to analyze mixed costs.
Topic: High-low method
6. The least-squares regression method uses all of the available data to find the best fitting line.
AICPA: FN Measurement
Accessibility: Keyboard Navigation
Blooms: Remember
Difficulty: 1 Easy
Learning Objective: 05-04 Use least-squares regression to analyze mixed costs.
Topic: Least-squares regression method
7. R-square tells managers how much of the variability in activity is caused by variability in cost.
AICPA: FN Measurement
Accessibility: Keyboard Navigation
Blooms: Remember
5-2
Copyright © 2017 McGraw-Hill Education. All rights reserved. No reproduction or distribution without the prior written consent of
McGraw-Hill Education.
Difficulty: 1 Easy
Learning Objective: 05-04 Use least-squares regression to analyze mixed costs.
Topic: Least-squares regression method
8. Contribution margin is defined as sales revenue less variable costs.
AICPA: FN Measurement
Accessibility: Keyboard Navigation
Blooms: Remember
Difficulty: 1 Easy
Learning Objective: 05-05 Prepare and interpret a contribution margin income statement.
Topic: Contribution margin approach
9. The contribution margin income statement is appropriate for external users.
AICPA: BB Critical Thinking
Accessibility: Keyboard Navigation
Blooms: Remember
Difficulty: 1 Easy
Learning Objective: 05-05 Prepare and interpret a contribution margin income statement.
Topic: Contribution margin approach
10. Contribution margin plus variable cost per unit equals total sales revenue.
AICPA: FN Measurement
Accessibility: Keyboard Navigation
Blooms: Understand
Difficulty: 2 Medium
Learning Objective: 05-05 Prepare and interpret a contribution margin income statement.
Topic: Contribution margin approach
5-3
Copyright © 2017 McGraw-Hill Education. All rights reserved. No reproduction or distribution without the prior written consent of
McGraw-Hill Education.
11. The unit contribution margin tells how much each additional unit sold will contribute to covering
variable costs.
AICPA: FN Measurement
Accessibility: Keyboard Navigation
Blooms: Remember
Difficulty: 1 Easy
Learning Objective: 05-05 Prepare and interpret a contribution margin income statement.
Topic: Unit contribution margin
12. The contribution margin ratio is calculated as total contribution margin divided by total sales
revenue.
AICPA: FN Measurement
Accessibility: Keyboard Navigation
Blooms: Remember
Difficulty: 1 Easy
Learning Objective: 05-05 Prepare and interpret a contribution margin income statement.
Topic: Contribution margin ratio
13. Variable costing uses a contribution margin income statement.
AICPA: BB Critical Thinking
Accessibility: Keyboard Navigation
Blooms: Remember
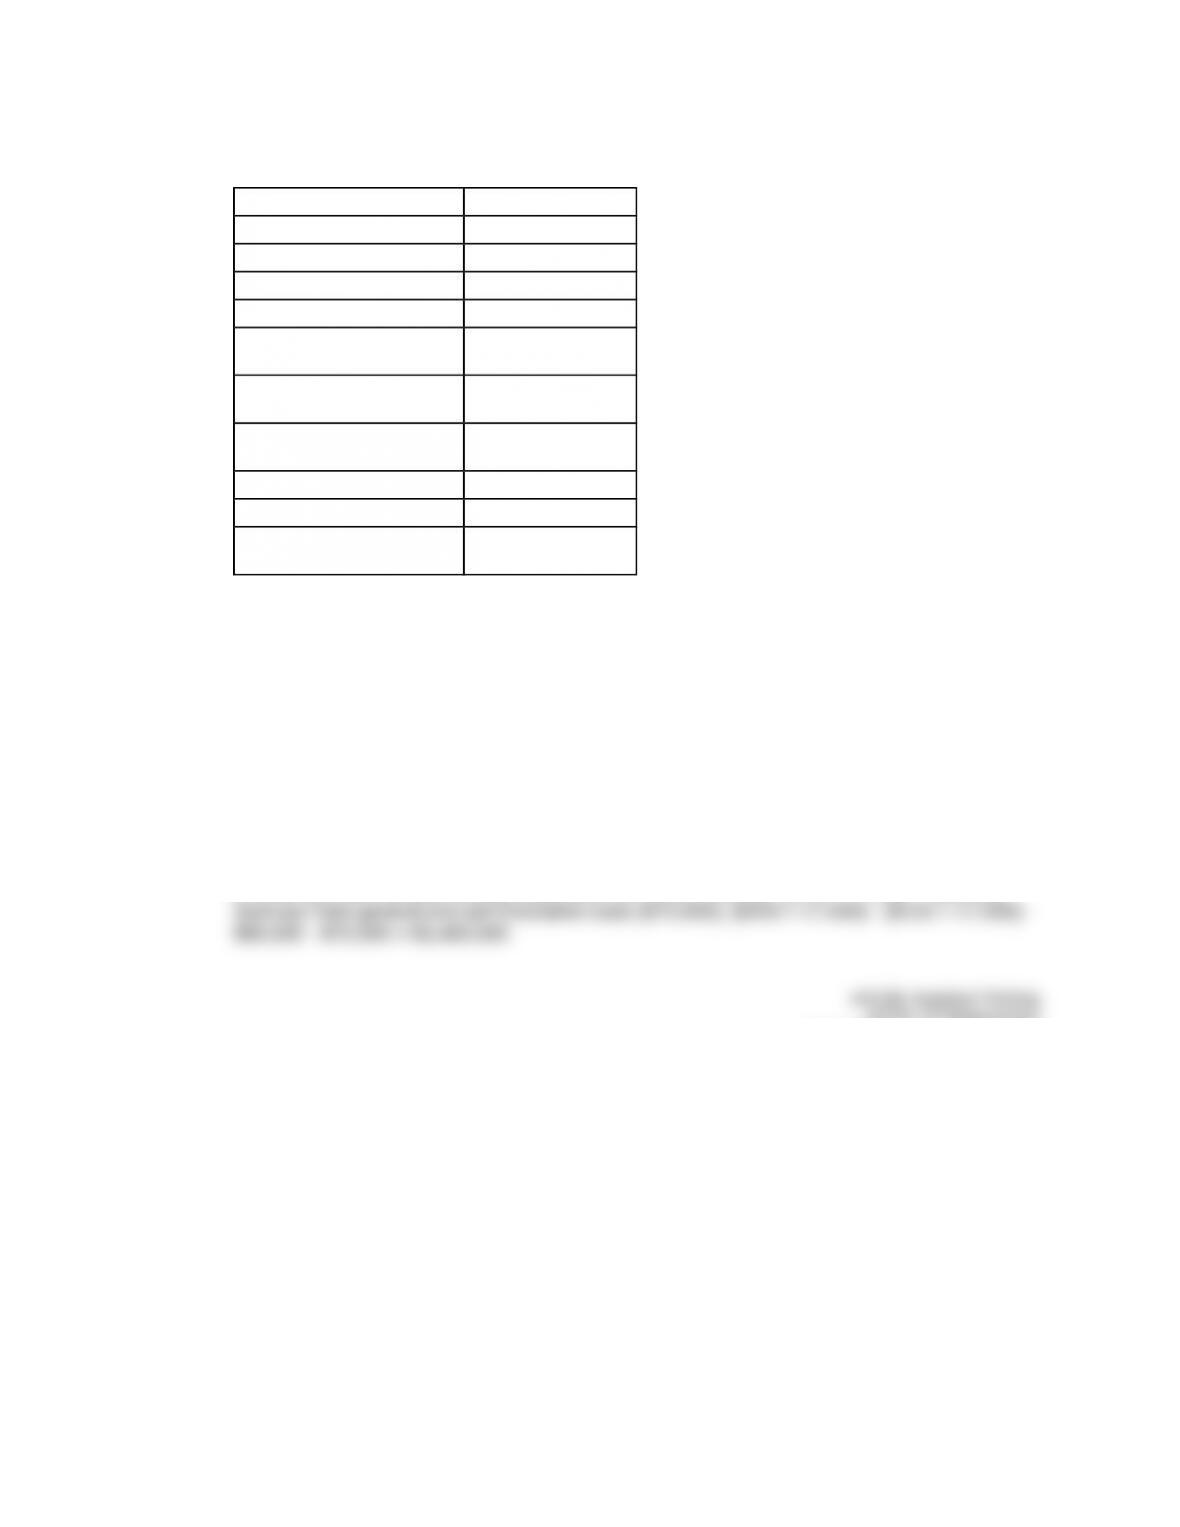
Difficulty: 1 Easy
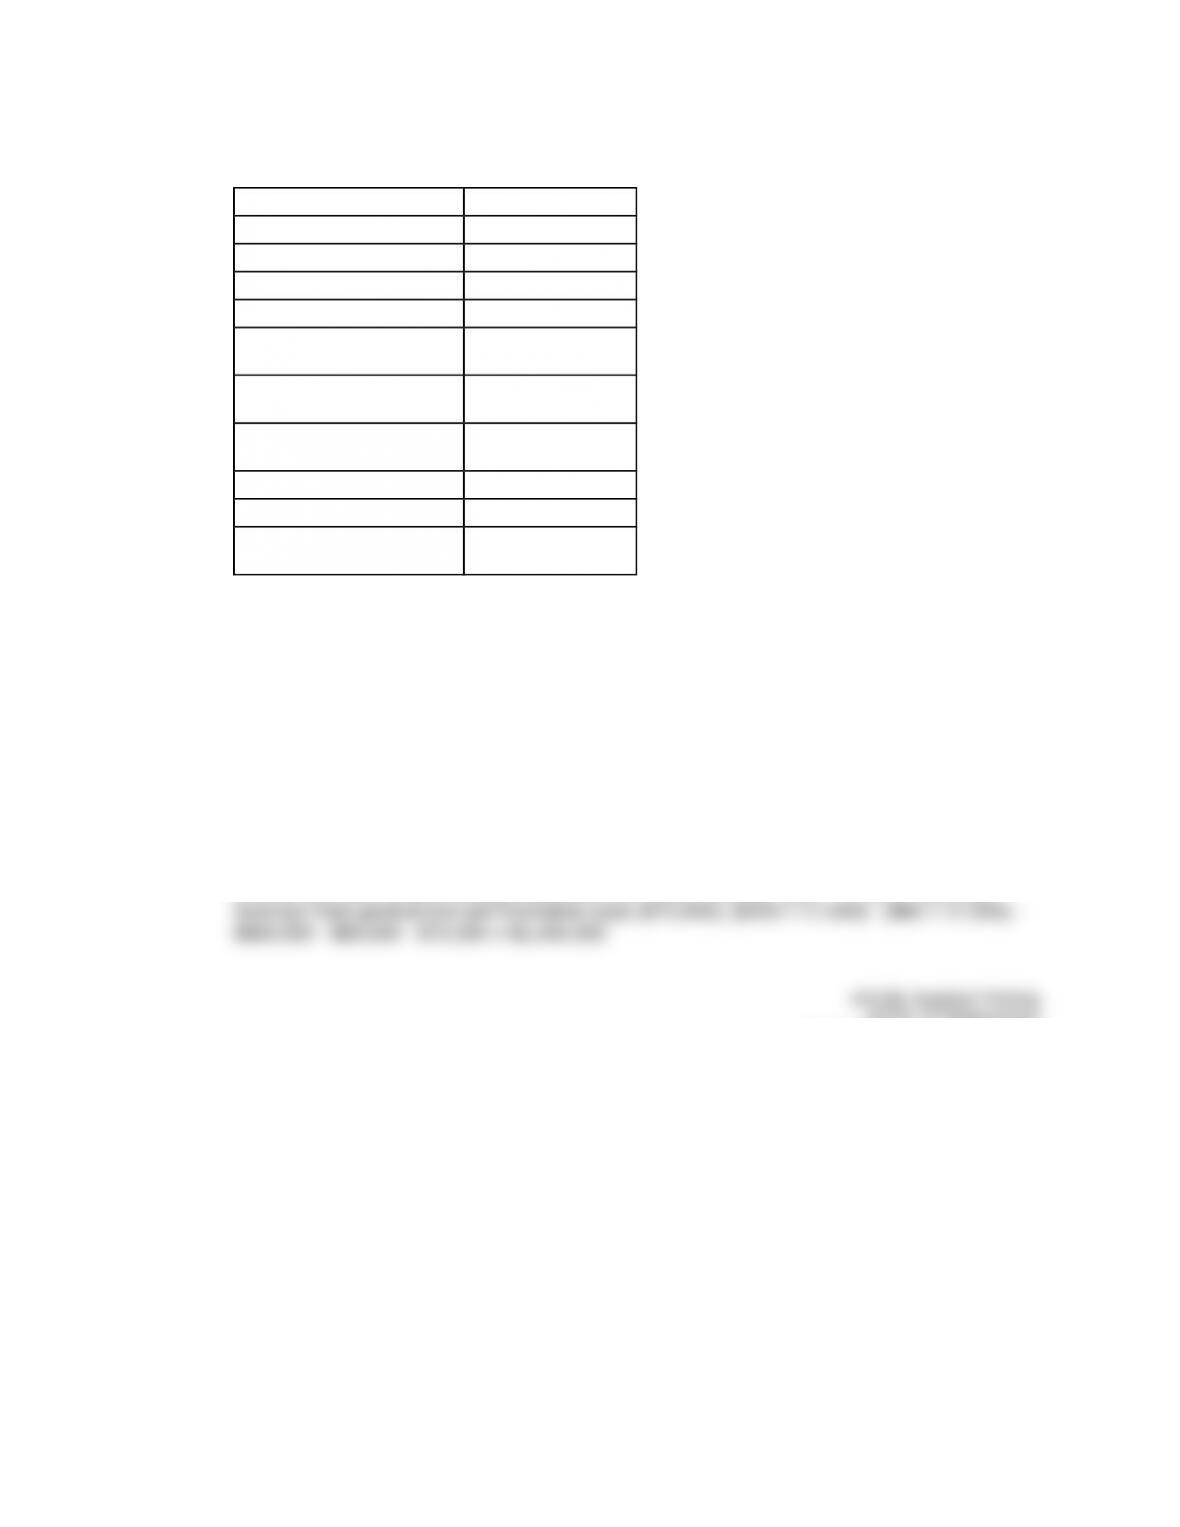
Learning Objective: 05-S1 Compare variable costing to full absorption costing.
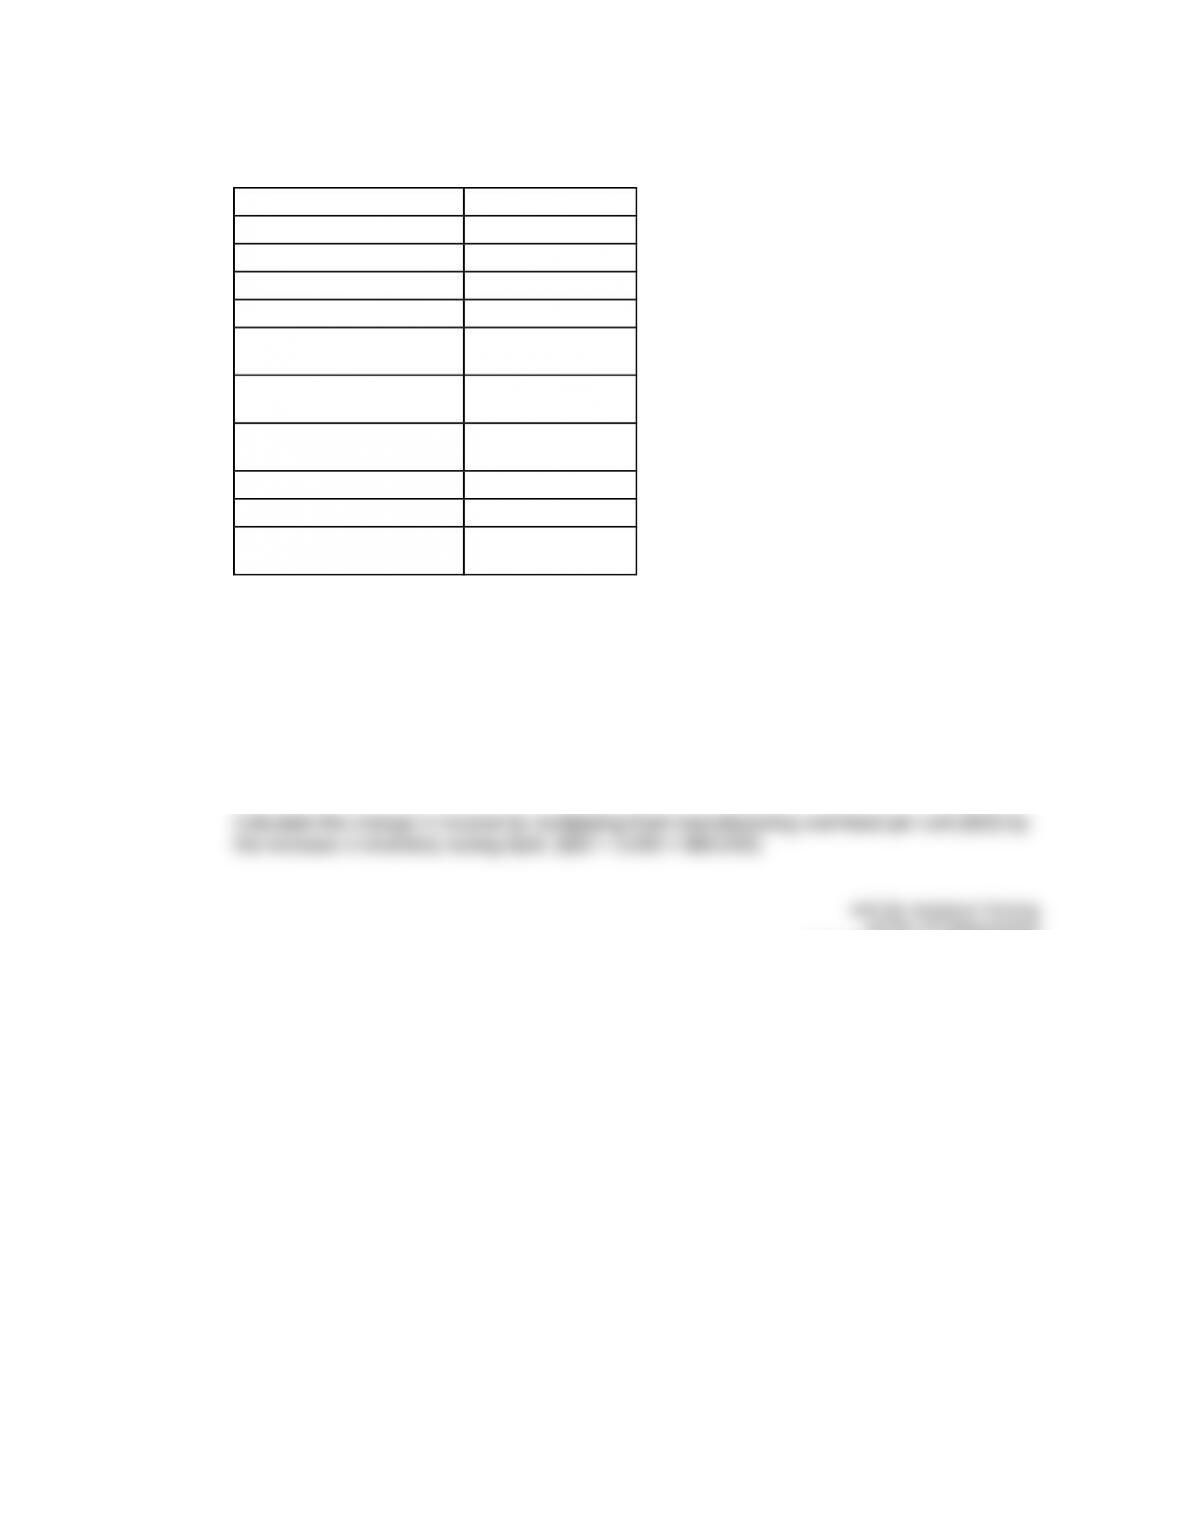
Topic: Variable versus full absorption costing
14. Firms may choose to use absorption costing or variable costing for external financial reporting
purposes.
5-4
Copyright © 2017 McGraw-Hill Education. All rights reserved. No reproduction or distribution without the prior written consent of
McGraw-Hill Education.
AICPA: BB Critical Thinking
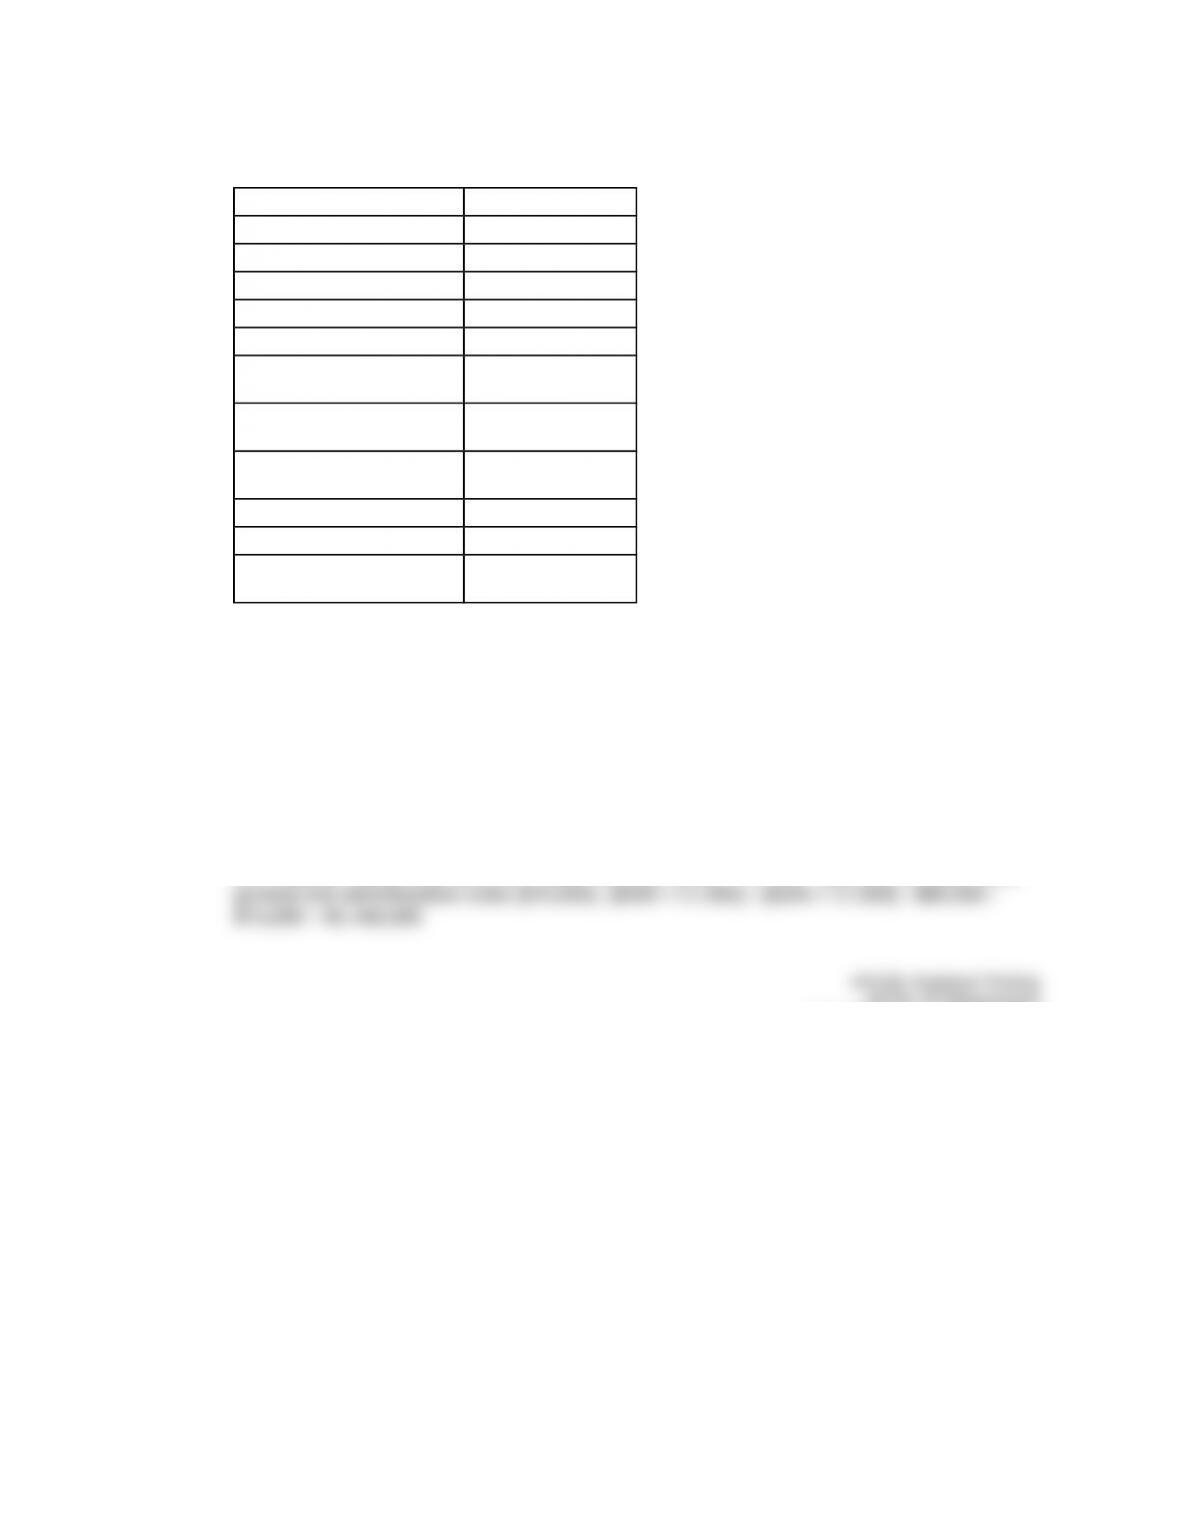
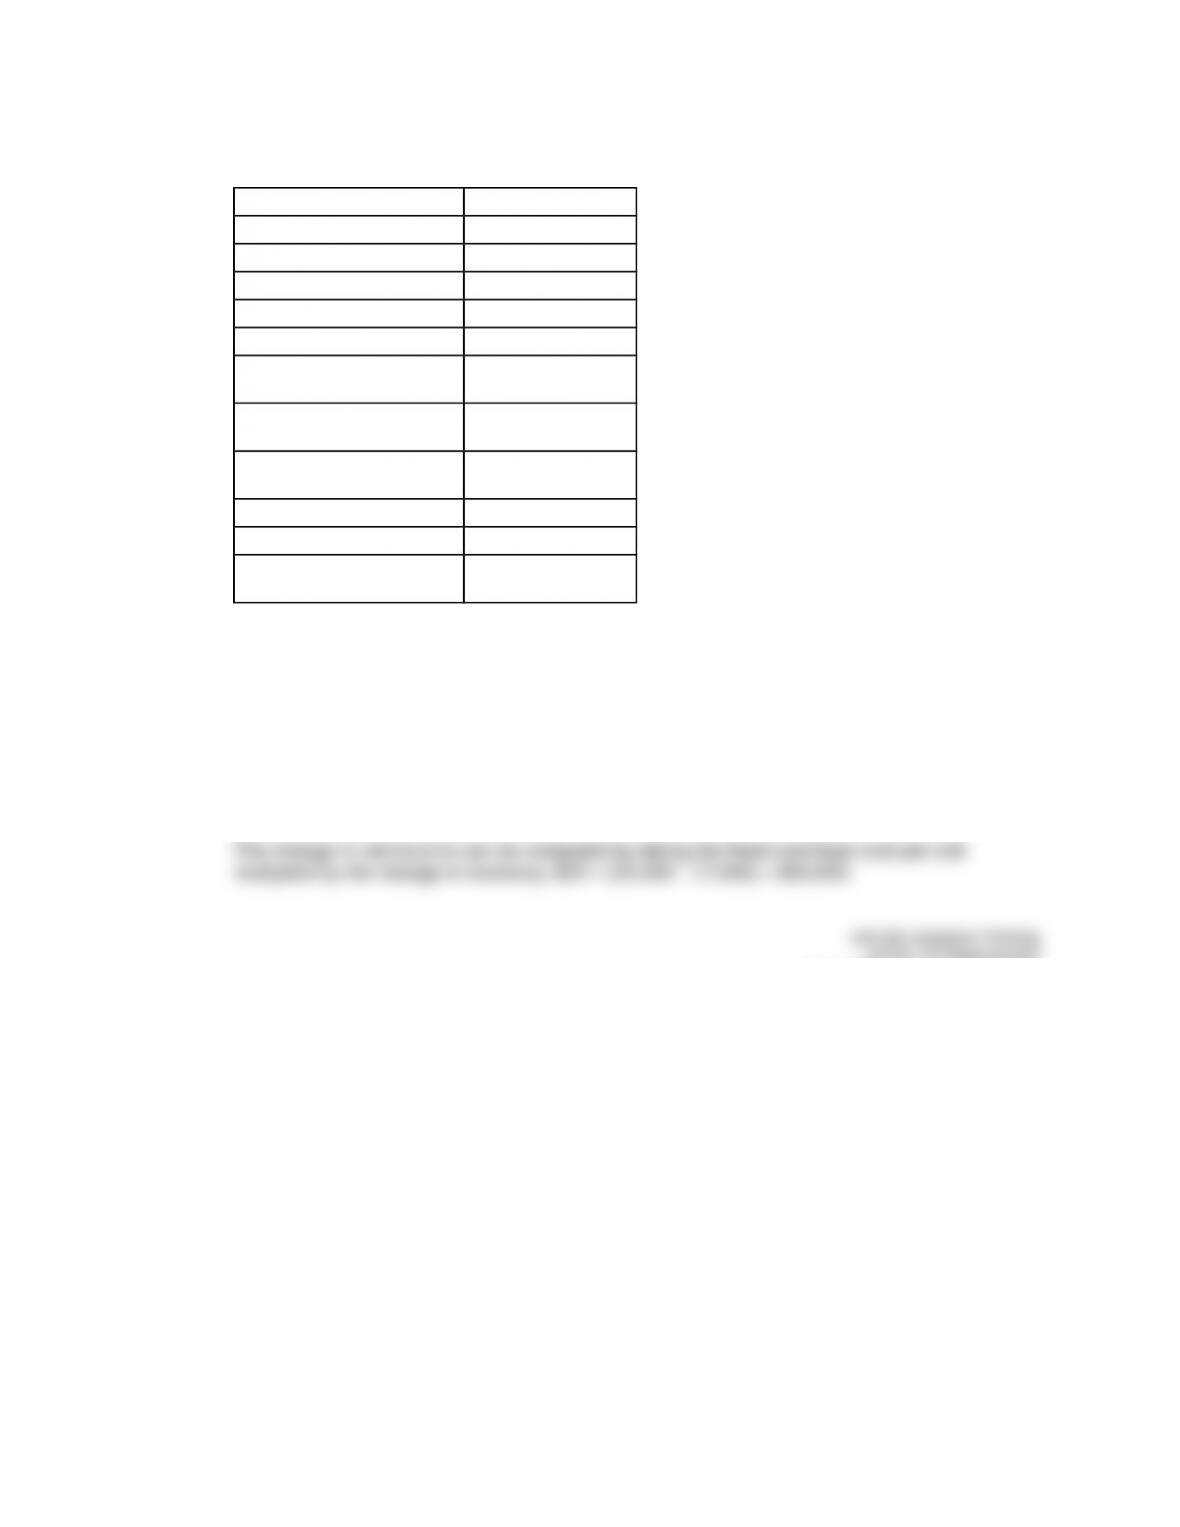
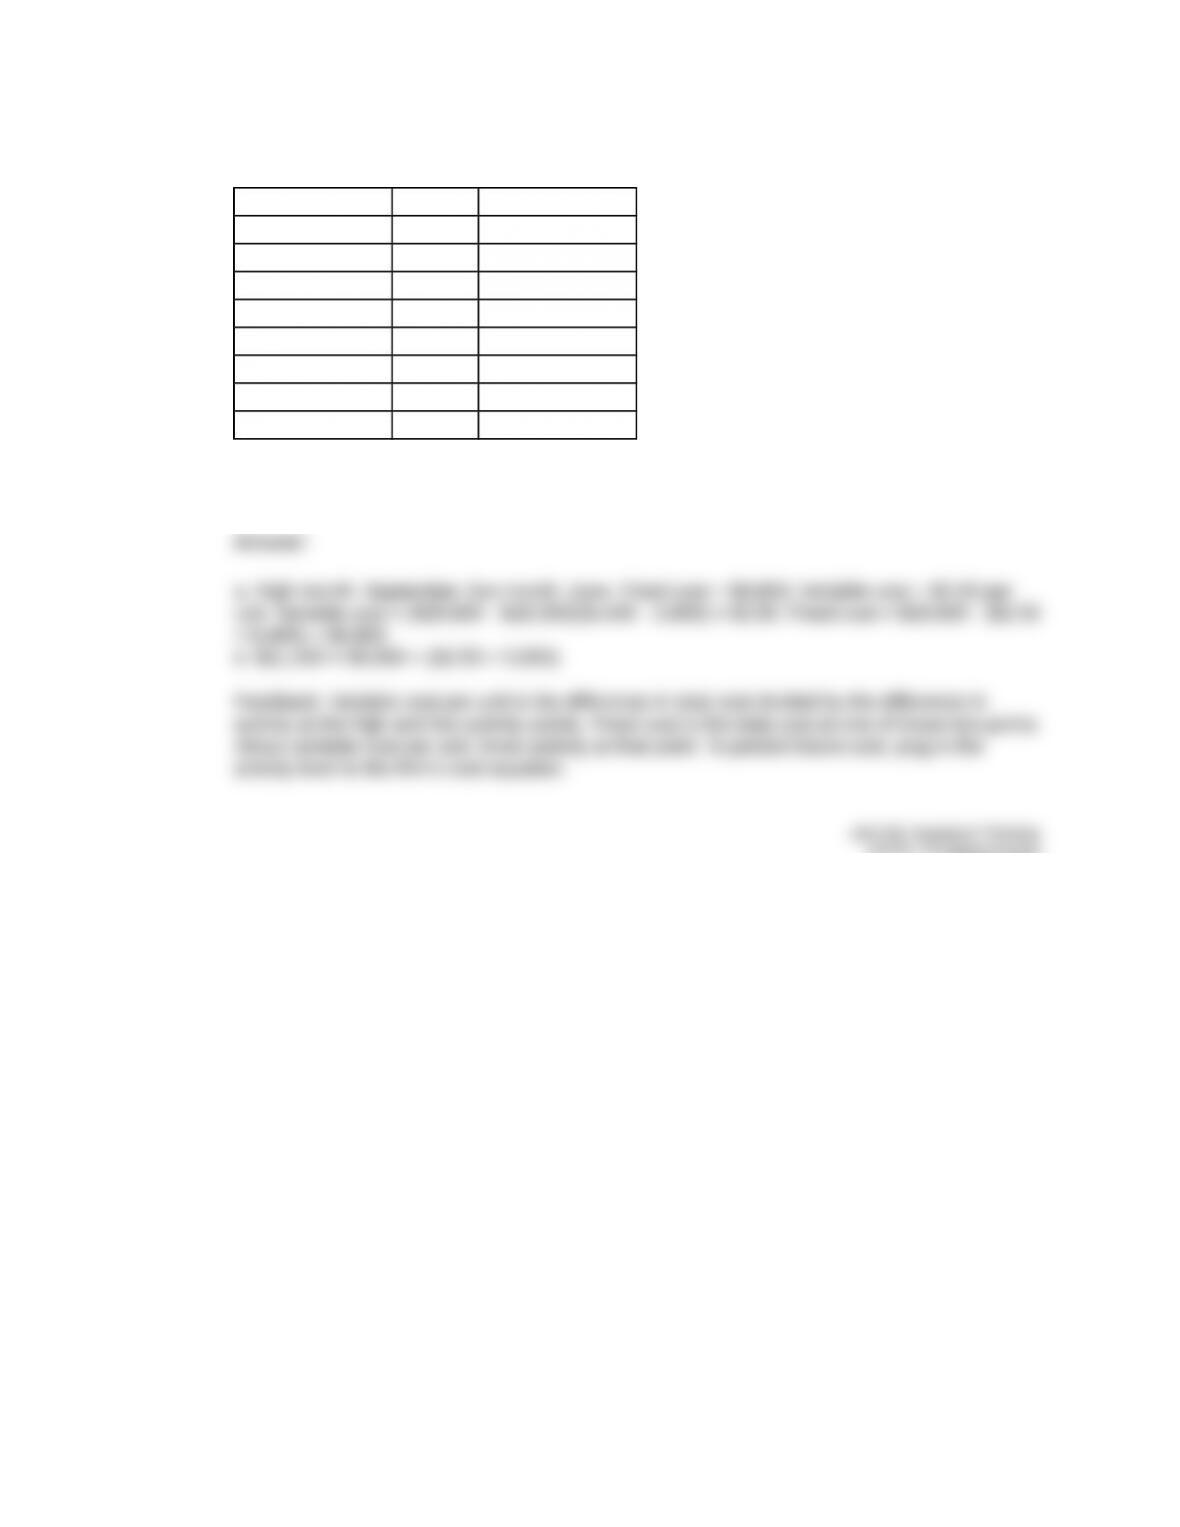
Accessibility: Keyboard Navigation
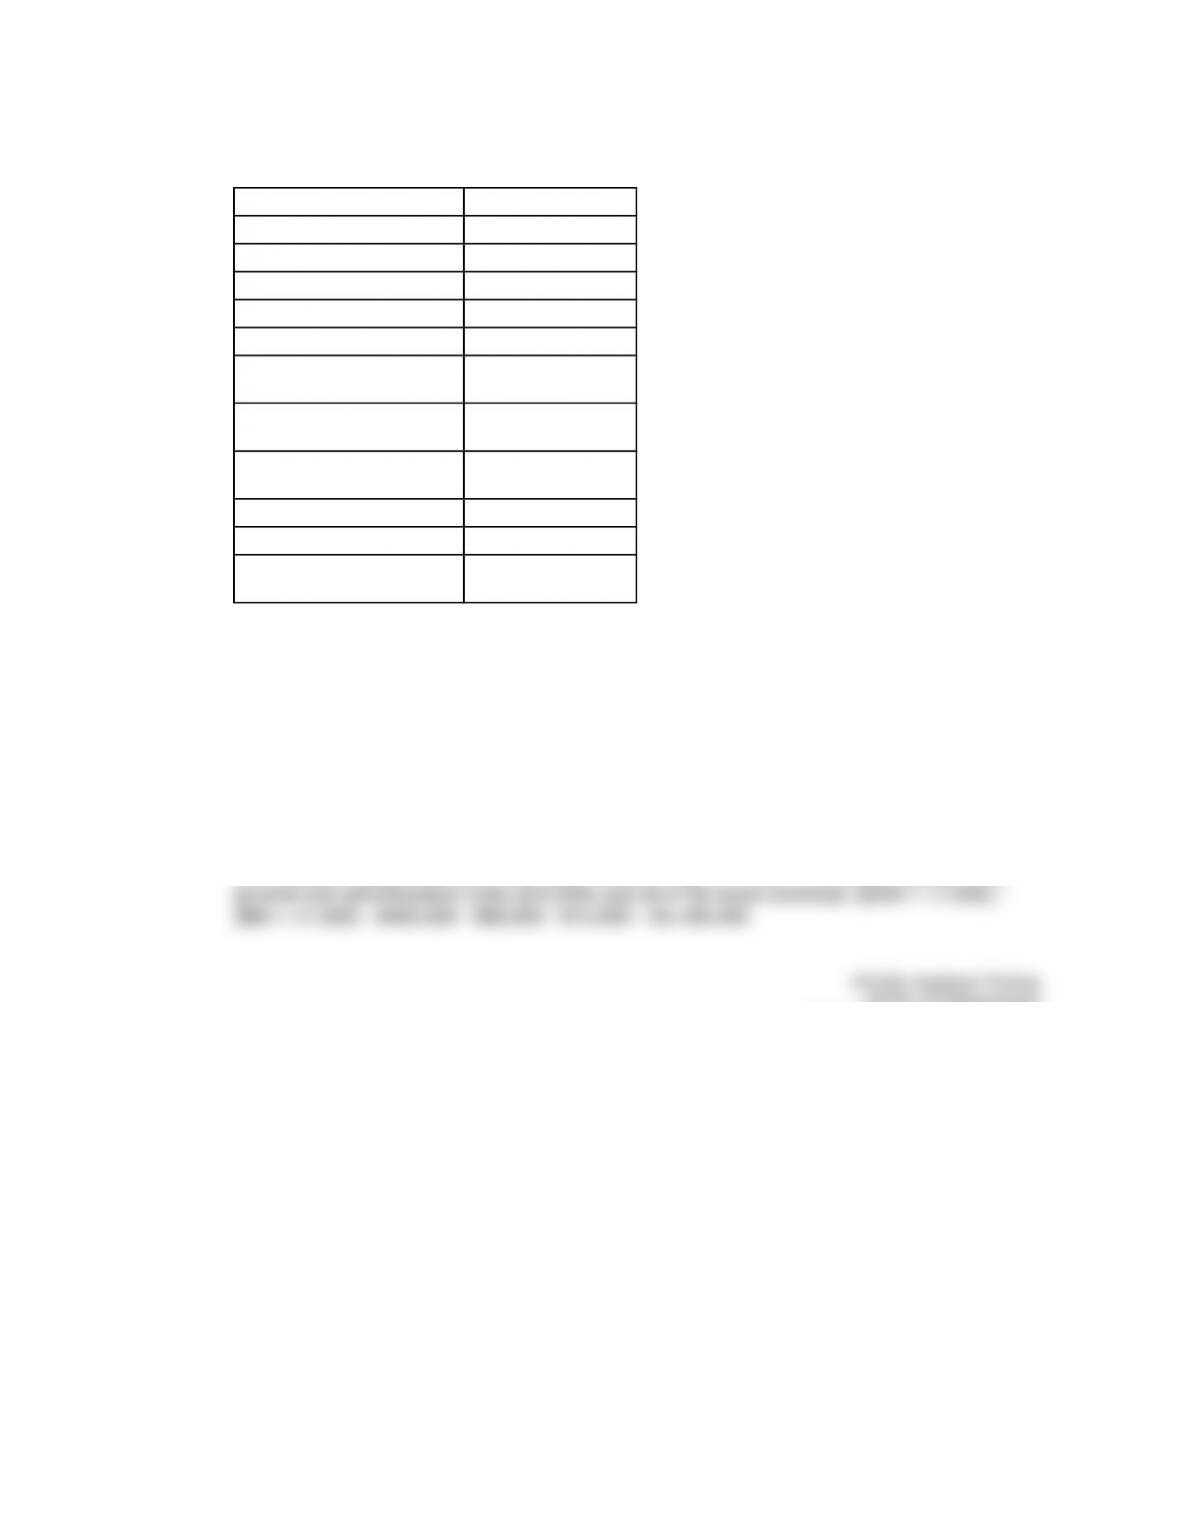
Blooms: Remember
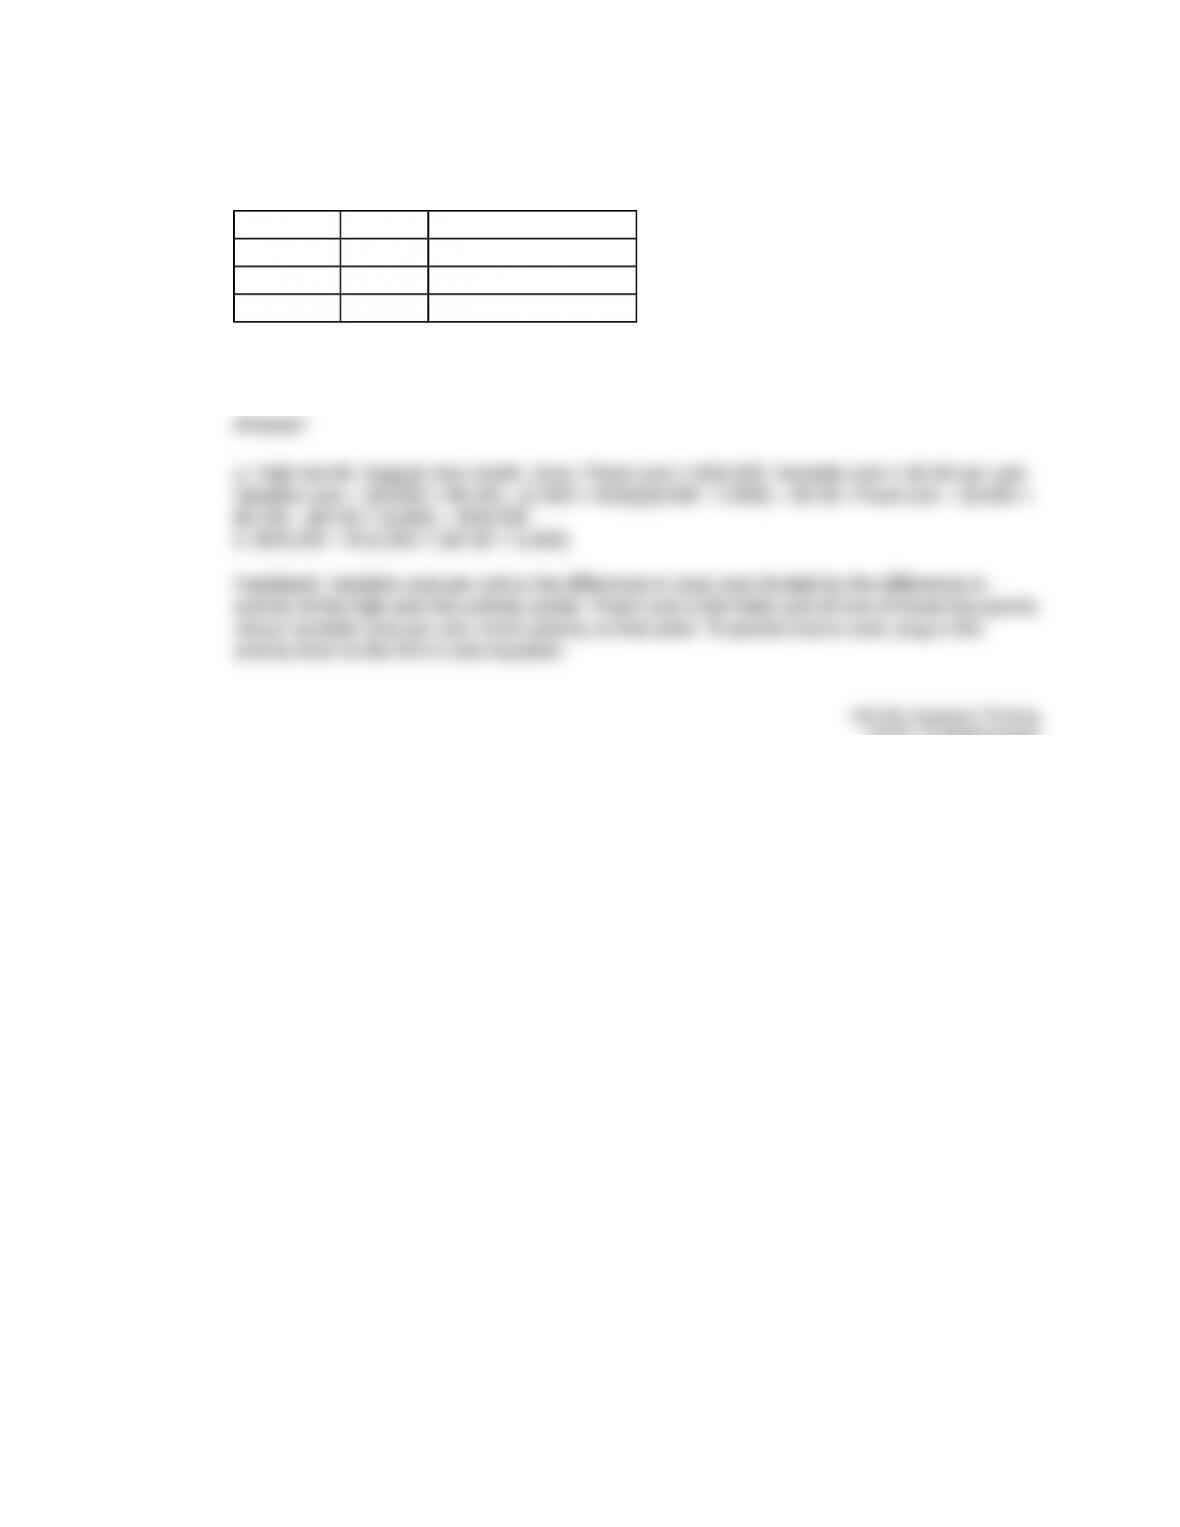
Difficulty: 1 Easy
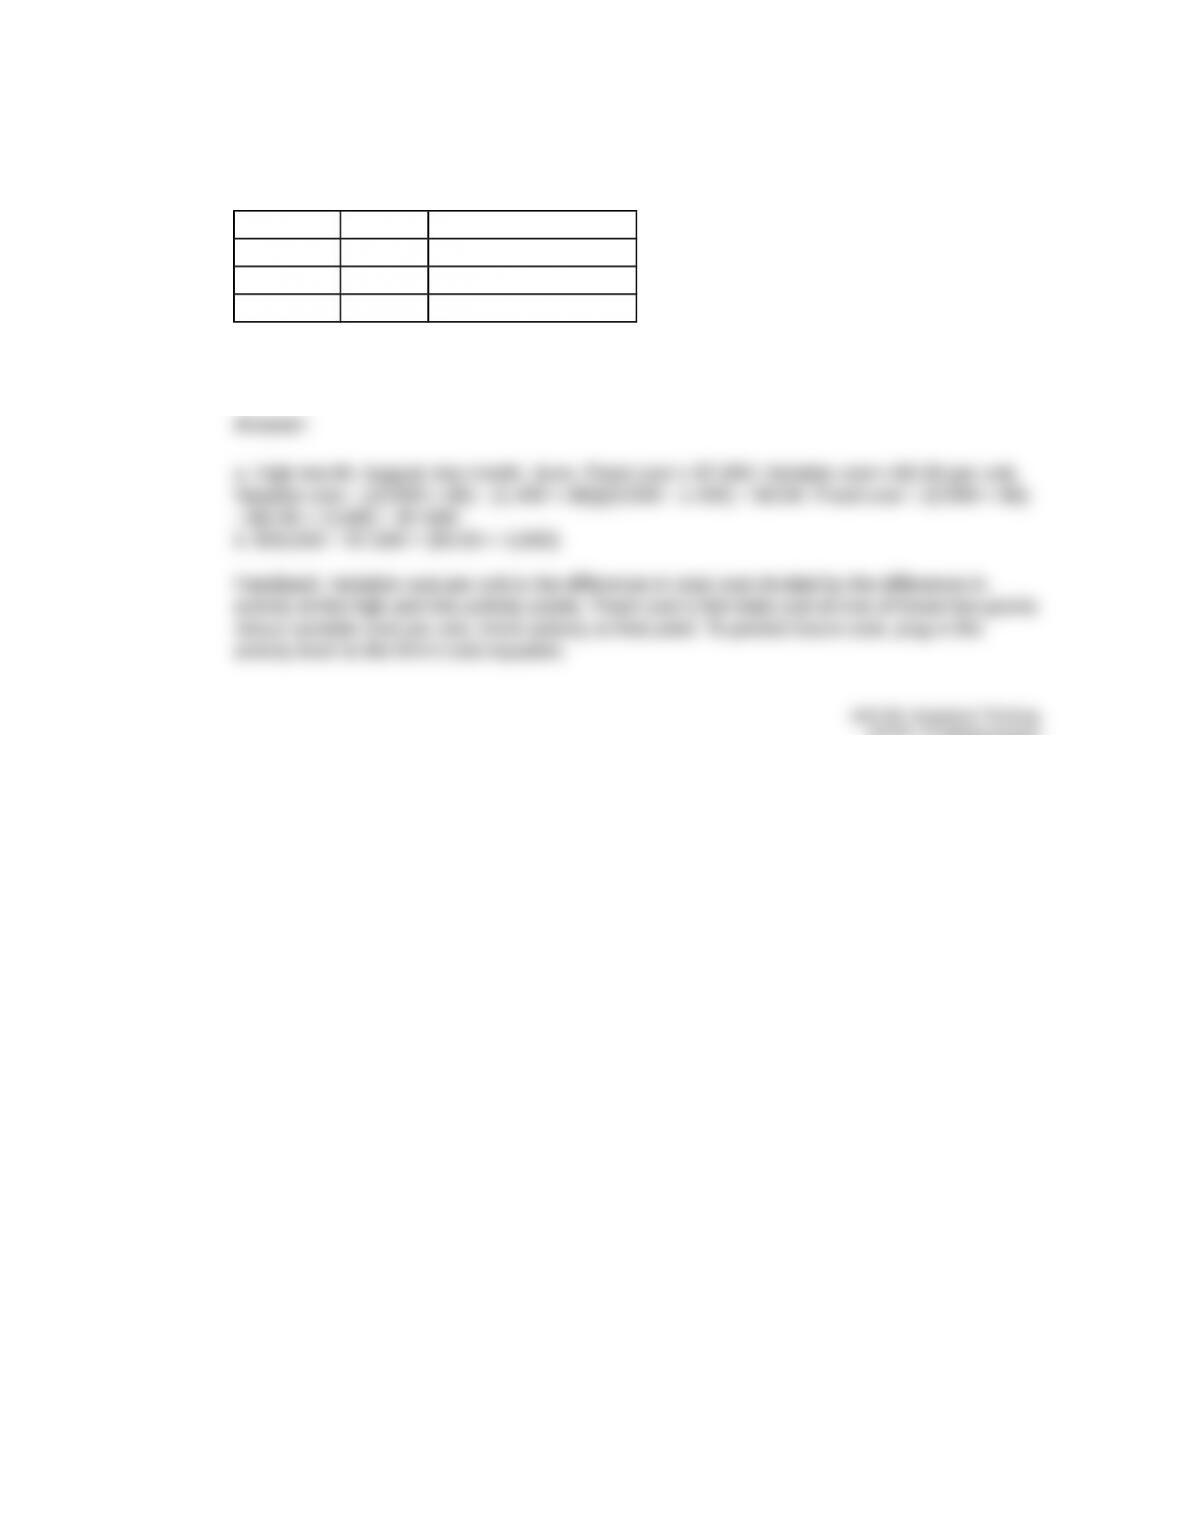
Learning Objective: 05-S1 Compare variable costing to full absorption costing.
Topic: Variable versus full absorption costing
15. Full absorption costing divides fixed overhead between Cost of Goods Sold and period
expenses.
AICPA: FN Measurement
Accessibility: Keyboard Navigation
Blooms: Remember
Difficulty: 1 Easy
Learning Objective: 05-S1 Compare variable costing to full absorption costing.
Topic: Variable versus full absorption costing
Multiple Choice Questions
16. Cost behavior is:
B. the difference between sales revenue and fixed costs.
C. the same as absorption costing.
D. the amount of sales necessary to achieve a specific profit.
Cost behavior is the way in which costs change when activity levels change.
AICPA: BB Critical Thinking
Accessibility: Keyboard Navigation
Blooms: Remember
Difficulty: 1 Easy
Learning Objective: 05-01 Identify costs as variable, fixed, step, or mixed.
Topic: Cost behavior patterns
5-5
Copyright © 2017 McGraw-Hill Education. All rights reserved. No reproduction or distribution without the prior written consent of
McGraw-Hill Education.
17. A cost driver:
A. is the same as a fixed cost.
C. is the same as margin of safety.
D. is a method of calculating mixed costs.
A cost driver is an activity that causes total costs to change.
AICPA: BB Critical Thinking
Accessibility: Keyboard Navigation
Blooms: Remember
Difficulty: 1 Easy
Learning Objective: 05-01 Identify costs as variable, fixed, step, or mixed.
Topic: Cost behavior patterns
18. The relevant range is:
A. the range in which costs remain variable.
true.
C. the range of activity based on the volume-based cost driver.
D. the range in which costs remain fixed.
The relevant range is the range of activity over which we expect our assumptions about cost
behavior to hold true.
AICPA: BB Critical Thinking
Accessibility: Keyboard Navigation
Blooms: Remember
Difficulty: 1 Easy
Learning Objective: 05-01 Identify costs as variable, fixed, step, or mixed.
Topic: Relevant range
19. A company’s normal operating activity is to produce 500 units per month. During its first two
months of operations, it produced 100 units per month. Following a great article about the
product, product spiked to 1,000 units per month, but the spike only lasted for one month.
Which of the following best approximates the company’s relevant range?
B. 100 – 1,000 units
C. 500 – 1,000 units
D. 100, 500, or 1,000 units
Relevant range is a company’s “normal” operating range. In this case, the relevant range is
5-6
Copyright © 2017 McGraw-Hill Education. All rights reserved. No reproduction or distribution without the prior written consent of
McGraw-Hill Education.
AICPA: FN Measurement
Accessibility: Keyboard Navigation
Blooms: Understand
Difficulty: 2 Medium
Learning Objective: 05-01 Identify costs as variable, fixed, step, or mixed.
Topic: Relevant range
20. Which of the following statements is correct about relevant range?
A. The relevant range only applies to fixed costs in the context of “step costs.”
B. The relevant range determines production levels for the company.
relevant range is not prescriptive beyond the range.
D. The relevant range is useful for operations managers, but not necessarily for cost
managers within a production facility.
When analyzing cost behavior, we limit our analysis to the relevant range, but assumptions
and conclusions may not necessarily extend beyond the range of activity outlined in the
relevant range.
AICPA: BB Critical Thinking
Accessibility: Keyboard Navigation
Blooms: Understand
Difficulty: 2 Medium
Learning Objective: 05-01 Identify costs as variable, fixed, step, or mixed.
Topic: Relevant range
21. A cost that changes, in total, in direct proportion to changes in activity levels is a(n):
A. absorption cost.
B. contribution margin.
C. fixed cost.
AICPA: FN Measurement
Accessibility: Keyboard Navigation
Blooms: Remember
Difficulty: 1 Easy
Learning Objective: 05-01 Identify costs as variable, fixed, step, or mixed.
Topic: Variable costs
5-7
Copyright © 2017 McGraw-Hill Education. All rights reserved. No reproduction or distribution without the prior written consent of
McGraw-Hill Education.
22. All else being equal, if sales revenue doubles, variable costs will:
A. decrease in total.
C. decrease on a per unit basis.
D. increase on a per unit basis.
AICPA: BB Critical Thinking
Accessibility: Keyboard Navigation
Blooms: Understand
Difficulty: 2 Medium
Learning Objective: 05-01 Identify costs as variable, fixed, step, or mixed.
Topic: Variable costs
23. When Carter, Inc. sells 48,000 units, its total variable cost is $115,200. What is its total
variable cost when it sells 54,000 units?
A. $100,800
B. $115,200
D. $134,800
AICPA: FN Measurement
Accessibility: Keyboard Navigation
Blooms: Apply
Difficulty: 2 Medium
Learning Objective: 05-01 Identify costs as variable, fixed, step, or mixed.
Topic: Variable costs
24. Which of the following is a variable cost?
A. A cost that is $26,000 when production is 65,000, and $26,000 when production is 91,000.
C. A cost that is $26,000 when production is 65,000, and $52,000 when production is 91,000.
D. A cost that is $52,000 when production is 65,000, and $52,000 when production is 91,000.
AICPA: FN Measurement
Accessibility: Keyboard Navigation
Blooms: Apply
5-8
Copyright © 2017 McGraw-Hill Education. All rights reserved. No reproduction or distribution without the prior written consent of
McGraw-Hill Education.
Difficulty: 2 Medium
Learning Objective: 05-01 Identify costs as variable, fixed, step, or mixed.
Topic: Variable costs
25. Which of the following statements is true?
A. Fixed costs are constant on a per unit basis.
B. Variable costs per unit decrease as activity volume increases.
C. Variable costs are constant in total dollars.
AICPA: BB Critical Thinking
Accessibility: Keyboard Navigation
Blooms: Remember
Difficulty: 1 Easy
Learning Objective: 05-01 Identify costs as variable, fixed, step, or mixed.
Topic: Fixed costs
26. A cost that remains the same, in total, regardless of changes in activity level is a:
A. variable cost.
C. mixed cost.
D. step cost.
AICPA: FN Measurement
Accessibility: Keyboard Navigation
Blooms: Remember
Difficulty: 1 Easy
Learning Objective: 05-01 Identify costs as variable, fixed, step, or mixed.
Topic: Fixed costs
27. All else being equal, if sales revenue doubles, fixed costs will:
A. decrease in total.
B. increase in total.
D. increase on a per unit basis.
AICPA: BB Critical Thinking
Accessibility: Keyboard Navigation
5-9
Copyright © 2017 McGraw-Hill Education. All rights reserved. No reproduction or distribution without the prior written consent of
McGraw-Hill Education.
Blooms: Understand
Difficulty: 2 Medium
Learning Objective: 05-01 Identify costs as variable, fixed, step, or mixed.
Topic: Fixed costs
28. When Greenway, Inc. sells 48,000 units, its total fixed cost is $115,200. What is its total fixed
cost when it sells 54,000 units?
A. $100,800
C. $129,600
D. $134,800
Fixed costs remain the same in total regardless of activity level, so $115,200 of fixed costs is
the same whether Greenway, Inc. sells 48,000 units or 54,000 units assuming that both levels
fall within the relevant range.
AICPA: FN Measurement
Accessibility: Keyboard Navigation
Blooms: Apply
Difficulty: 2 Medium
Learning Objective: 05-01 Identify costs as variable, fixed, step, or mixed.
Topic: Fixed costs
29. Which of the following is a fixed cost?
A. A cost that is $28.00 per unit when production is 70,000, and $28.00 per unit when
production is 112,000.
production is 112,000.
C. A cost that is $28.00 per unit when production is 70,000, and $56.00 per unit when
production is 112,000.
D. A cost that is $56.00 per unit when production is 70,000, and $56.00 per unit when
AICPA: FN Measurement
Accessibility: Keyboard Navigation
Blooms: Apply
Difficulty: 2 Medium
Learning Objective: 05-01 Identify costs as variable, fixed, step, or mixed.
Topic: Fixed costs
5-10
Copyright © 2017 McGraw-Hill Education. All rights reserved. No reproduction or distribution without the prior written consent of
McGraw-Hill Education.
30. A step cost:
A. is a fixed cost over the relevant range and a variable cost everywhere else.
B. contains both fixed and variable components.
C. increases in direct proportion to changes in activity.
AICPA: FN Measurement
Accessibility: Keyboard Navigation
Blooms: Understand
Difficulty: 2 Medium
Learning Objective: 05-01 Identify costs as variable, fixed, step, or mixed.
Topic: Step costs
31. Stella, Inc. must perform maintenance on its production machinery after every 10,000 units
produced. Production varies between 12,000 and 30,000 units a year. The cost of this
maintenance would be classified as a
A. variable cost.
B. fixed cost.
D. mixed cost.
AICPA: FN Measurement
Accessibility: Keyboard Navigation
Blooms: Understand
Difficulty: 2 Medium
Learning Objective: 05-01 Identify costs as variable, fixed, step, or mixed.
Topic: Step costs
32. A mixed cost has:
A. either fixed or variable cost components, but not both.
B. only variable cost components, both within and outside of the relevant range.
C. only fixed cost components, both within and outside of the relevant range.
AICPA: BB Critical Thinking
Accessibility: Keyboard Navigation
Blooms: Remember
Difficulty: 1 Easy
5-11
Copyright © 2017 McGraw-Hill Education. All rights reserved. No reproduction or distribution without the prior written consent of
McGraw-Hill Education.
Learning Objective: 05-01 Identify costs as variable, fixed, step, or mixed.
Topic: Mixed costs
33. A mixed cost:
A. is fixed over a wider range of activity than a step cost.
B. is a fixed cost over the relevant range and a variable cost everywhere else.
D. always increases on a per unit basis.
AICPA: BB Critical Thinking
Accessibility: Keyboard Navigation
Blooms: Remember
Difficulty: 1 Easy
Learning Objective: 05-01 Identify costs as variable, fixed, step, or mixed.
Topic: Mixed costs
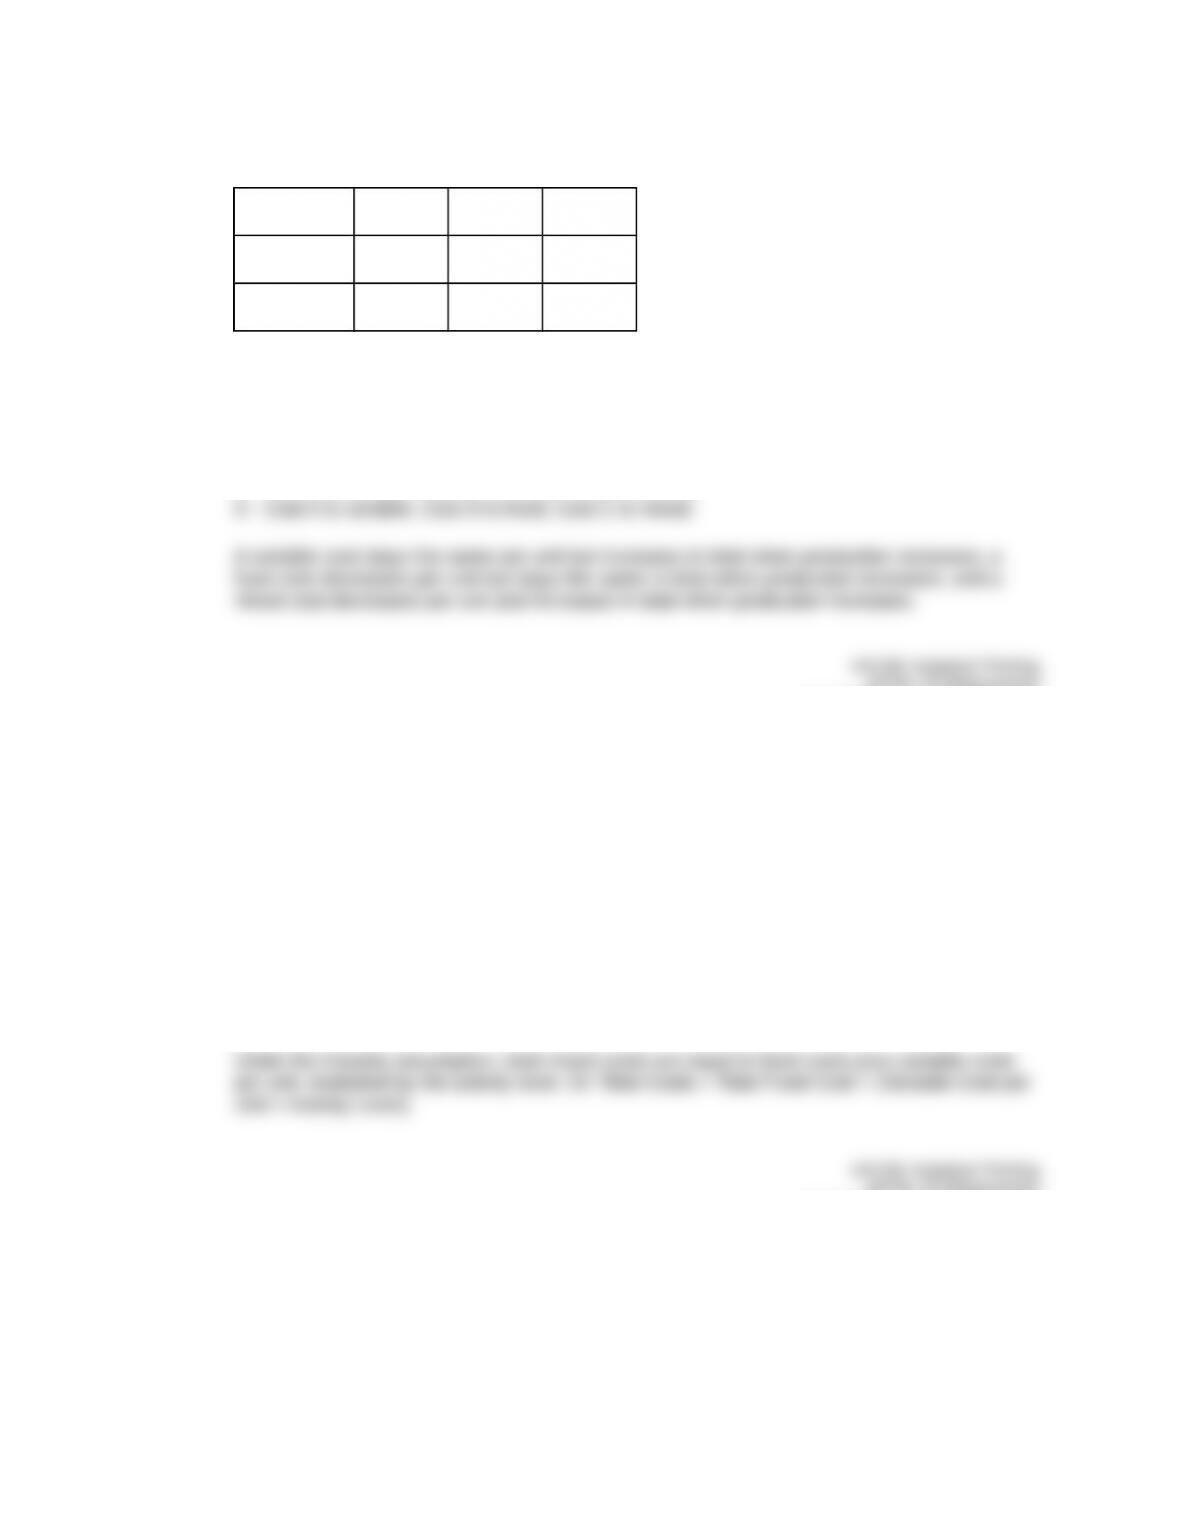
34. Mohave, Inc. produces approximately 4,000 units per month, and it places a quality assurance
logo on each of its units. To use this logo, it must pay the quality assurance firm $5,000 per
month plus $1 per unit. The cost to Mohave of using the quality assurance logo would be a:
A. fixed cost.
C. variable cost.
D. step cost.
AICPA: FN Measurement
Accessibility: Keyboard Navigation
Blooms: Apply
Difficulty: 2 Medium
Learning Objective: 05-01 Identify costs as variable, fixed, step, or mixed.
Topic: Mixed costs
5-12
Copyright © 2017 McGraw-Hill Education. All rights reserved. No reproduction or distribution without the prior written consent of
McGraw-Hill Education.
35. Which of the following is a mixed cost?
A. A cost that is $32.00 per unit when production is 80,000, and $32.00 per unit when
production is 128,000.
B. A cost that is $32.00 per unit when production is 80,000, and $40.00 per unit when
production is 128,000.
production is 128,000.
D. A cost that is $64.00 per unit when production is 80,000, and $64.00 per unit when
AICPA: FN Measurement
Accessibility: Keyboard Navigation
Blooms: Apply
Difficulty: 3 Hard
Learning Objective: 05-01 Identify costs as variable, fixed, step, or mixed.
Topic: Mixed costs
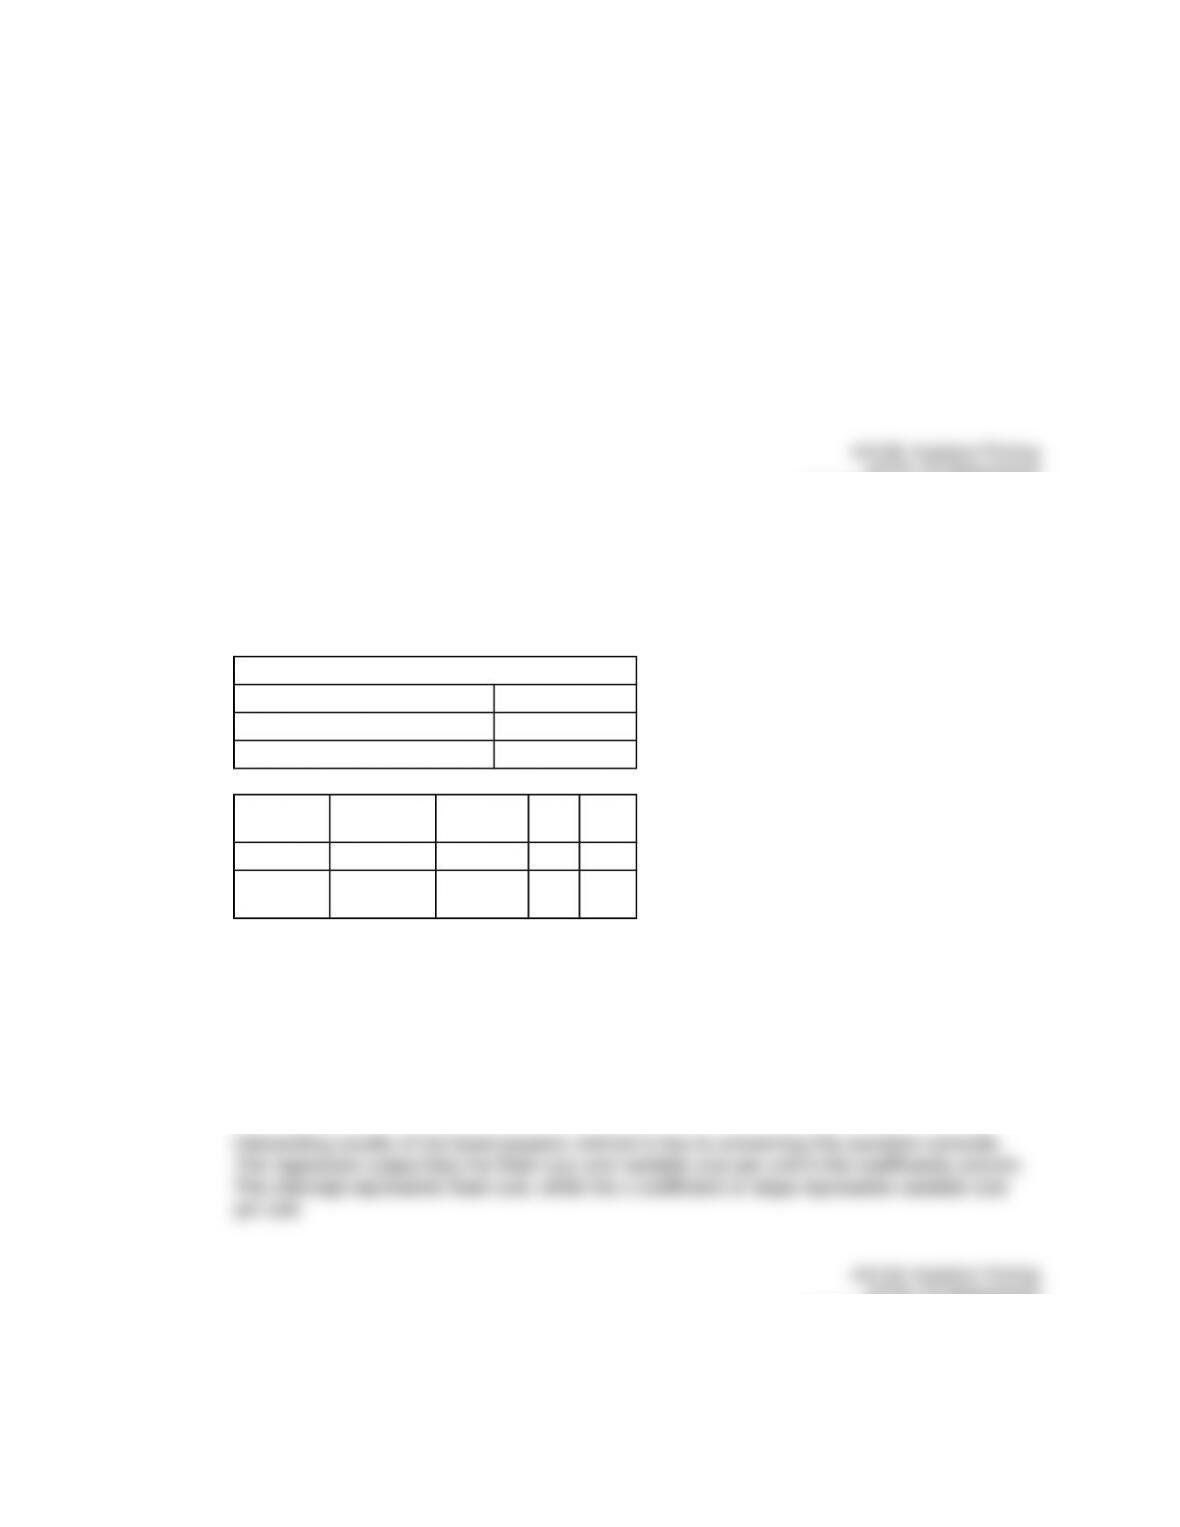
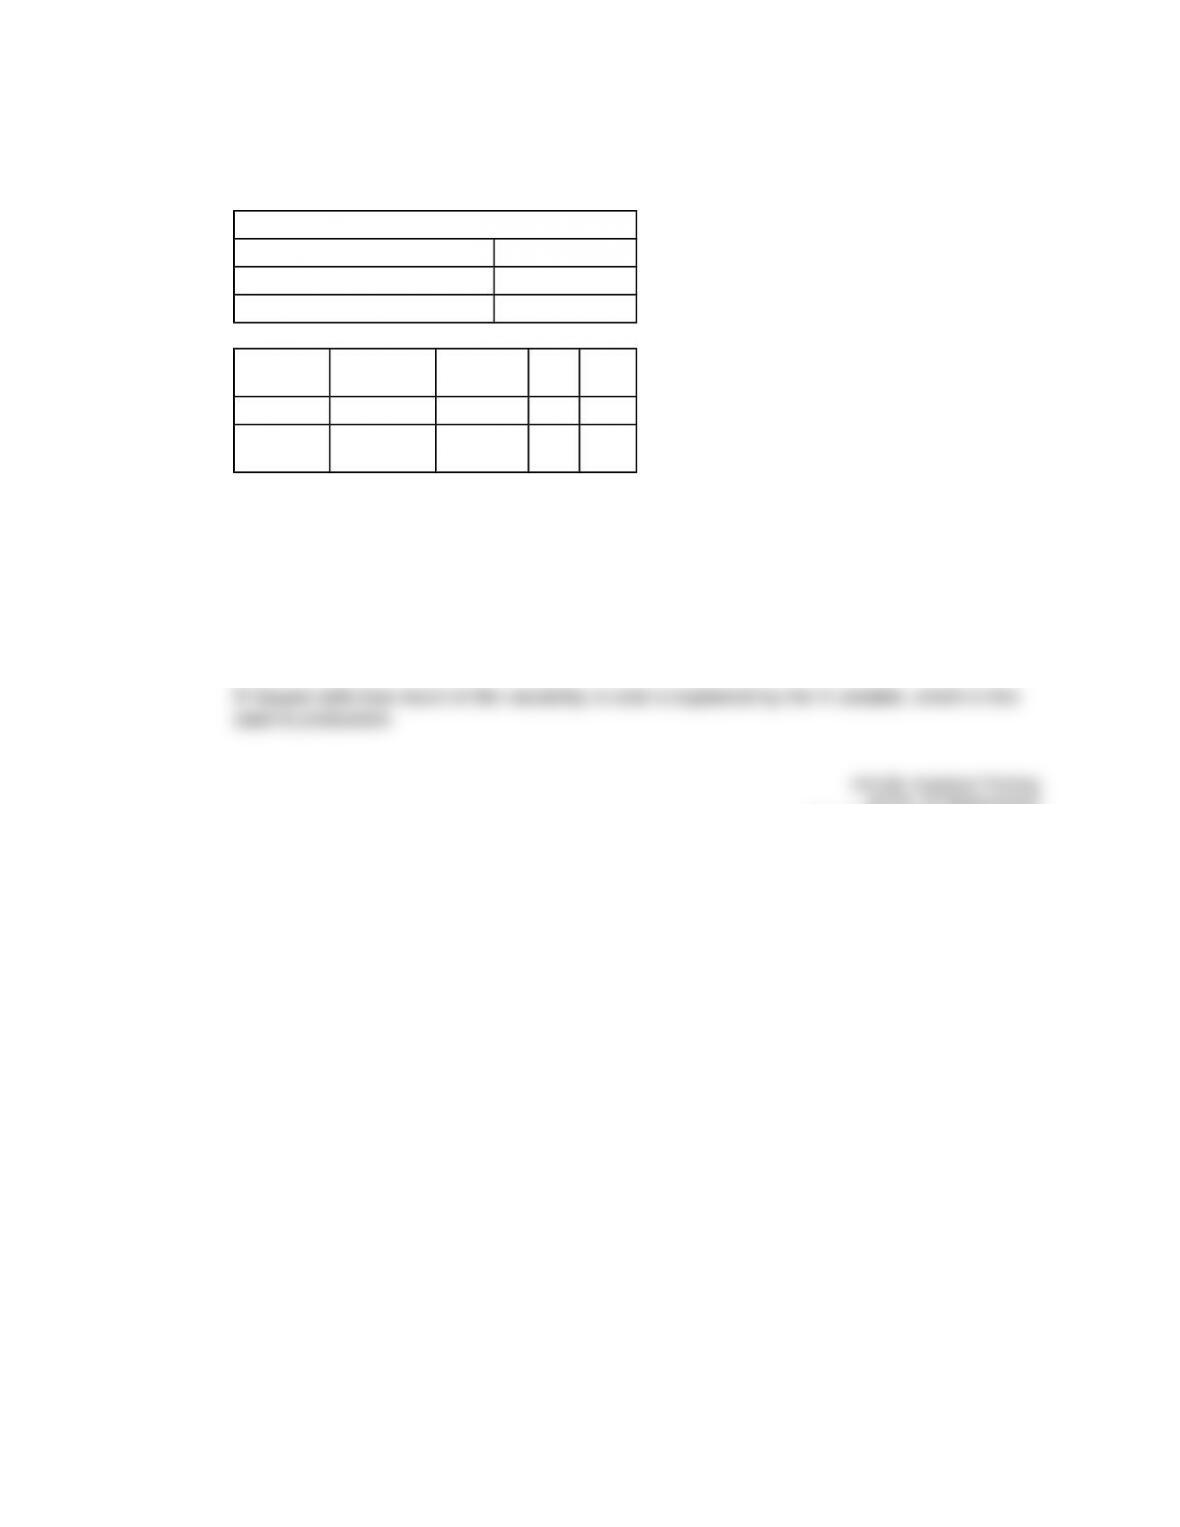
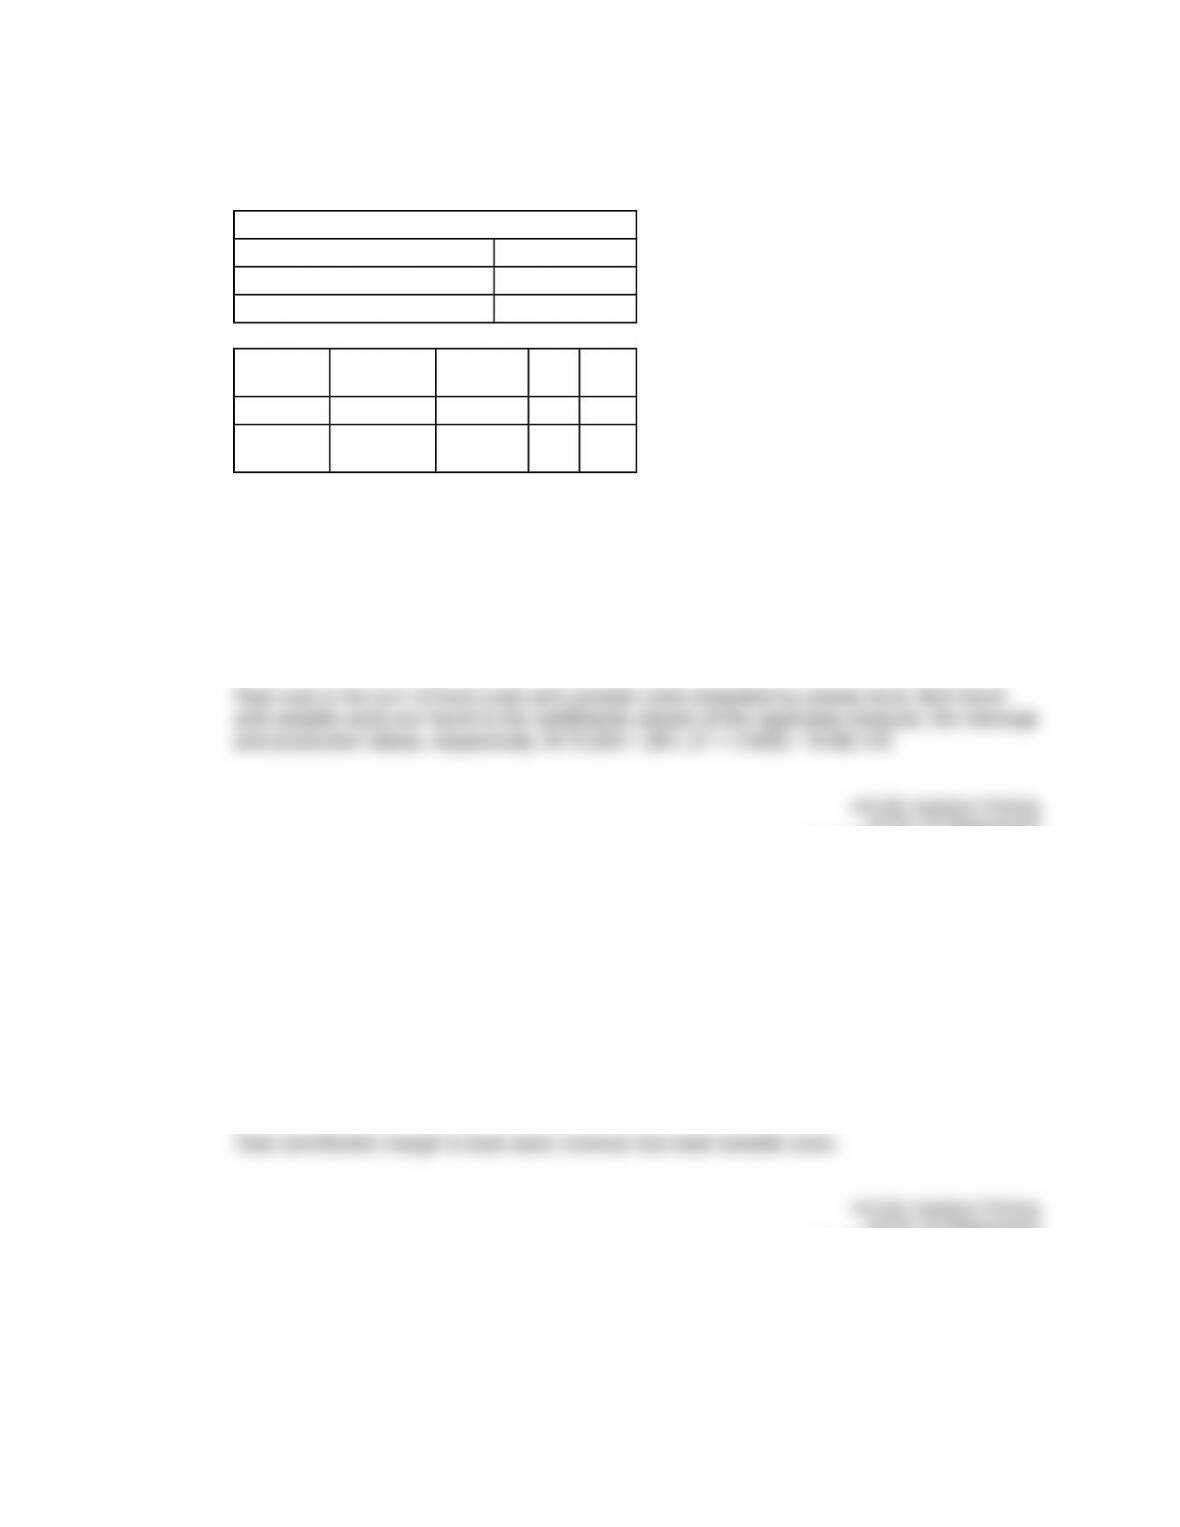
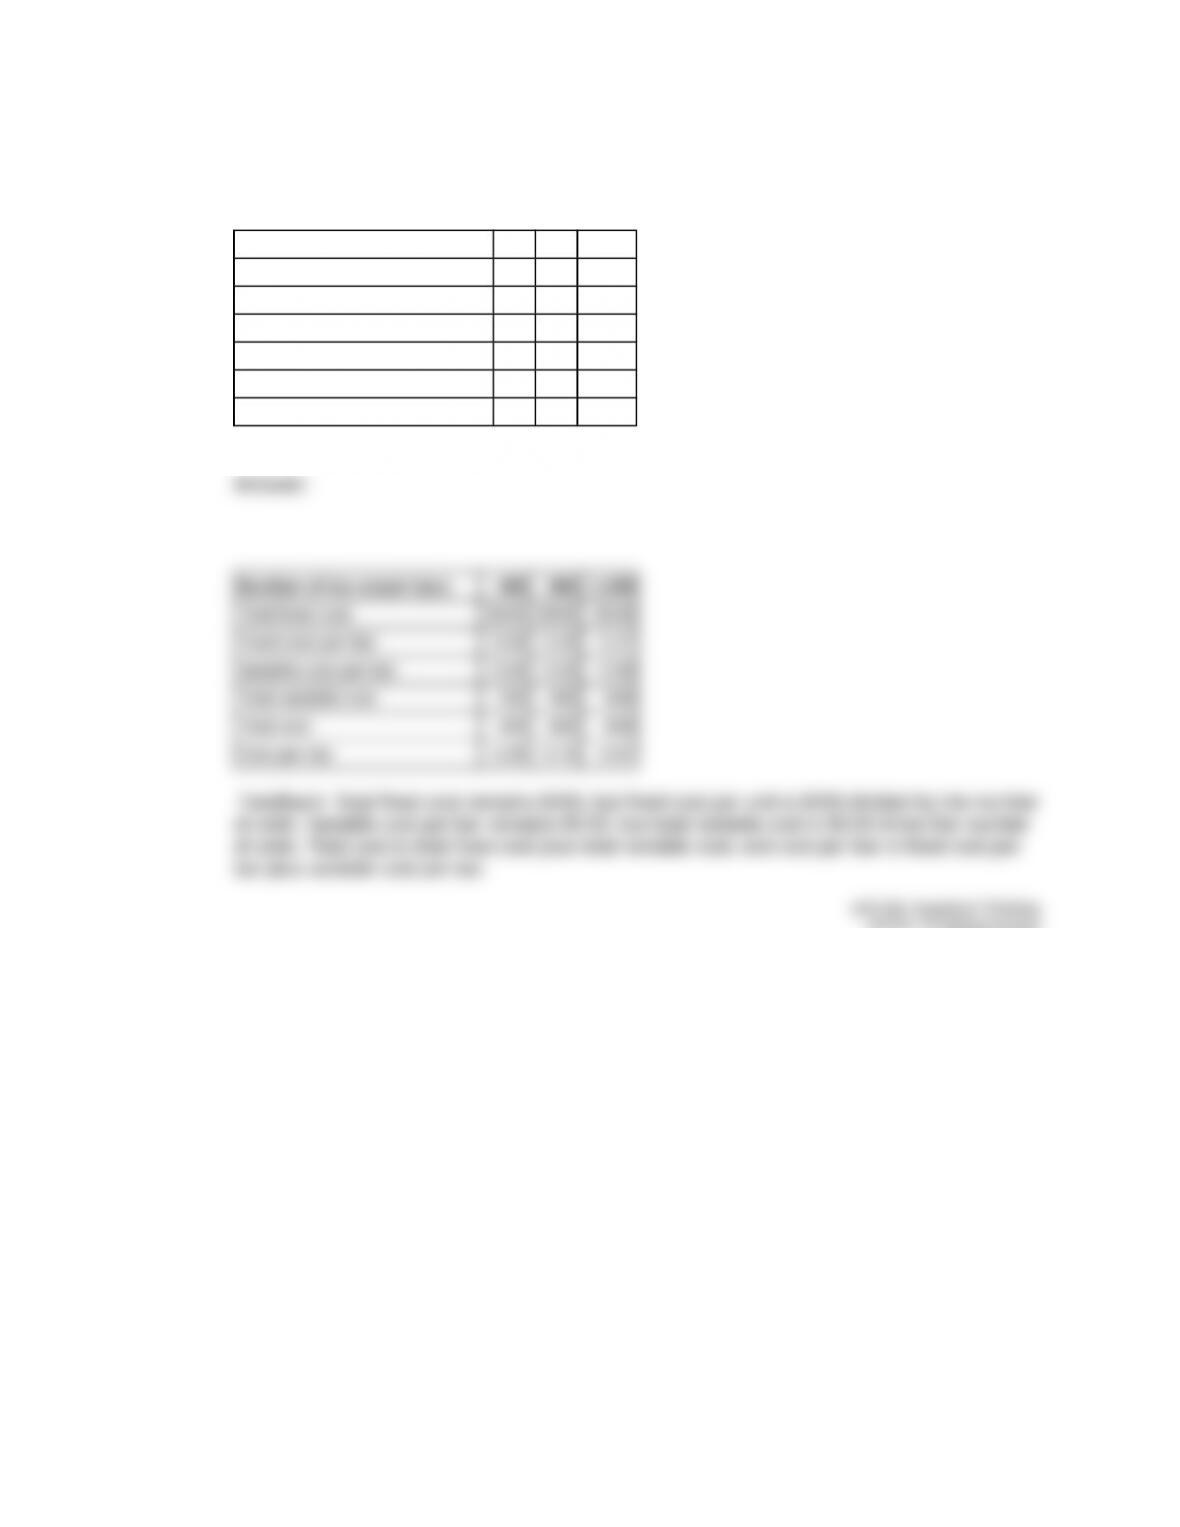
36. Onini, Inc. produces one product with two production levels: 20,000 units and 80,000 units. At
each production level, Onini’s per-unit costs for Costs A, B, and C are:
Cost A
(per unit)
Cost B
(per unit)
Cost C
(per unit)
Production =
20,000 $12.00 $15.00 $20.00
Production =
80,000 $12.00 $11.25 $5.00
What type of cost is each?
A. Cost A is fixed, Cost B is mixed, and Cost C is variable.
B. Cost A is fixed, Cost B is variable, and Cost C is mixed.
C. Cost A is variable, Cost B is mixed, and Cost C is fixed.
AICPA: FN Measurement
Accessibility: Keyboard Navigation
Blooms: Analyze
Difficulty: 3 Hard
Learning Objective: 05-01 Identify costs as variable, fixed, step, or mixed.
Topic: Fixed costs
Topic: Mixed costs
Topic: Variable costs
5-13
Copyright © 2017 McGraw-Hill Education. All rights reserved. No reproduction or distribution without the prior written consent of
McGraw-Hill Education.
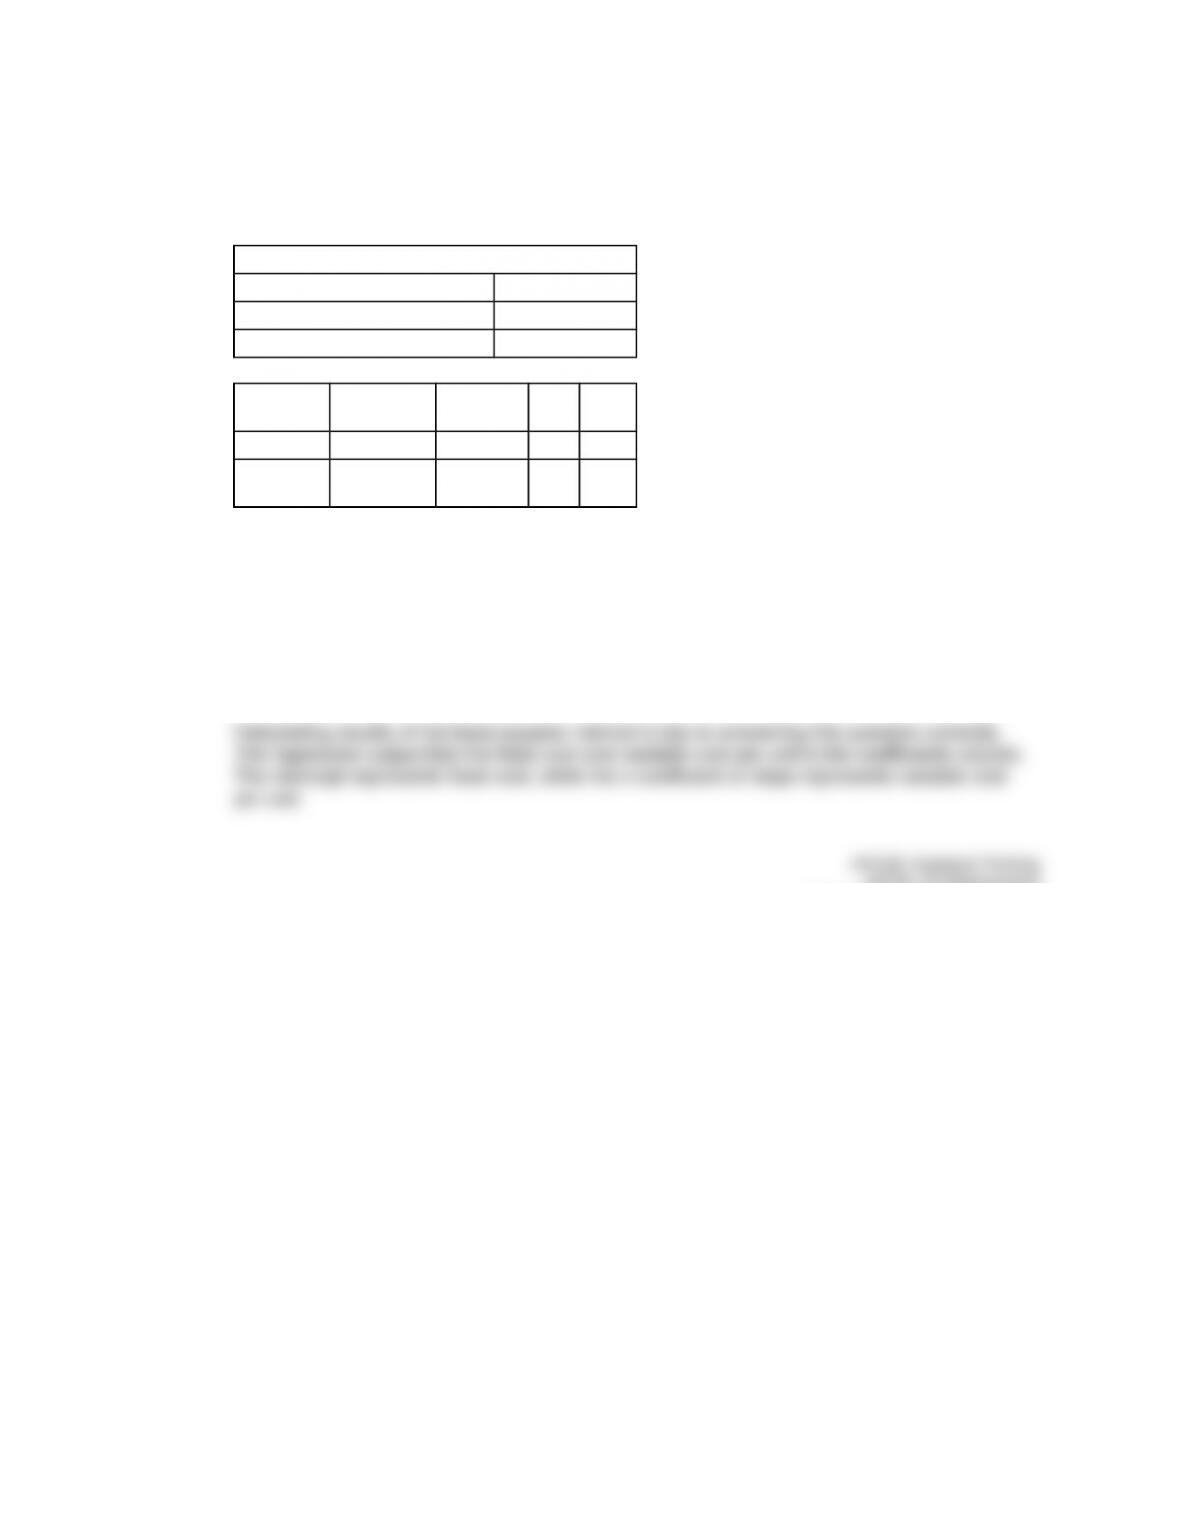
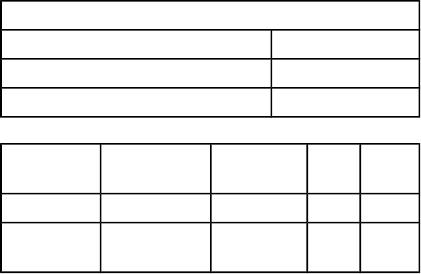
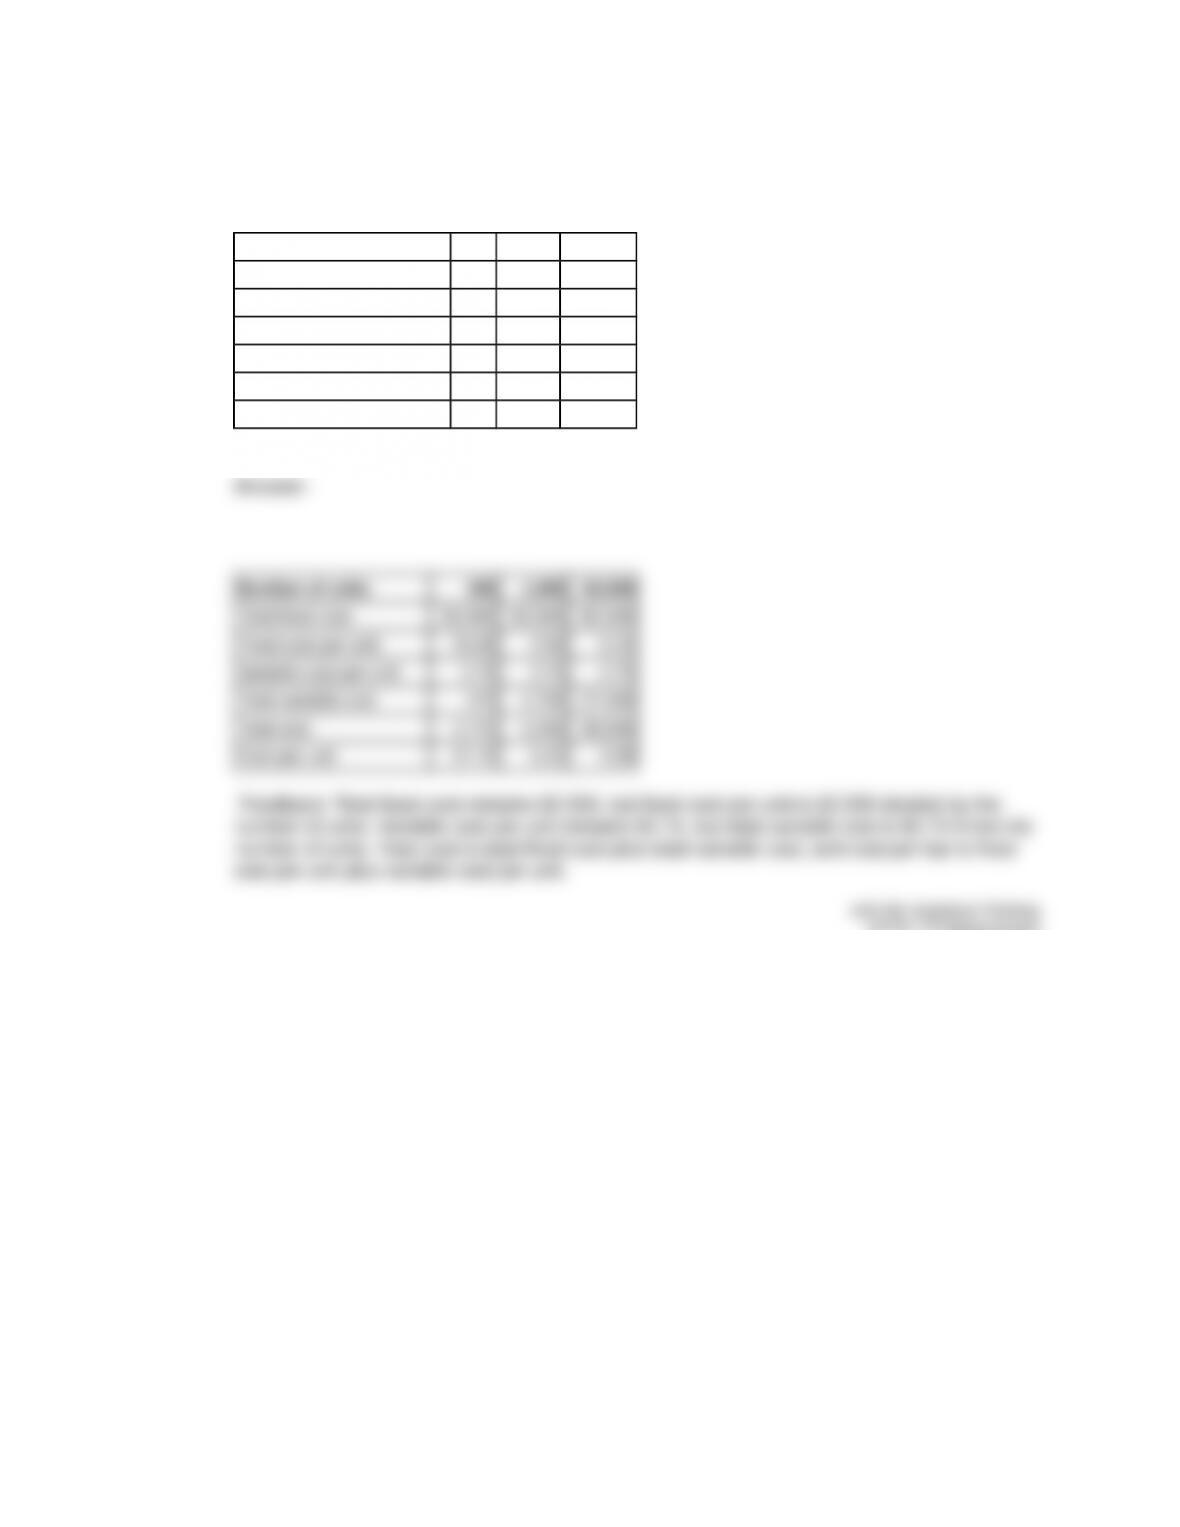
37. The per-unit amount of three different production costs for Thunderbird, Inc., are as follows:
Cost A
(per unit)
Cost B
(per unit)
Cost C
(per unit)
Production =
16,000 $32.00 $24.00 $19.20
Production =
64,000 $8.00 $18.00 $19.20
What type of cost is each?
B. Cost A is fixed, Cost B is variable, Cost C is mixed.
C. Cost A is variable, Cost B is mixed, Cost C is fixed.
AICPA: FN Measurement
Accessibility: Keyboard Navigation
Blooms: Analyze
Difficulty: 3 Hard
Learning Objective: 05-01 Identify costs as variable, fixed, step, or mixed.
Topic: Fixed costs
Topic: Mixed costs
Topic: Variable costs
38. Which of the following is the correct equation for total mixed costs under the linearity
assumption?
B. Total Variable Costs + (Fixed Cost per Unit × Units of Activity)
C. (Total Fixed Costs × Units of Activity) + Total Variable Costs
D. (Total Fixed Costs × Units of Activity) + (Total Variable Costs × Units of Activity)
AICPA: FN Measurement
Accessibility: Keyboard Navigation
Blooms: Remember
Difficulty: 1 Easy
Learning Objective: 05-01 Identify costs as variable, fixed, step, or mixed.
Topic: Linear approach to analyzing mixed costs
5-14
Copyright © 2017 McGraw-Hill Education. All rights reserved. No reproduction or distribution without the prior written consent of
McGraw-Hill Education.
39. The linearity assumption is:
approximated by a straight line.
B. the assumption that the relationship between fixed costs and variable costs can be
approximated by a curved line.
C. realistic in all costing situations.
D. the assumption that total cost depends on activity level.
The linearity assumption is the assumption that the relationship between total cost and activity
can be approximated by a straight line.
AICPA: FN Measurement
Accessibility: Keyboard Navigation
Blooms: Remember
Difficulty: 1 Easy
Learning Objective: 05-01 Identify costs as variable, fixed, step, or mixed.
Topic: Linear approach to analyzing mixed costs
40. A graph of that provides a visual representation of the relationship between total cost and
activity level is called a:
A. relevant range.
C. contribution margin graph.
D. dependent variable.
AICPA: BB Critical Thinking
Accessibility: Keyboard Navigation
Blooms: Remember
Difficulty: 1 Easy
Learning Objective: 05-02 Prepare a scattergraph to illustrate the relationship between total cost and activity.
Topic: Scattergraph
41. A scattergraph is a graph with:
B. activity plotted on the vertical axis and contribution margin on the horizontal axis.
C. contribution margin plotted on the vertical axis and sales revenues on the horizontal axis.
D. the vertical axis measured in units and the horizontal axis measured in dollars.
AICPA: FN Measurement
5-15
Copyright © 2017 McGraw-Hill Education. All rights reserved. No reproduction or distribution without the prior written consent of
McGraw-Hill Education.
Accessibility: Keyboard Navigation
Blooms: Understand
Difficulty: 2 Medium
Learning Objective: 05-02 Prepare a scattergraph to illustrate the relationship between total cost and activity.
Topic: Scattergraph
42. The slope of the cost line on a scattergraph represents:
A. fixed cost per unit.
B. total fixed cost.
D. sales price per unit.
AICPA: FN Measurement
Accessibility: Keyboard Navigation
Blooms: Remember
Difficulty: 1 Easy
Learning Objective: 05-02 Prepare a scattergraph to illustrate the relationship between total cost and activity.
Topic: Scattergraph
43. The y-intercept of the cost line on a scattergraph represents:
A. fixed cost per unit.
C. variable cost per unit.
D. sales price per unit.
AICPA: FN Measurement
Accessibility: Keyboard Navigation
Blooms: Remember
Difficulty: 1 Easy
Learning Objective: 05-02 Prepare a scattergraph to illustrate the relationship between total cost and activity.
Topic: Scattergraph
5-16
Copyright © 2017 McGraw-Hill Education. All rights reserved. No reproduction or distribution without the prior written consent of
McGraw-Hill Education.
44. If a scattergraph contains points that do not fall in a perfect line:
A. the relationship between the variables is not good enough to warrant fitting a line to the
data.
B. this is an indication that there is no relationship whatsoever between the variables.
C. the visual fit method and high-low methods should not be used, but least-squares
regression can be used.
AICPA: FN Measurement
Accessibility: Keyboard Navigation
Blooms: Understand
Difficulty: 2 Medium
Learning Objective: 05-02 Prepare a scattergraph to illustrate the relationship between total cost and activity.
Topic: Scattergraph
45. The cost estimating approach that involves “eye-balling” the closest fitting line to the data is
the:
A. scattergraph method.
B. high-low method.
C. visual fit method.
AICPA: FN Measurement
Accessibility: Keyboard Navigation
Blooms: Remember
Difficulty: 1 Easy
Learning Objective: 05-02 Prepare a scattergraph to illustrate the relationship between total cost and activity.
Topic: Scattergraph
5-17
Copyright © 2017 McGraw-Hill Education. All rights reserved. No reproduction or distribution without the prior written consent of
McGraw-Hill Education.
46. Which of the following is true about the visual fit method?
A. The visual fit method is the most objective way to fit a line to cost data using a
scattergraph.
B. Although a scattergraph can be created by hand, the visual fit method of determining total
fixed costs and variable costs per unit must be completed by computer.
method is an approximation of total fixed costs and variable costs per unit.
D. If the scattergraph shows there is not a linear relationship between total costs and activity,
AICPA: BB Critical Thinking
Accessibility: Keyboard Navigation
Blooms: Understand
Difficulty: 2 Medium
Learning Objective: 05-02 Prepare a scattergraph to illustrate the relationship between total cost and activity.
Topic: Scattergraph
47. The cost estimating approach that uses the two most extreme activity observations is the:
A. scattergraph method.
C. visual fit method.
D. regression analysis.
The high-low method uses the two most extreme activity observations to fit the line.
AICPA: FN Measurement
Accessibility: Keyboard Navigation
Blooms: Remember
Difficulty: 1 Easy
Learning Objective: 05-03 Use the high-low method to analyze mixed costs.
Topic: High-low method
5-18
Copyright © 2017 McGraw-Hill Education. All rights reserved. No reproduction or distribution without the prior written consent of
McGraw-Hill Education.
48. The high-low method provides a reasonable estimate of the fixed and variable costs as long
as:
A. it uses eight or more points (instead of simply two).
B. at least one of the two points falls within the relevant range.
C. the high and low points for both activity and total fixed costs are the same.
AICPA: BB Critical Thinking
Accessibility: Keyboard Navigation
Blooms: Understand
Difficulty: 2 Medium
Learning Objective: 05-03 Use the high-low method to analyze mixed costs.
Topic: High-low method
49. Georgia uses the high-low method of estimating costs. Georgia had total costs of $50,000 at
its lowest level of activity, when 5,000 units were sold. When, at its highest level of activity,
sales equaled 10,000 units, total costs were $78,000. Georgia would estimate variable cost
per unit as:
A. $14.00
B. $9.10
D. $10.54
AICPA: FN Measurement
Accessibility: Keyboard Navigation
Blooms: Apply
Difficulty: 2 Medium
Learning Objective: 05-03 Use the high-low method to analyze mixed costs.
Topic: High-low method
5-19
Copyright © 2017 McGraw-Hill Education. All rights reserved. No reproduction or distribution without the prior written consent of
McGraw-Hill Education.
50. Elm uses the high-low method of estimating costs. Elm had total costs of $250,000 at its
lowest level of activity, when 5,000 units were sold. When, at its highest level of activity, sales
equaled 10,000 units, total costs were $390,000. Elm would estimate variable cost per unit as:
A. $70.00
B. $45.50
D. $52.71
AICPA: FN Measurement
Accessibility: Keyboard Navigation
Blooms: Apply
Difficulty: 2 Medium
Learning Objective: 05-03 Use the high-low method to analyze mixed costs.
Topic: High-low method
51. Cardinal uses the high-low method of estimating costs. Cardinal had total costs of $25,000 at
its lowest level of activity, when 5,000 units were sold. When, at its highest level of activity,
sales equaled 10,000 units, total costs were $39,000. Cardinal would estimate variable cost
per unit as:
A. $7.00
B. $4.55
D. $5.26
AICPA: FN Measurement
Accessibility: Keyboard Navigation
Blooms: Apply
Difficulty: 2 Medium
Learning Objective: 05-03 Use the high-low method to analyze mixed costs.
Topic: High-low method
5-20
Copyright © 2017 McGraw-Hill Education. All rights reserved. No reproduction or distribution without the prior written consent of
McGraw-Hill Education.
52. Sparrow, Inc. used the high-low method to estimate that its fixed costs are $105,000. At its low
level of activity, 50,000 units, average cost was $2.60 per unit. What would Sparrow predict as
its variable cost per unit?
B. $1.55
C. $2.10
D. $2.60
AICPA: FN Measurement
Accessibility: Keyboard Navigation
Blooms: Apply
Difficulty: 3 Hard
Learning Objective: 05-03 Use the high-low method to analyze mixed costs.
Topic: High-low method
53. The high-low method is a cost estimating approach that uses _______________ to find the
cost line.
B. all available data points
C. only four data points
D. personal intuition
AICPA: FN Measurement
Accessibility: Keyboard Navigation
Blooms: Remember
Difficulty: 1 Easy
Learning Objective: 05-03 Use the high-low method to analyze mixed costs.
Topic: High-low method
5-21
Copyright © 2017 McGraw-Hill Education. All rights reserved. No reproduction or distribution without the prior written consent of
McGraw-Hill Education.
54. Ajax uses the high-low method of estimating costs. Ajax had total costs of $50,000 at its lowest
level of activity, when 5,000 units were sold. When, at its highest level of activity, sales
equaled 12,000 units, total costs were $78,000. Ajax would estimate fixed costs as:
A. $28,000
C. $64,000
D. $128,000
AICPA: FN Measurement
Accessibility: Keyboard Navigation
Blooms: Apply
Difficulty: 3 Hard
Learning Objective: 05-03 Use the high-low method to analyze mixed costs.
Topic: High-low method
55. Meadow uses the high-low method. It had total costs of $500,000 at its lowest level of activity
when 5,000 units were sold. When, at its highest level of activity, sales equaled 12,000 units,
total costs were $780,000. Meadow would estimate fixed costs as:
A. $280,000
C. $640,000
D. $1,200,000
AICPA: FN Measurement
Accessibility: Keyboard Navigation
Blooms: Apply
Difficulty: 3 Hard
Learning Objective: 05-03 Use the high-low method to analyze mixed costs.
Topic: High-low method
5-22
Copyright © 2017 McGraw-Hill Education. All rights reserved. No reproduction or distribution without the prior written consent of
McGraw-Hill Education.
56. Lark, which uses the high-low method, had total costs of $25,000 at its lowest level of activity
when 5,000 units were sold. When, at its highest level of activity, sales equaled 12,000 units,
total costs were $39,000. Lark would estimate fixed costs as:
A. $14,000
C. $32,000
D. $60,000
AICPA: FN Measurement
Accessibility: Keyboard Navigation
Blooms: Apply
Difficulty: 3 Hard
Learning Objective: 05-03 Use the high-low method to analyze mixed costs.
Topic: High-low method
57. Holly Co. uses the high-low method. It had an average cost per unit of $10 at its lowest level of
activity when sales equaled 10,000 units and an average cost per unit of $6.50 at its highest
level of activity when sales equaled 20,000 units. Holly would estimate fixed costs as:
B. $16.50
C. $8.25
D. $100,000
AICPA: FN Measurement
Accessibility: Keyboard Navigation
Blooms: Apply
Difficulty: 3 Hard
Learning Objective: 05-03 Use the high-low method to analyze mixed costs.
Topic: High-low method
5-23
Copyright © 2017 McGraw-Hill Education. All rights reserved. No reproduction or distribution without the prior written consent of
McGraw-Hill Education.
58. Palm, which uses the high-low method, had an average cost per unit of $50 at its lowest level
of activity when sales equaled 1,000 units and an average cost per unit of $32.50 at its highest
level of activity when sales equaled 2,000 units. Palm would estimate fixed costs as:
A. $30.00
B. $82.50
C. $17,500
AICPA: FN Measurement
Accessibility: Keyboard Navigation
Blooms: Apply
Difficulty: 3 Hard
Learning Objective: 05-03 Use the high-low method to analyze mixed costs.
Topic: High-low method
59. Cypress, which uses the high-low method, had an average cost per unit of $5 at its lowest
level of activity when sales equaled 10,000 units and an average cost per unit of $3.25 at its
highest level of activity when sales equaled 24,000 units. Cypress would estimate fixed costs
as:
B. $6.25
C. $1.75
D. $50,000
AICPA: FN Measurement
Accessibility: Keyboard Navigation
Blooms: Apply
Difficulty: 3 Hard
Learning Objective: 05-03 Use the high-low method to analyze mixed costs.
Topic: High-low method
5-24
Copyright © 2017 McGraw-Hill Education. All rights reserved. No reproduction or distribution without the prior written consent of
McGraw-Hill Education.
60. Carson, which uses the high-low method, reported total costs of $24 per unit at its lowest
activity level, when production equaled 10,000 units. When production doubled, at its highest
activity level, the total cost per unit dropped to $15. Carson would estimate variable cost per
unit as:
A. $9.00
C. $11.00
D. ($9.00)
AICPA: FN Measurement
Accessibility: Keyboard Navigation
Blooms: Apply
Difficulty: 3 Hard
Learning Objective: 05-03 Use the high-low method to analyze mixed costs.
Topic: High-low method
61. Carson, which uses the high-low method of estimating costs, reported total costs of $24 per
unit when production was at its lowest level, at 10,000 units. When production doubled to its
highest level, the total cost per unit dropped to $15. Carson would estimate its total fixed cost
as:
A. $9
B. $33
D. $585,000
AICPA: FN Measurement
Accessibility: Keyboard Navigation
Blooms: Apply
Difficulty: 3 Hard
Learning Objective: 05-03 Use the high-low method to analyze mixed costs.
Topic: High-low method
5-25
Copyright © 2017 McGraw-Hill Education. All rights reserved. No reproduction or distribution without the prior written consent of
McGraw-Hill Education.

62. Fremont, which uses the high-low method, reported total costs of $10 per unit at its lowest
production level, 5,000 units. When production tripled to its highest level, the total cost per unit
dropped to $5. Fremont would estimate its variable cost per unit as:
B. $5.00
C. $15.00
D. ($5.00)
AICPA: FN Measurement
Accessibility: Keyboard Navigation
Blooms: Apply
Difficulty: 3 Hard
Learning Objective: 05-03 Use the high-low method to analyze mixed costs.
Topic: High-low method
63. Fremont, which uses the high-low method, reported total costs of $10 per unit at its lowest
production level, 5,000 units. When production tripled to its highest level, the total cost per unit
dropped to $5. Fremont would estimate its total fixed cost as:
A. $5
B. $15
C. 50,000
AICPA: FN Measurement
Accessibility: Keyboard Navigation
Blooms: Apply
Difficulty: 3 Hard
Learning Objective: 05-03 Use the high-low method to analyze mixed costs.
Topic: High-low method
5-26
Copyright © 2017 McGraw-Hill Education. All rights reserved. No reproduction or distribution without the prior written consent of
McGraw-Hill Education.
64. McNeil uses the high-low method of estimating costs. McNeil had total costs of $50,000 at its
lowest level of activity, when 5,000 units were sold. When, at its highest level of activity, sales
equaled 12,000 units, total costs were $78,000. What would McNeil estimate its total cost to
be if sales equaled 8,000 units?
A. $32,000
B. $52,000
D. $80,000
AICPA: FN Measurement
Accessibility: Keyboard Navigation
Blooms: Apply
Difficulty: 3 Hard
Learning Objective: 05-03 Use the high-low method to analyze mixed costs.
Topic: High-low method
65. Winston uses the high-low method. It had an average cost per unit of $10 at its lowest level of
activity when sales equaled 10,000 units and an average cost per unit of $6.50 at its highest
level of activity when sales equaled 20,000 units. What would Winston estimate its total cost to
be if sales equaled 8,000 units?
A. $24,000
B. $52,000
C. $70,000
AICPA: FN Measurement
Accessibility: Keyboard Navigation
Blooms: Apply
Difficulty: 3 Hard
Learning Objective: 05-03 Use the high-low method to analyze mixed costs.
Topic: High-low method
5-27
Copyright © 2017 McGraw-Hill Education. All rights reserved. No reproduction or distribution without the prior written consent of
McGraw-Hill Education.
66. Citrus, Inc. used the high-low method to estimate that its fixed costs are $210,000. At its low
level of activity, 100,000 units, average cost was $2.60 per unit. What would Citrus predict its
average cost per unit to be when production is 200,000 units?
A. $1.05
C. $2.60
D. $5.20
AICPA: FN Measurement
Accessibility: Keyboard Navigation
Blooms: Apply
Difficulty: 3 Hard
Learning Objective: 05-03 Use the high-low method to analyze mixed costs.
Topic: High-low method
67. Which of the following statements is correct about the high-low method?
A. The high-low method is complicated to apply.
B. The high-low method is effective for periods in which activity is particularly high or low.
analysis that use a larger number of data points.
D. Generally, managers use the high-low method because it has no drawbacks or limitations.
The high-low method is simple to apply, but it is not effective for periods in which activity falls
outside of the relevant range. Generally, managers can obtain more accurate information from
AICPA: BB Critical Thinking
Accessibility: Keyboard Navigation
Blooms: Understand
Difficulty: 2 Medium
Learning Objective: 05-03 Use the high-low method to analyze mixed costs.
Topic: High-low method
5-28
Copyright © 2017 McGraw-Hill Education. All rights reserved. No reproduction or distribution without the prior written consent of
McGraw-Hill Education.
68. A statistical method for finding the best-fitting cost equation to a set of data is the:
A. scattergraph method.
B. high-low method.
C. visual fit method.
AICPA: FN Measurement
Accessibility: Keyboard Navigation
Blooms: Remember
Difficulty: 1 Easy
Learning Objective: 05-04 Use least-squares regression to analyze mixed costs.
Topic: Least-squares regression method
69. Regression analysis is a cost-estimating approach that uses _______________ to find the
cost line.
A. only two data points
C. only four data points
D. personal intuition
The regression method uses all of the available data to find the best fitting line.
AICPA: FN Measurement
Accessibility: Keyboard Navigation
Blooms: Remember
Difficulty: 1 Easy
Learning Objective: 05-04 Use least-squares regression to analyze mixed costs.
Topic: Least-squares regression method
70. We generally need ___________ data points to get reliable regression results using the least-
squares regression method.
B. six to eight
C. as many as possible
D. only two
AICPA: FN Measurement
Accessibility: Keyboard Navigation
Blooms: Remember
Difficulty: 1 Easy
Learning Objective: 05-04 Use least-squares regression to analyze mixed costs.
5-29
Copyright © 2017 McGraw-Hill Education. All rights reserved. No reproduction or distribution without the prior written consent of
McGraw-Hill Education.
Topic: Least-squares regression method
71. Which of the following is not correct about “R Square” in regression analysis?
A. R Square is a measure of “goodness of fit” of the model.
B. An R Square value of 1.0 indicates a perfect fit of the model.
y.
D. R Square explains how much of the variability in y is explained by
AICPA: FN Measurement
Accessibility: Keyboard Navigation
Blooms: Understand
Difficulty: 2 Medium
Learning Objective: 05-04 Use least-squares regression to analyze mixed costs.
Topic: Least-squares regression method
72. Using the results of the least-squares regression analysis, which value estimates total fixed
costs?
A. R Square
C. X Value
D. Multiple R
AICPA: FN Measurement
Accessibility: Keyboard Navigation
Blooms: Remember
Difficulty: 1 Easy
Learning Objective: 05-04 Use least-squares regression to analyze mixed costs.
Topic: Least-squares regression method
5-30
Copyright © 2017 McGraw-Hill Education. All rights reserved. No reproduction or distribution without the prior written consent of
McGraw-Hill Education.
73. Using the results of the least-squares regression analysis, which value estimates variable cost
per unit?
A. R Square
B. Intercept
D. Multiple R
The regression output provides an estimate of variable cost per unit: The x-coefficient or slope
of the line.
AICPA: FN Measurement
Accessibility: Keyboard Navigation
Blooms: Remember
Difficulty: 1 Easy
Learning Objective: 05-04 Use least-squares regression to analyze mixed costs.
Topic: Least-squares regression method
74. Star, Inc. used Excel to run a least-squares regression analysis, which resulted in the following
output:
Regression Statistics
Multiple R 0.9755
R Square 0.9517
Observations 30
Coefficients Standard
Error
T
Stat
P-
Value
Intercept 175003 61603 2.84 0.021
Production
(X) 11.57 0.9213 12.55 0.000
What is Star’s variable cost per unit?
A. $0.92
B. $2.84
D. $12.55
AICPA: FN Measurement
Accessibility: Keyboard Navigation
Blooms: Understand
Difficulty: 2 Medium
Learning Objective: 05-04 Use least-squares regression to analyze mixed costs.
5-31
Copyright © 2017 McGraw-Hill Education. All rights reserved. No reproduction or distribution without the prior written consent of
McGraw-Hill Education.
Topic: Least-squares regression method
75. Star, Inc. used Excel to run a least-squares regression analysis, which resulted in the following
output:
Regression Statistics
Multiple R 0.9755
R Square 0.9517
Observations 30
Coefficients Standard
Error
T
Stat
P-
Value
Intercept 175003 61603 2.84 0.021
Production
(X) 11.57 0.9213 12.55 0.000
What is Star’s total fixed cost?
A. $61,603
B. $92,130
D. $236,606
AICPA: FN Measurement
Accessibility: Keyboard Navigation
Blooms: Understand
Difficulty: 2 Medium
Learning Objective: 05-04 Use least-squares regression to analyze mixed costs.
Topic: Least-squares regression method
5-32
Copyright © 2017 McGraw-Hill Education. All rights reserved. No reproduction or distribution without the prior written consent of
McGraw-Hill Education.
76. Star, Inc. used Excel to run a least-squares regression analysis, which resulted in the following
output:
Regression Statistics
Multiple R 0.9755
R Square 0.9517
Observations 30
Coefficients Standard
Error
T
Stat
P-
Value
Intercept 175003 61603 2.84 0.021
Production
(X) 11.57 0.9213 12.55 0.000
What is Star’s formula for estimating costs?
B. Total cost = $61,603 + ($0.92 × Production)
C. Total cost = $175,003 + ($61,603 × Production)
D. Total cost = $11.57 + ($0.9213 × Production)
AICPA: FN Measurement
Accessibility: Keyboard Navigation
Blooms: Apply
Difficulty: 2 Medium
Learning Objective: 05-04 Use least-squares regression to analyze mixed costs.
Topic: Least-squares regression method
5-33
Copyright © 2017 McGraw-Hill Education. All rights reserved. No reproduction or distribution without the prior written consent of
McGraw-Hill Education.
77. Star, Inc. used Excel to run a least-squares regression analysis, which resulted in the following
output:
Regression Statistics
Multiple R 0.9755
R Square 0.9517
Observations 30
Coefficients Standard
Error
T
Stat
P-
Value
Intercept 175003 61603 2.84 0.021
Production
(X) 11.57 0.9213 12.55 0.000
How much of the variation in cost is explained by production?
A. It is impossible to determine.
B. 92.13%
D. 97.55%
AICPA: FN Measurement
Accessibility: Keyboard Navigation
Blooms: Understand
Difficulty: 2 Medium
Learning Objective: 05-04 Use least-squares regression to analyze mixed costs.
Topic: Least-squares regression method
5-34
Copyright © 2017 McGraw-Hill Education. All rights reserved. No reproduction or distribution without the prior written consent of
McGraw-Hill Education.
78. Star, Inc. used Excel to run a least-squares regression analysis, which resulted in the following
output:
Regression Statistics
Multiple R 0.9755
R Square 0.9517
Observations 30
Coefficients Standard
Error
T
Stat
P-
Value
Intercept 175003 61603 2.84 0.021
Production
(X) 11.57 0.9213 12.55 0.000
How much of the variation in cost is not explained by production?
A. It is impossible to determine.
C. 7.87%
D. 2.45%
R Square tells us that 95.17% of variation in cost is explained by production, so 100% –
95.17% = 4.83% is not explained by production.
AACSB: Analytical Thinking
AICPA: FN Measurement
Accessibility: Keyboard Navigation
Blooms: Understand
Difficulty: 2 Medium
Learning Objective: 05-04 Use least-squares regression to analyze mixed costs.
Topic: Least-squares regression method
5-35
Copyright © 2017 McGraw-Hill Education. All rights reserved. No reproduction or distribution without the prior written consent of
McGraw-Hill Education.
79. Star, Inc. used Excel to run a least-squares regression analysis, which resulted in the following
output:
Regression Statistics
Multiple R 0.9755
R Square 0.9517
Observations 30
Coefficients Standard
Error
T
Stat
P-
Value
Intercept 175003 61603 2.84 0.021
Production
(X) 11.57 0.9213 12.55 0.000
What total cost would Star predict for a month in which production is 2,000 units?
A. $23,140
B. $63,446
C. $175,003
AICPA: FN Measurement
Accessibility: Keyboard Navigation
Blooms: Apply
Difficulty: 3 Hard
Learning Objective: 05-04 Use least-squares regression to analyze mixed costs.
Topic: Least-squares regression method
80. Total contribution margin is defined as:
A. selling price times units sold.
B. cost to produce times units sold.
D. total variable costs less fixed costs.
AICPA: FN Measurement
Accessibility: Keyboard Navigation
Blooms: Remember
Difficulty: 1 Easy
Learning Objective: 05-05 Prepare and interpret a contribution margin income statement.
Topic: Contribution margin approach
5-36
Copyright © 2017 McGraw-Hill Education. All rights reserved. No reproduction or distribution without the prior written consent of
McGraw-Hill Education.
81. Total contribution margin is equal to:
A. total sales less fixed costs.
C. variable costs plus net operating income.
D. total sales less net operating income.
AICPA: FN Measurement
Accessibility: Keyboard Navigation
Blooms: Understand
Difficulty: 2 Medium
Learning Objective: 05-05 Prepare and interpret a contribution margin income statement.
Topic: Contribution margin approach
82. Orchid Corp. has a selling price of $15, variable costs of $10 per unit, and fixed costs of
$25,000. If Orchid sells 13,000 units, contribution margin will equal:
A. $195,000
B. $145,000
C. $40,000
AICPA: FN Measurement
Accessibility: Keyboard Navigation
Blooms: Apply
Difficulty: 2 Medium
Learning Objective: 05-05 Prepare and interpret a contribution margin income statement.
Topic: Contribution margin approach
83. Jasmine Corp. has a selling price of $15, variable costs of $10 per unit, and fixed costs of
$25,000. Contribution margin is $85,000. How many units did Jasmine sell?
A. 7,000
B. 10,000
C. 13,000
AICPA: FN Measurement
Accessibility: Keyboard Navigation
Blooms: Apply
5-37
Copyright © 2017 McGraw-Hill Education. All rights reserved. No reproduction or distribution without the prior written consent of
McGraw-Hill Education.
Difficulty: 2 Medium
Learning Objective: 05-05 Prepare and interpret a contribution margin income statement.
Topic: Contribution margin approach
84. Gardenia Corp. has a selling price of $15, fixed costs of $25,000, and contribution margin of
$65,000. If Gardenia sells 13,000 units, how much are variable costs per unit?
A. $2.00
B. $5.00
C. $7.00
AICPA: FN Measurement
Accessibility: Keyboard Navigation
Blooms: Apply
Difficulty: 2 Medium
Learning Objective: 05-05 Prepare and interpret a contribution margin income statement.
Topic: Contribution margin approach
85. Rose Corp. has contribution margin of $65,000, variable costs of $10 per unit, and fixed costs
of $25,000. If Rose sells 13,000 units, what was the selling price per unit?
A. $5.00
B. $12.50
D. $17.08
AICPA: FN Measurement
Accessibility: Keyboard Navigation
Blooms: Apply
Difficulty: 2 Medium
Learning Objective: 05-05 Prepare and interpret a contribution margin income statement.
Topic: Contribution margin approach
5-38
Copyright © 2017 McGraw-Hill Education. All rights reserved. No reproduction or distribution without the prior written consent of
McGraw-Hill Education.
86. Fixed costs are expressed _____________ because that is the amount of cost that is truly
fixed.
A. on a per unit basis
C. on a per unit basis within the relevant range
D. as a percentage of sales
AICPA: BB Critical Thinking
Accessibility: Keyboard Navigation
Blooms: Understand
Difficulty: 2 Medium
Learning Objective: 05-04 Use least-squares regression to analyze mixed costs.
Topic: Contribution margin approach
87. The unit contribution margin:
A. equals total sales revenue minus total variable costs.
B. equals total contribution margin times total units.
profit.
D. equals overall profit per unit.
Unit contribution margin tells us how much each additional unit sold will contribute to the
bottom line.
AICPA: FN Measurement
Accessibility: Keyboard Navigation
Blooms: Remember
Difficulty: 1 Easy
Learning Objective: 05-05 Prepare and interpret a contribution margin income statement.
Topic: Unit contribution margin
88. Maple Corp. has a selling price of $20, variable costs of $15 per unit, and fixed costs of
$25,000. Maple expects profit of $300,000 at its anticipated level of production. What is
Maple’s unit contribution margin?
B. $10.00
C. $27.50
D. $20.00
5-39
Copyright © 2017 McGraw-Hill Education. All rights reserved. No reproduction or distribution without the prior written consent of
McGraw-Hill Education.
AICPA: FN Measurement
Accessibility: Keyboard Navigation
Blooms: Apply
Difficulty: 1 Easy
Learning Objective: 05-05 Prepare and interpret a contribution margin income statement.
Topic: Unit contribution margin
89. Sugar Corp. has a selling price of $20, variable costs of $12 per unit, and fixed costs of
$25,000. Maple expects profit of $300,000 at its anticipated level of production. If Sugar sells
5,000 units more than expected, how much higher will its profits be?
B. $100,000
C. $60,000
D. $300,000
AICPA: FN Measurement
Accessibility: Keyboard Navigation
Blooms: Apply
Difficulty: 3 Hard
Learning Objective: 05-05 Prepare and interpret a contribution margin income statement.
Topic: Unit contribution margin
90. Kent Corp. has fixed costs of $25,000. Kent expects net operating income of $300,000 at its
anticipated level of production, 65,000 units. What is Kent’s unit contribution margin?
B. $10.00
C. $27.50
D. $20.00
AICPA: FN Measurement
Accessibility: Keyboard Navigation
Blooms: Apply
Difficulty: 3 Hard
Learning Objective: 05-05 Prepare and interpret a contribution margin income statement.
Topic: Unit contribution margin
5-40
Copyright © 2017 McGraw-Hill Education. All rights reserved. No reproduction or distribution without the prior written consent of
McGraw-Hill Education.
91. A grocery store wants to encourage its customers to bring their own shopping bags, thus
saving the store money on purchasing plastic or paper bags and saving the environment in the
process. For an Earth Day promotion, the store gives away free canvas bags and engages in
a substantial advertising campaign to highlight the initiative. Then, the store rewards
customers who bring their own bags with a 5% discount on all future shopping trips. Which of
the following is not a way this initiative might be reflected in the grocery store’s contribution
margin income statement?
sustainability accounting.
B. The store’s fixed costs would increase to account for the promotional materials and the
fixed costs of providing free bags to customers.
C. The store’s sales revenue would decrease to reflect the discounts given to customers who
bring their own bags.
D. The store’s variable costs would decrease to reflect the reduced cost of providing paper or
AICPA: BB Resource Management
Accessibility: Keyboard Navigation
Blooms: Understand
Difficulty: 2 Medium
Learning Objective: 05-05 Prepare and interpret a contribution margin income statement.
Topic: Unit contribution margin
92. The contribution margin ratio is:
B. the contribution margin stated as a percentage of profit.
C. the contribution margin stated as a percentage of total costs.
D. the contribution margin stated as a percentage of fixed costs.
AICPA: FN Measurement
Accessibility: Keyboard Navigation
Blooms: Remember
Difficulty: 1 Easy
Learning Objective: 05-05 Prepare and interpret a contribution margin income statement.
Topic: Contribution margin ratio
5-41
Copyright © 2017 McGraw-Hill Education. All rights reserved. No reproduction or distribution without the prior written consent of
McGraw-Hill Education.
93. The contribution margin ratio is:
A. the difference between sales revenue and variable costs.
B. the difference between variable costs and fixed costs.
C. variable costs divided by fixed costs.
AICPA: FN Measurement
Accessibility: Keyboard Navigation
Blooms: Understand
Difficulty: 2 Medium
Learning Objective: 05-05 Prepare and interpret a contribution margin income statement.
Topic: Contribution margin ratio
94. Knox Corp. has a selling price of $20, variable costs of $14 per unit, and fixed costs of
$25,000. If Knox sells 12,000 units, the contribution margin ratio will equal:
A. $60,000
C. 70%
D. 10.4%
AICPA: FN Measurement
Accessibility: Keyboard Navigation
Blooms: Apply
Difficulty: 2 Medium
Learning Objective: 05-05 Prepare and interpret a contribution margin income statement.
Topic: Contribution margin ratio
95. Booble, Inc. has a contribution margin ratio of 45%. This month, sales revenue was $200,000,
and profit was $40,000. How much are Booble’s fixed costs?
A. $18,000
B. $45,000
D. $90,000
AICPA: FN Measurement
Accessibility: Keyboard Navigation
Blooms: Apply
5-42
Copyright © 2017 McGraw-Hill Education. All rights reserved. No reproduction or distribution without the prior written consent of
McGraw-Hill Education.
Difficulty: 3 Hard
Learning Objective: 05-05 Prepare and interpret a contribution margin income statement.
Topic: Contribution margin ratio
96. Laredo, Inc. has a contribution margin ratio of 45%. This month, sales revenue was $200,000,
and profit was $40,000. If sales revenue increases by $20,000, by how much will profit
increase?
A. $1,800
B. $4,500
C. $5,000
The contribution margin ratio (45%) multiplied by the increase to sales revenue ($20,000) tells
us how much profit will increase. ($20,000 × 45% = $9,000)
AICPA: FN Measurement
Accessibility: Keyboard Navigation
Blooms: Apply
Difficulty: 2 Medium
Learning Objective: 05-05 Prepare and interpret a contribution margin income statement.
Topic: Contribution margin ratio
97. Rodeo, Inc. has a contribution margin ratio of 45%. This month, profit was $40,000 and fixed
costs were $50,000. How much was Laredo’s sales revenue?
A. $40,500
B. $90,000
C. $111,111
AICPA: FN Measurement
Accessibility: Keyboard Navigation
Blooms: Apply
Difficulty: 3 Hard
Learning Objective: 05-05 Prepare and interpret a contribution margin income statement.
Topic: Contribution margin ratio
5-43
Copyright © 2017 McGraw-Hill Education. All rights reserved. No reproduction or distribution without the prior written consent of
McGraw-Hill Education.
98. What is the difference between full absorption costing and variable costing?
A. In full absorption costing, all of the non-manufacturing costs are expensed. In variable
costing, all of the non-manufacturing expenses are included in the cost of the product.
B. In full absorption costing, fixed manufacturing overhead is expensed. In variable costing,
fixed manufacturing overhead is included in the cost of the product.
product. In variable costing, fixed manufacturing overhead is expensed.
D. Variable costing must be used for external financial reports while full absorption costing
can only be used for internal reporting.
In absorption costing, manufacturing overhead is absorbed into the cost of the product (i.e.
AICPA: FN Measurement
Accessibility: Keyboard Navigation
Blooms: Understand
Difficulty: 2 Medium
Learning Objective: 05-S1 Compare variable costing to full absorption costing.
Topic: Variable versus full absorption costing
99. Profit will be the same under variable costing as under full absorption costing whenever:
A. the number of units produced is greater than the number of units sold.
C. the number of units produced is less than the number of units sold.
AICPA: FN Measurement
Accessibility: Keyboard Navigation
Blooms: Remember
Difficulty: 1 Easy
Learning Objective: 05-S1 Compare variable costing to full absorption costing.
Topic: Variable versus full absorption costing
5-44
Copyright © 2017 McGraw-Hill Education. All rights reserved. No reproduction or distribution without the prior written consent of
McGraw-Hill Education.
100. The difference between variable costing and full absorption costing is due to differences in the
treatment of:
A. direct costs.
B. variable manufacturing overhead.
C. fixed manufacturing overhead.
AICPA: FN Measurement
Accessibility: Keyboard Navigation
Blooms: Remember
Difficulty: 1 Easy
Learning Objective: 05-S1 Compare variable costing to full absorption costing.
Topic: Variable versus full absorption costing
5-45
Copyright © 2017 McGraw-Hill Education. All rights reserved. No reproduction or distribution without the prior written consent of
McGraw-Hill Education.
101. Jasper Enterprises had the following cost and production information for April:
Units Produced 20,000
Units Sold 17,000
Unit Sales Price $200
Manufacturing Cost Per Unit
Direct Material $50
Direct Labor $25
Variable Manufacturing
Overhead $10
Fixed Manufacturing
Overhead
($400,000/20,000) =
$20
Full Manufacturing Cost Per
Unit $105
Nonmanufacturing Costs
Variable Selling Expenses $80,000
Fixed General and
Administrative Costs $75,000
What is Jasper Enterprise’s income under absorption costing?
A. $1,400,000
C. $1,745,000
D. $1,785,000
Calculate sales revenue as the unit sales price times by the number of units sold. ($200 ×
17,000) Subtract variable costs (manufacturing costs per unit times the number of units sold
and variable selling expenses) from sales revenue. ($105 × 17,000 – $80,000) Subtract fixed
AICPA: FN Measurement
Accessibility: Keyboard Navigation
Blooms: Apply
Difficulty: 3 Hard
Learning Objective: 05-S1 Compare variable costing to full absorption costing.
Topic: Variable versus full absorption costing
5-46
Copyright © 2017 McGraw-Hill Education. All rights reserved. No reproduction or distribution without the prior written consent of
McGraw-Hill Education.
102. Jasper Enterprises had the following cost and production information for April:
Units Produced 20,000
Units Sold 17,000
Unit Sales Price $200
Manufacturing Cost Per Unit
Direct Material $50
Direct Labor $25
Variable Manufacturing
Overhead $10
Fixed Manufacturing
Overhead
($400,000/20,000) =
$20
Full Manufacturing Cost Per
Unit $105
Nonmanufacturing Costs
Variable Selling Expenses $80,000
Fixed General and
Administrative Costs $75,000
What is Jasper Enterprise’s income under variable costing?
B. $1,460,000
C. $1,745,000
D. $1,785,000
Calculate sales revenue as the unit sales price times by the number of units sold. ($200 ×
17,000) Subtract variable costs (manufacturing costs per unit times the number of units sold
and variable selling expenses) from sales revenue. ($85 × 17,000 – $80,000) Subtract fixed
AICPA: FN Measurement
Accessibility: Keyboard Navigation
Blooms: Apply
Difficulty: 3 Hard
Learning Objective: 05-S1 Compare variable costing to full absorption costing.
Topic: Variable versus full absorption costing
5-47
Copyright © 2017 McGraw-Hill Education. All rights reserved. No reproduction or distribution without the prior written consent of
McGraw-Hill Education.
103. Jasper Enterprises had the following cost and production information for April:
Units Produced 20,000
Units Sold 17,000
Unit Sales Price $200
Manufacturing Cost Per Unit
Direct Material $50
Direct Labor $25
Variable Manufacturing
Overhead $10
Fixed Manufacturing
Overhead
($400,000/20,000) =
$20
Full Manufacturing Cost Per
Unit $105
Nonmanufacturing Costs
Variable Selling Expenses $80,000
Fixed General and
Administrative Costs $75,000
How much greater will Jasper Enterprises’ income be under absorption costing than under
variable costing?
B. $315,000
C. $340,000
D. $400,000
AICPA: FN Measurement
Accessibility: Keyboard Navigation
Blooms: Apply
Difficulty: 3 Hard
Learning Objective: 05-S1 Compare variable costing to full absorption costing.
Topic: Variable versus full absorption costing
5-48
Copyright © 2017 McGraw-Hill Education. All rights reserved. No reproduction or distribution without the prior written consent of
McGraw-Hill Education.
104. If the number of units sold is the same every month, the profit from these units will be the
same every month if:
A. absorption costing is used.
C. production is greater than sales.
D. sales is greater than production.
AICPA: FN Measurement
Accessibility: Keyboard Navigation
Blooms: Understand
Difficulty: 2 Medium
Learning Objective: 05-S1 Compare variable costing to full absorption costing.
Topic: Variable versus full absorption costing
105. If a firm uses absorption costing, which of the following actions taken by management would
increase gross profit even if sales do not increase?
A. Decreasing production and using items from inventory for sales.
C. Increasing fixed costs by investing in new production technology.
D. Increasing variable costs by purchasing higher-quality materials.
AICPA: FN Measurement
Accessibility: Keyboard Navigation
Blooms: Analyze
Difficulty: 3 Hard
Learning Objective: 05-S1 Compare variable costing to full absorption costing.
Topic: Variable versus full absorption costing
5-49
Copyright © 2017 McGraw-Hill Education. All rights reserved. No reproduction or distribution without the prior written consent of
McGraw-Hill Education.
106. Flint Enterprises had the following cost and production information for April:
Units Produced 20,000
Unit Sales Price $200
Manufacturing Cost Per Unit
Direct Material $50
Direct Labor $25
Variable Manufacturing
Overhead $10
Fixed Manufacturing
Overhead
($400,000/20,000) =
$20
Full Manufacturing Cost Per
Unit $105
Nonmanufacturing Costs
Variable Selling Expenses $80,000
Fixed General and
Administrative Costs $75,000
Inventory increased by 3,000 units during April. What is Flint Enterprise’s income under
absorption costing?
A. $1,400,000
C. $1,745,000
D. $1,785,000
Units sold is the difference between units produced and the increase in inventory. (20,000 –
3,000 = 17,000) Calculate sales revenue as the unit sales price times by the number of units
sold. ($200 × 17,000) Subtract variable costs (manufacturing costs per unit times the number
of units sold and variable selling expenses) from sales revenue. ($105 × 17,000 – $80,000)
AICPA: FN Measurement
Accessibility: Keyboard Navigation
Blooms: Apply
Difficulty: 3 Hard
Learning Objective: 05-S1 Compare variable costing to full absorption costing.
Topic: Variable versus full absorption costing
5-50
Copyright © 2017 McGraw-Hill Education. All rights reserved. No reproduction or distribution without the prior written consent of
McGraw-Hill Education.
107. Flint Enterprises had the following cost and production information for April:
Units Produced 20,000
Unit Sales Price $200
Manufacturing Cost Per Unit
Direct Material $50
Direct Labor $25
Variable Manufacturing
Overhead $10
Fixed Manufacturing
Overhead
($400,000/20,000) =
$20
Full Manufacturing Cost Per
Unit $105
Nonmanufacturing Costs
Variable Selling Expenses $80,000
Fixed General and
Administrative Costs $75,000
Inventory increased by 3,000 units during April. What is Flint Enterprise’s income under
variable costing?
B. $1,460,000
C. $1,745,000
D. $1,785,000
Units sold is the difference between units produced and the increase in inventory. (20,000 –
3,000 = 17,000) Calculate sales revenue as the unit sales price times by the number of units
sold. ($200 × 17,000) Subtract variable costs (manufacturing costs per unit times the number
of units sold and variable selling expenses) from sales revenue. ($85 × 17,000 – $80,000)
AICPA: FN Measurement
Accessibility: Keyboard Navigation
Blooms: Apply
Difficulty: 3 Hard
Learning Objective: 05-S1 Compare variable costing to full absorption costing.
Topic: Variable versus full absorption costing
5-51
Copyright © 2017 McGraw-Hill Education. All rights reserved. No reproduction or distribution without the prior written consent of
McGraw-Hill Education.
108. Flint Enterprises had the following cost and production information for April:
Units Produced 20,000
Unit Sales Price $200
Manufacturing Cost Per Unit
Direct Material $50
Direct Labor $25
Variable Manufacturing
Overhead $10
Fixed Manufacturing
Overhead
($400,000/20,000) =
$20
Full Manufacturing Cost Per
Unit $105
Nonmanufacturing Costs
Variable Selling Expenses $80,000
Fixed General and
Administrative Costs $75,000
Inventory increased by 3,000 units during April. How much greater will Flint Enterprises’
income be under absorption costing than under variable costing?
B. $315,000
C. $340,000
D. $400,000
AICPA: FN Measurement
Accessibility: Keyboard Navigation
Blooms: Apply
Difficulty: 3 Hard
Learning Objective: 05-S1 Compare variable costing to full absorption costing.
Topic: Variable versus full absorption costing
5-52
Copyright © 2017 McGraw-Hill Education. All rights reserved. No reproduction or distribution without the prior written consent of
McGraw-Hill Education.
109. Which of the following statements is correct about the difference between contribution margin
and gross margin?
A. Contribution margin and gross margin are equivalent.
B. Contribution margin is the difference between sales revenue and cost of goods sold.
C. Gross margin is the difference between sales revenue and variable costs.
reporting.
Contribution margin and gross margin are not the same. Contribution margin is the difference
AICPA: BB Critical Thinking
Accessibility: Keyboard Navigation
Blooms: Understand
Difficulty: 2 Medium
Learning Objective: 05-S1 Compare variable costing to full absorption costing.
Topic: Variable versus full absorption costing
Essay Questions
5-53
Copyright © 2017 McGraw-Hill Education. All rights reserved. No reproduction or distribution without the prior written consent of
McGraw-Hill Education.
110. Chill Out Novelties sells ice cream bars from a kiosk near campus. Fixed costs are $200 per
week and the variable cost is $0.50 per ice cream bar. Complete the following table for the
levels of ice cream bars sold per week. Round your answers to two decimal places.
Number of ice cream bars 400 800 1,200
Total fixed cost
Fixed cost per bar
Variable cost per bar
Total variable cost
Total cost
Cost per bar
AICPA: FN Measurement
Blooms: Apply
Difficulty: 2 Medium
Learning Objective: 05-01 Identify costs as variable, fixed, step, or mixed.
Topic: Fixed costs
Topic: Variable costs
5-54
Copyright © 2017 McGraw-Hill Education. All rights reserved. No reproduction or distribution without the prior written consent of
McGraw-Hill Education.
111. Boxwood Company sells wooden boxes from a kiosk in a mall. Fixed costs are $2,500 per
month and the variable cost is $2.75 per item. Complete the following table for the levels of
units sold.
Number of units 100 1,000 10,000
Total fixed cost
Fixed cost per unit
Variable cost per unit
Total variable cost
Total cost
Cost per unit
AICPA: FN Measurement
Blooms: Apply
Difficulty: 2 Medium
Learning Objective: 05-01 Identify costs as variable, fixed, step, or mixed.
Topic: Fixed costs
Topic: Variable costs
5-55
Copyright © 2017 McGraw-Hill Education. All rights reserved. No reproduction or distribution without the prior written consent of
McGraw-Hill Education.
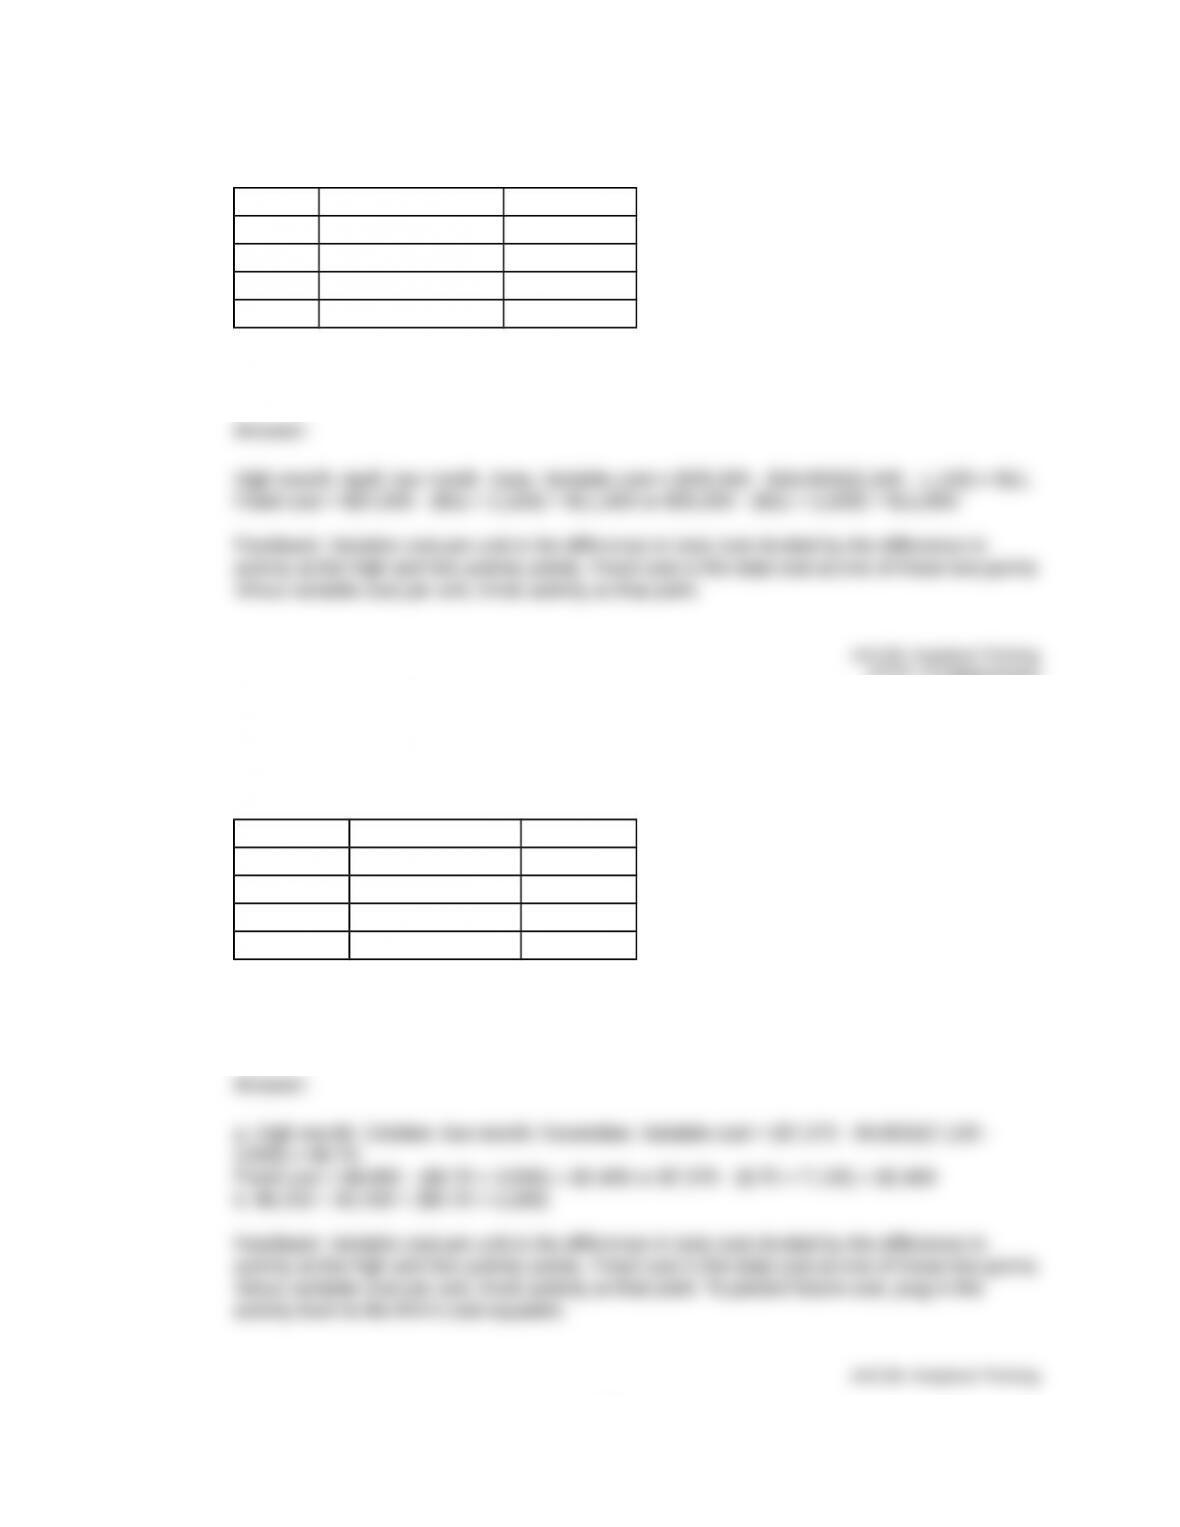
112. Bayshore, Inc., has collected the following cost data for various levels of activity:
Month Clients Served Total Cost
April 2,100 $35,000
May 1,750 $31,200
June 1,100 $24,000
July 1,500 $28,500
Using the high-low method, determine the variable cost per client served and the total fixed
cost.
AICPA: FN Measurement
Blooms: Apply
Difficulty: 2 Medium
Learning Objective: 05-03 Use the high-low method to analyze mixed costs.
Topic: High-low method
113. Harbor Images has collected the following cost data for various levels of activity:
Month Images Created Total Cost
August 5,000 $5,500
September 6,750 $6,120
October 7,100 $7,370
November 3,500 $4,850
a. Using the high-low method, determine the variable cost per image created and the total
fixed cost.
b. Estimate the total costs when 5,500 images are created.
5-56
Copyright © 2017 McGraw-Hill Education. All rights reserved. No reproduction or distribution without the prior written consent of
McGraw-Hill Education.
AICPA: FN Measurement
Blooms: Apply
Difficulty: 2 Medium
Learning Objective: 05-03 Use the high-low method to analyze mixed costs.
Topic: High-low method
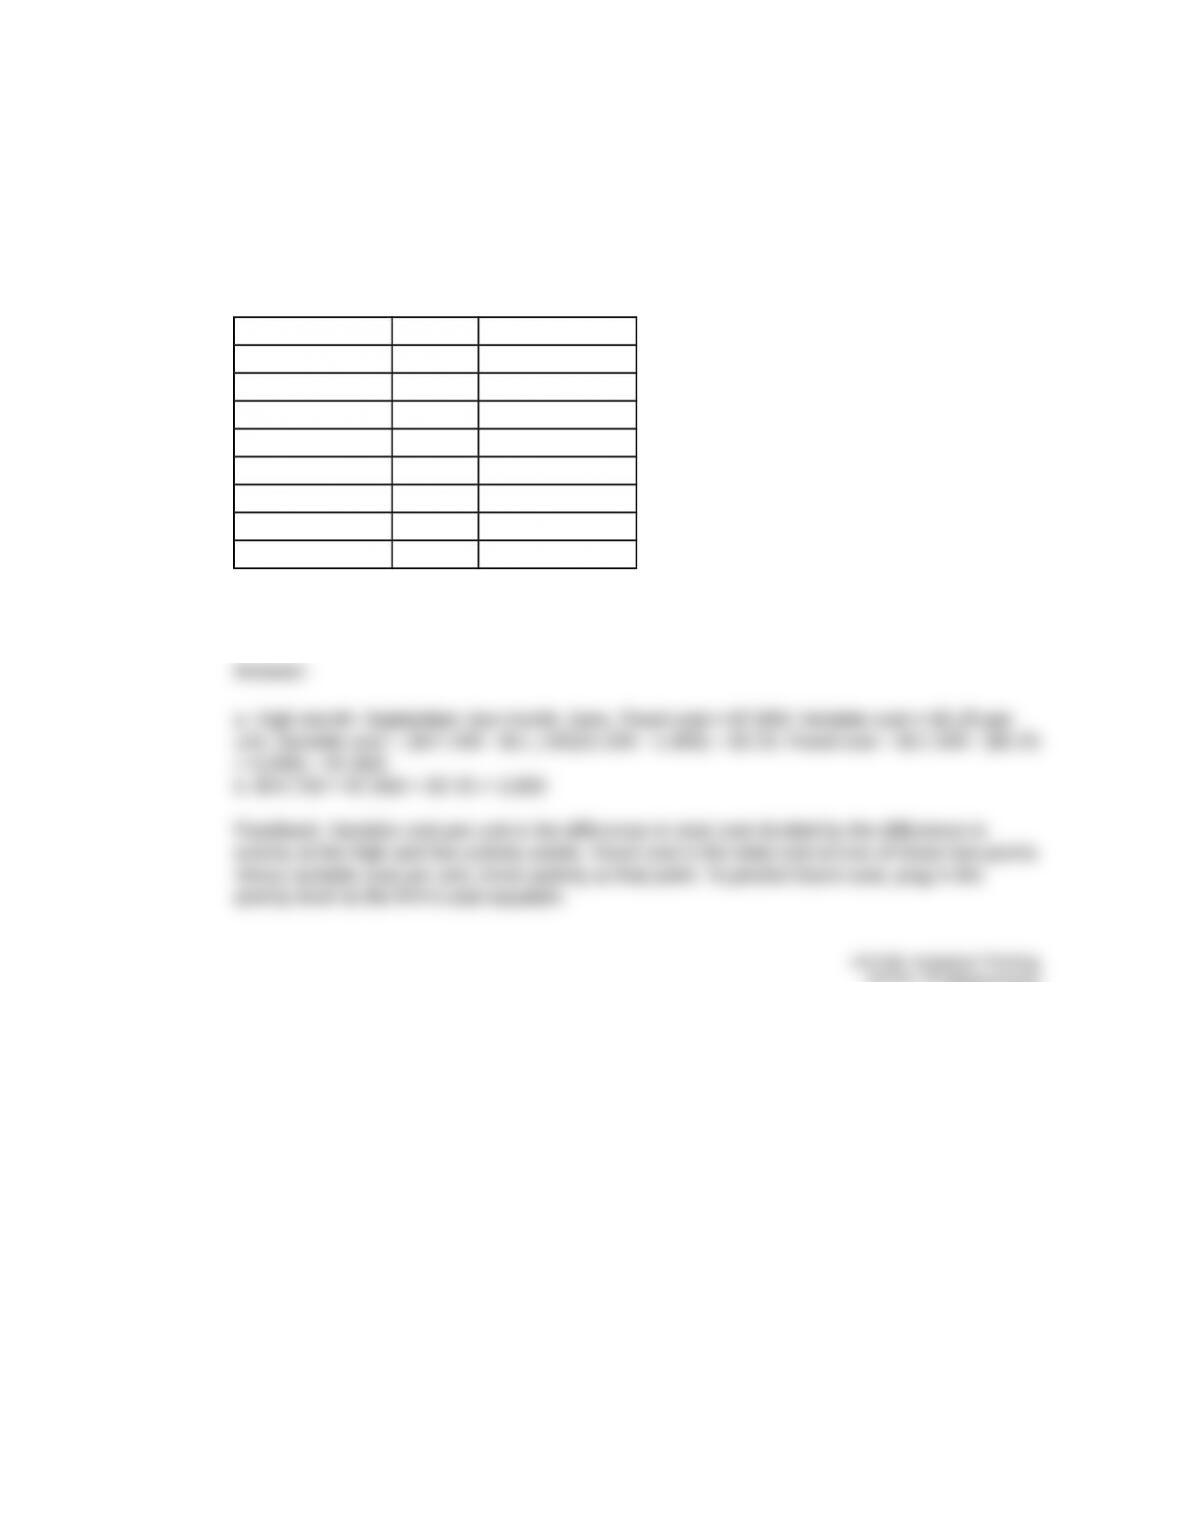
114. Island Enterprises has presented the following information for the past eight months
operations:
Month Units Total Cost
April 4,000 $17,000
May 3,200 $14,900
June 1,400 $11,100
July 2,800 $13,200
August 3,500 $16,000
September 4,200 $17,400
October 3,900 $16,500
November 3,400 $15,700
a. Using the high-low method, calculate the fixed cost per month and variable cost per unit.
b. What would total costs be for a month with 3,000 units produced?
AICPA: FN Measurement
Blooms: Apply
Difficulty: 2 Medium
Learning Objective: 05-03 Use the high-low method to analyze mixed costs.
Topic: High-low method
5-57
Copyright © 2017 McGraw-Hill Education. All rights reserved. No reproduction or distribution without the prior written consent of
McGraw-Hill Education.
115. Silver Products has presented the following information for the past eight months operations:
Month Units Total Cost
April 8,000 $27,400
May 6,400 $25,800
June 3,800 $18,300
July 5,600 $23,200
August 7,000 $26,000
September 8,400 $29,800
October 7,800 $26,500
November 6.800 $25,700
a. Using the high-low method, calculate the fixed cost per month and variable cost per unit.
b. What would total costs be for a month with 5,000 units produced?
AICPA: FN Measurement
Blooms: Apply
Difficulty: 2 Medium
Learning Objective: 05-03 Use the high-low method to analyze mixed costs.
Topic: High-low method
5-58
Copyright © 2017 McGraw-Hill Education. All rights reserved. No reproduction or distribution without the prior written consent of
McGraw-Hill Education.
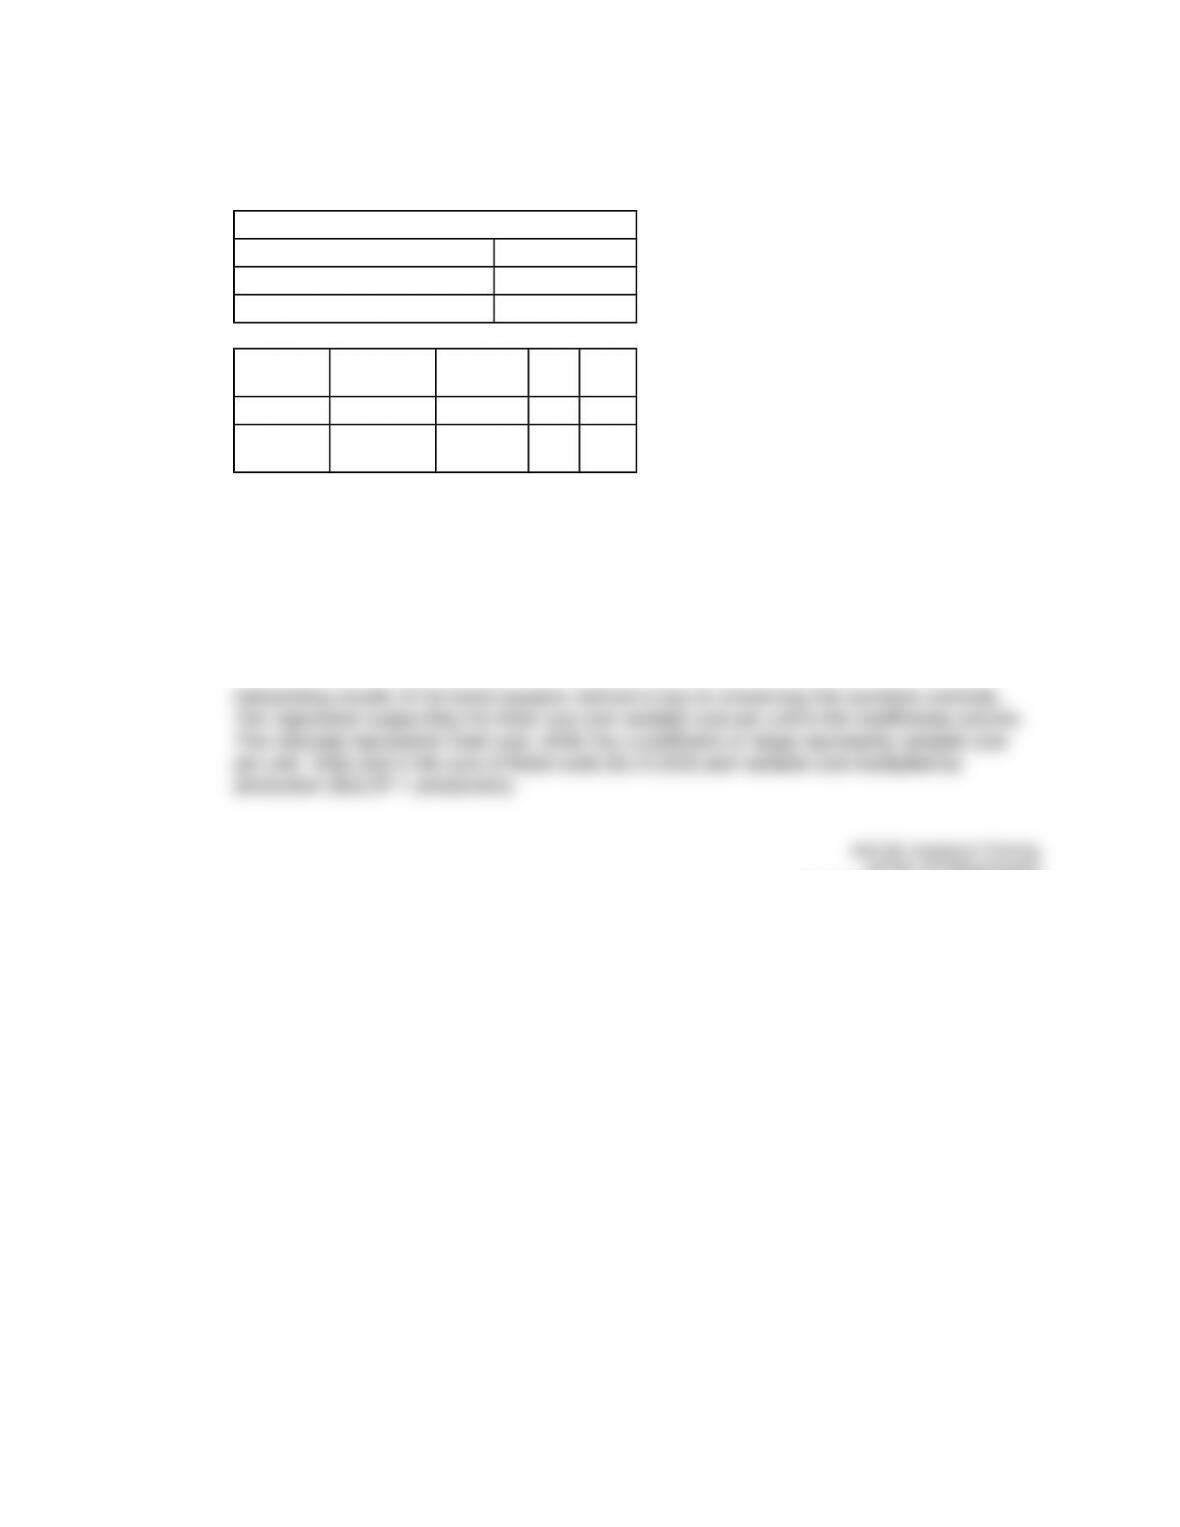
116. Royal Enterprises has presented the following information for the past three months
operations:
Month Units Average Cost
June 2,400 $10.00
July 4,800 $6.00
August 6,000 $5.20
a. Using the high-low method, calculate the fixed cost per month and variable cost per unit.
b. What would total costs be for a month with 5,000 units produced?
AICPA: FN Measurement
Blooms: Apply
Difficulty: 3 Hard
Learning Objective: 05-03 Use the high-low method to analyze mixed costs.
Topic: High-low method
5-59
Copyright © 2017 McGraw-Hill Education. All rights reserved. No reproduction or distribution without the prior written consent of
McGraw-Hill Education.
117. Sugarloaf Enterprises has presented the following information for the past three months
operations:
Month Units Average Cost
June 1,400 $8.00
July 2,800 $5.50
August 3,500 $5.00
a. Using the high-low method, calculate the fixed cost per month and variable cost per unit.
b. What would total costs be for a month with 3,000 units produced?
AICPA: FN Measurement
Blooms: Apply
Difficulty: 3 Hard
Learning Objective: 05-03 Use the high-low method to analyze mixed costs.
Topic: High-low method
5-60
Copyright © 2017 McGraw-Hill Education. All rights reserved. No reproduction or distribution without the prior written consent of
McGraw-Hill Education.

118. Bronze Products has presented the following information for the past eight months operations:
Month Units Total Cost
April 8,000 $30,400
May 6,400 $25,800
June 3,800 $18,300
July 5,600 $23,200
August 7,000 $26,000
September 8,400 $29,800
October 7,800 $26,500
November 6.800 $25,700
a. Using the high-low method, calculate the fixed cost per month and variable cost per unit.
b. What would total costs be for a month with 5,000 units produced?
AICPA: FN Measurement
Blooms: Apply
Difficulty: 3 Hard
Learning Objective: 05-03 Use the high-low method to analyze mixed costs.
Topic: High-low method
5-61
Copyright © 2017 McGraw-Hill Education. All rights reserved. No reproduction or distribution without the prior written consent of
McGraw-Hill Education.
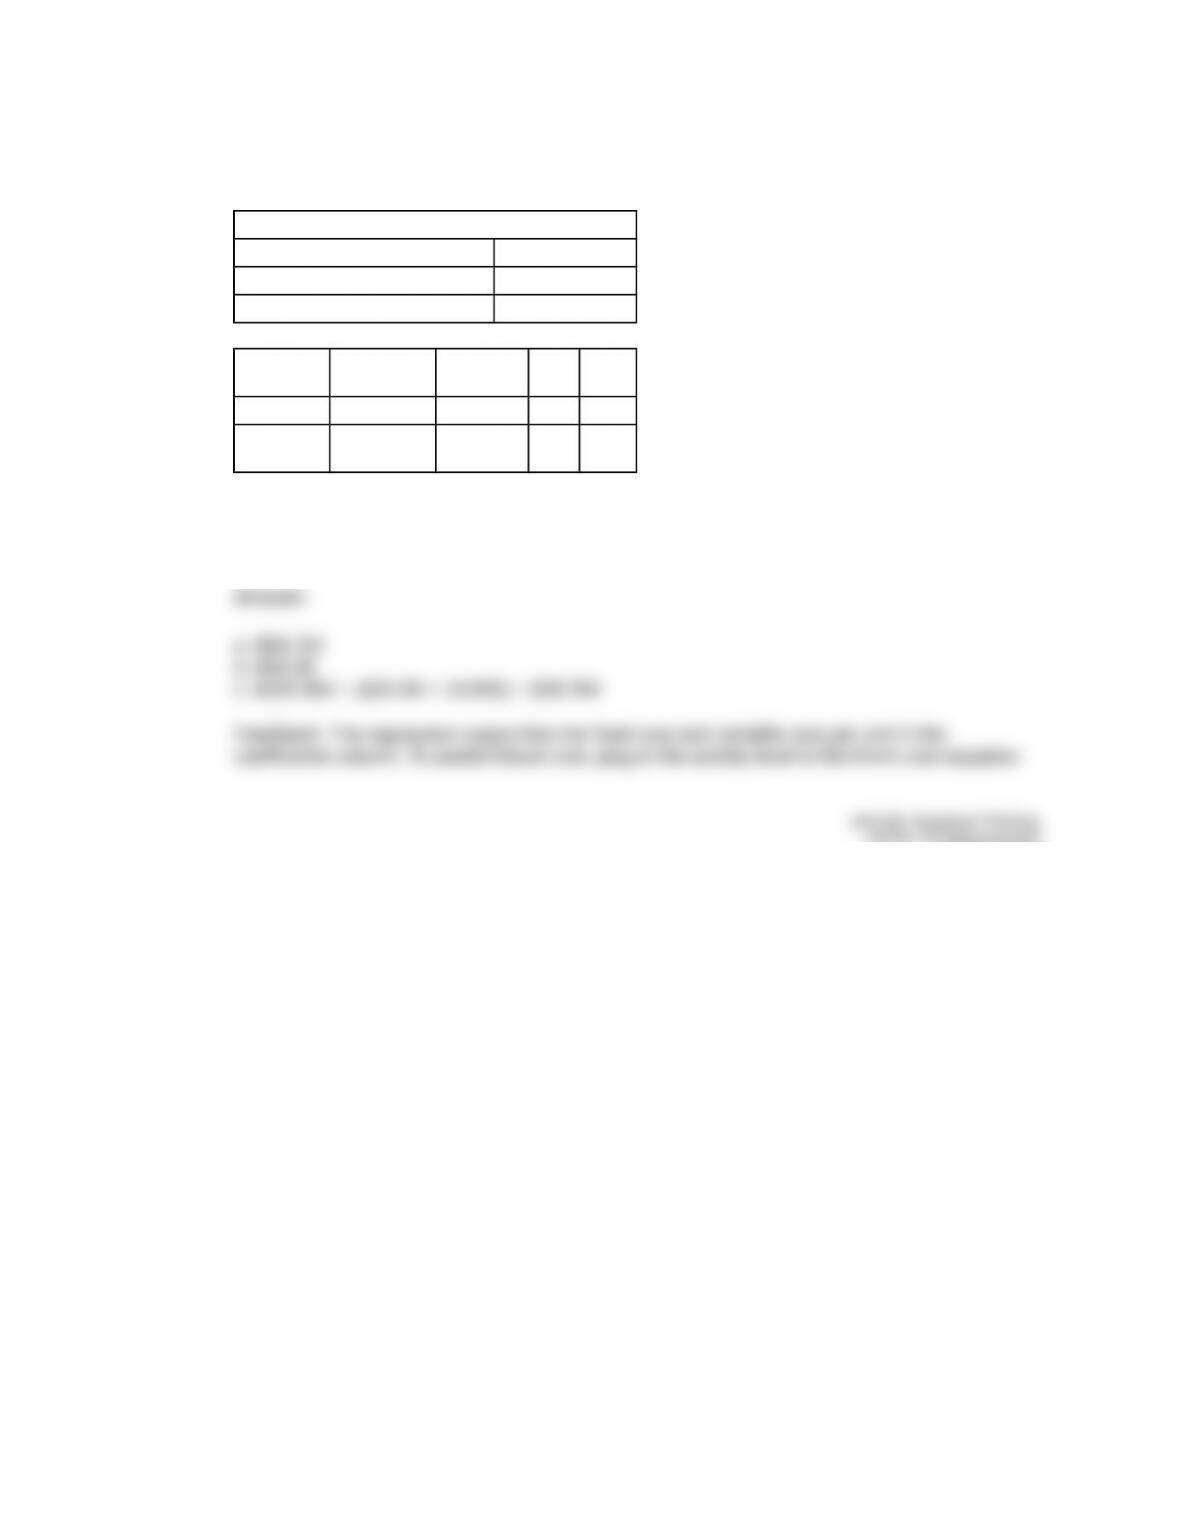
119. Sage, Inc. used Excel to run a least-squares regression analysis, which resulted in the
following output:
Regression Statistics
Multiple R 0.9755
R Square 0.9517
Observations 30
Coefficients Standard
Error
T
Stat
P-
Value
Intercept 28764 3603 2.84 0.021
Production
(X) 10.38 0.4641 14.51 0.000
a. What is Sage’s total fixed cost?
b. What is Sage’s variable cost per unit?
c. What total cost would Sage predict for a month in which they sold 10,000 units?
AICPA: FN Measurement
Blooms: Apply
Difficulty: 2 Medium
Learning Objective: 05-04 Use least-squares regression to analyze mixed costs.
Topic: Least-squares regression method
5-62
Copyright © 2017 McGraw-Hill Education. All rights reserved. No reproduction or distribution without the prior written consent of
McGraw-Hill Education.
120. Newport, Inc. used Excel to run a least-squares regression analysis, which resulted in the
following output:
Regression Statistics
Multiple R 0.7225
R Square 0.8500
Observations 30
Coefficients Standard
Error
T
Stat
P-
Value
Intercept 38000 3603 2.84 0.021
Production
(X) 5.75 0.4641 14.51 0.000
a. What is Newport’s total fixed cost?
b. What is Newport’s variable cost per unit?
c. What total cost would Newport predict for a month in which they sold 5,000 units?
d. What proportion of variation in Newport’s cost is explained by variation in production?
AICPA: FN Measurement
Blooms: Apply
Difficulty: 2 Medium
Learning Objective: 05-04 Use least-squares regression to analyze mixed costs.
Topic: Least-squares regression method
5-63
Copyright © 2017 McGraw-Hill Education. All rights reserved. No reproduction or distribution without the prior written consent of
McGraw-Hill Education.
121. Chilton, Inc. sold 11,000 units last year for $20 each. Variable costs per unit were $4 for direct
materials, $1.50 for direct labor, and $2.50 for variable overhead. Fixed costs were $60,000 in
manufacturing overhead and $40,000 in nonmanufacturing costs.
a. What is the total contribution margin?
b. What is the unit contribution margin?
c. What is the contribution margin ratio?
d. If sales increase by 2,000 units, by how much will profits increase?
AICPA: FN Measurement
Blooms: Apply
Difficulty: 2 Medium
Learning Objective: 05-05 Prepare and interpret a contribution margin income statement.
Topic: Contribution margin approach
Topic: Contribution margin ratio
Topic: Unit contribution margin
122. Vaughn, Inc. sold 17,000 units last year for $50 each. Variable costs per unit were $15 for
direct materials, $15 for direct labor, and $10 for variable overhead. Fixed costs were $10,000
in manufacturing overhead and $50,000 in nonmanufacturing costs.
a. What is the total contribution margin?
b. What is the unit contribution margin?
c. What is the contribution margin ratio?
d. If sales increase by 5,000 units, by how much will profits increase?
AICPA: FN Measurement
Blooms: Apply
Difficulty: 2 Medium
Learning Objective: 05-05 Prepare and interpret a contribution margin income statement.
Topic: Contribution margin approach
Topic: Contribution margin ratio
5-64
Copyright © 2017 McGraw-Hill Education. All rights reserved. No reproduction or distribution without the prior written consent of
McGraw-Hill Education.
Topic: Unit contribution margin
123. Campbell, Inc. sold 100,000 units last year for $2.00 each. Variable costs per unit were $0.30
for direct materials, $0.50 for direct labor, and $0.30 for variable overhead. Fixed costs were
$60,000 in manufacturing overhead and $40,000 in nonmanufacturing costs.
a. What is the total contribution margin?
b. What is the unit contribution margin?
c. What is the contribution margin ratio?
d. If sales increase by 20,000 units, by how much will profits increase?
AICPA: FN Measurement
Blooms: Apply
Difficulty: 2 Medium
Learning Objective: 05-05 Prepare and interpret a contribution margin income statement.
Topic: Contribution margin approach
Topic: Contribution margin ratio
Topic: Unit contribution margin
124. Acme Company sold 900 units for $110 each. Variable costs were $75 per unit and total fixed
expenses were $22,000. Prepare a contribution margin income statement.
AICPA: FN Measurement
Blooms: Apply
Difficulty: 2 Medium
Learning Objective: 05-05 Prepare and interpret a contribution margin income statement.
Topic: Contribution margin approach
5-65
Copyright © 2017 McGraw-Hill Education. All rights reserved. No reproduction or distribution without the prior written consent of
McGraw-Hill Education.
125. Laurel Company sold 500 units for $450 each. Variable costs were $280 per unit, and total
fixed expenses were $53,000. Prepare a contribution margin income statement.
AICPA: FN Measurement
Blooms: Apply
Difficulty: 2 Medium
Learning Objective: 05-05 Prepare and interpret a contribution margin income statement.
Topic: Contribution margin approach
5-66
Copyright © 2017 McGraw-Hill Education. All rights reserved. No reproduction or distribution without the prior written consent of
McGraw-Hill Education.
126. Aspen Inc has the following information for its first year of operations:
Units produced 3,600
Units sold 3,600
Unit sales price $200.00
Direct material per unit $60.00
Direct labor per unit $30.00
Variable manufacturing overhead per unit $30.00
Fixed manufacturing overhead $115,200
Variable selling expenses $15.00
Fixed selling and administrative
expenses $65,000
a. Prepare Aspen’s full absorption costing income statement.
b. Prepare Aspen’s variable costing income statement.
5-67
Copyright © 2017 McGraw-Hill Education. All rights reserved. No reproduction or distribution without the prior written consent of
McGraw-Hill Education.
AICPA: FN Measurement
Blooms: Apply
Difficulty: 3 Hard
Learning Objective: 05-S1 Compare variable costing to full absorption costing.
Topic: Variable versus full absorption costing
5-68
Copyright © 2017 McGraw-Hill Education. All rights reserved. No reproduction or distribution without the prior written consent of
McGraw-Hill Education.
127. Heather Inc has the following information for its first year of operations:
Units produced 1,800
Units sold 1,800
Unit sales price $130.00
Direct material per unit $25.00
Direct labor per unit $10.00
Variable manufacturing overhead per unit $20.00
Fixed manufacturing overhead $57,600
Variable selling expenses $10.00
Fixed selling and administrative expenses $33,000
a. Prepare Heather’s full absorption costing income statement.
b. Prepare Heather’s variable costing income statement.

128. Lavender Inc has the following information for its first year of operations:
Units produced 4,000
Units sold 3,600
Unit sales price $200.00
Direct material per unit $60.00
Direct labor per unit $30.00
Variable manufacturing overhead per unit $30.00
Fixed manufacturing overhead $128,000
Variable selling expenses $15.00
Fixed selling and administrative
expenses $65,000
a. Prepare Lavender’s full absorption costing income statement.
b. Prepare Lavender’s variable costing income statement.

AICPA: FN Measurement
Blooms: Apply
Difficulty: 3 Hard
Learning Objective: 05-S1 Compare variable costing to full absorption costing.
Topic: Variable versus full absorption costing
5-72
Copyright © 2017 McGraw-Hill Education. All rights reserved. No reproduction or distribution without the prior written consent of
McGraw-Hill Education.
5-73
Copyright © 2017 McGraw-Hill Education. All rights reserved. No reproduction or distribution without the prior written consent of
McGraw-Hill Education.
129. Paige Inc has the following information for its first year of operations:
Units produced 2,000
Units sold 1,800
Unit sales price $130.00
Direct material per unit $25.00
Direct labor per unit $10.00
Variable manufacturing overhead per unit $20.00
Fixed manufacturing overhead $64,000
Variable selling expenses $10.00
Fixed selling and administrative expenses $33,000
a. Prepare Paige’s full absorption costing income statement.
b. Prepare Paige’s variable costing income statement.

AICPA: FN Measurement
Blooms: Apply
Difficulty: 3 Hard
Learning Objective: 05-S1 Compare variable costing to full absorption costing.
Topic: Variable versus full absorption costing
5-75
Copyright © 2017 McGraw-Hill Education. All rights reserved. No reproduction or distribution without the prior written consent of
McGraw-Hill Education.