Chapter 13 Measuring and Evaluating Financial Performance Answer
Key
True / False Questions
1. The general goal of horizontal analyses is to identify significant trends.
AICPA: BB Critical Thinking
AICPA: FN Measurement
Accessibility: Keyboard Navigation
Blooms: Understand
Difficulty: 1 Easy
Learning Objective: 13-01 Describe the purposes and uses of horizontal, vertical, and ratio analyses.
Topic: Horizontal, Vertical, and Ratio Analysis
2. Trend data can be measured in dollar amounts or percentages.
AICPA: BB Critical Thinking
AICPA: FN Measurement
Accessibility: Keyboard Navigation
Blooms: Remember
Difficulty: 1 Easy
Learning Objective: 13-02 Use horizontal (trend) analyses to recognize financial changes that unfold over time.
Topic: Horizontal (Trend) Computations
3. Horizontal analysis is the comparison of each financial statement amount to another amount
on the same financial statement.
AICPA: BB Critical Thinking
13-1
Copyright © 2017 McGraw-Hill Education. All rights reserved. No reproduction or distribution without the prior written consent of
McGraw-Hill Education.
AICPA: FN Measurement
Accessibility: Keyboard Navigation
Blooms: Remember
Difficulty: 1 Easy
Learning Objective: 13-02 Use horizontal (trend) analyses to recognize financial changes that unfold over time.
Topic: Horizontal (Trend) Computations
4. Vertical analysis is the comparison of a company’s financial information over time.
AICPA: BB Critical Thinking
AICPA: FN Measurement
Accessibility: Keyboard Navigation
Blooms: Remember
Difficulty: 1 Easy
Learning Objective: 13-03 Use vertical (common size) analyses to understand important relationships within financial
statements.
Topic: Vertical (Common Size) Computations
5. Liquidity measures the ability of a company to meet its current financial obligations.
AICPA: BB Resource Management
AICPA: FN Measurement
Accessibility: Keyboard Navigation
Blooms: Understand
Difficulty: 1 Easy
Learning Objective: 13-04 Calculate financial ratios to assess profitability, liquidity, and solvency.
Topic: Ratio Computations
6. The fixed asset turnover ratio is a profitability ratio.
AICPA: BB Critical Thinking
AICPA: FN Risk Analysis
Accessibility: Keyboard Navigation
Blooms: Remember
Difficulty: 1 Easy
Learning Objective: 13-05 Interpret the results of financial analyses.
Topic: Interpreting Ratio Analyses
13-2
Copyright © 2017 McGraw-Hill Education. All rights reserved. No reproduction or distribution without the prior written consent of
McGraw-Hill Education.
7. If earnings per share (EPS) decreases, it must mean that the company’s net income has
fallen.
AICPA: BB Critical Thinking
AICPA: FN Risk Analysis
Accessibility: Keyboard Navigation
Blooms: Analyze
Difficulty: 2 Medium
Learning Objective: 13-05 Interpret the results of financial analyses.
Topic: Interpreting Ratio Analyses
8. The higher the receivables turnover, the slower accounts receivable are being collected.
AICPA: BB Critical Thinking
AICPA: FN Risk Analysis
Accessibility: Keyboard Navigation
Blooms: Understand
Difficulty: 1 Easy
Learning Objective: 13-05 Interpret the results of financial analyses.
Topic: Interpreting Ratio Analyses
9. A company with a high inventory turnover requires a larger investment in inventory than
another company of similar sales with a lower inventory turnover.
AICPA: BB Critical Thinking
AICPA: FN Risk Analysis
Accessibility: Keyboard Navigation
Blooms: Analyze
Difficulty: 3 Hard
Learning Objective: 13-05 Interpret the results of financial analyses.
Topic: Interpreting Ratio Analyses
13-3
Copyright © 2017 McGraw-Hill Education. All rights reserved. No reproduction or distribution without the prior written consent of
McGraw-Hill Education.
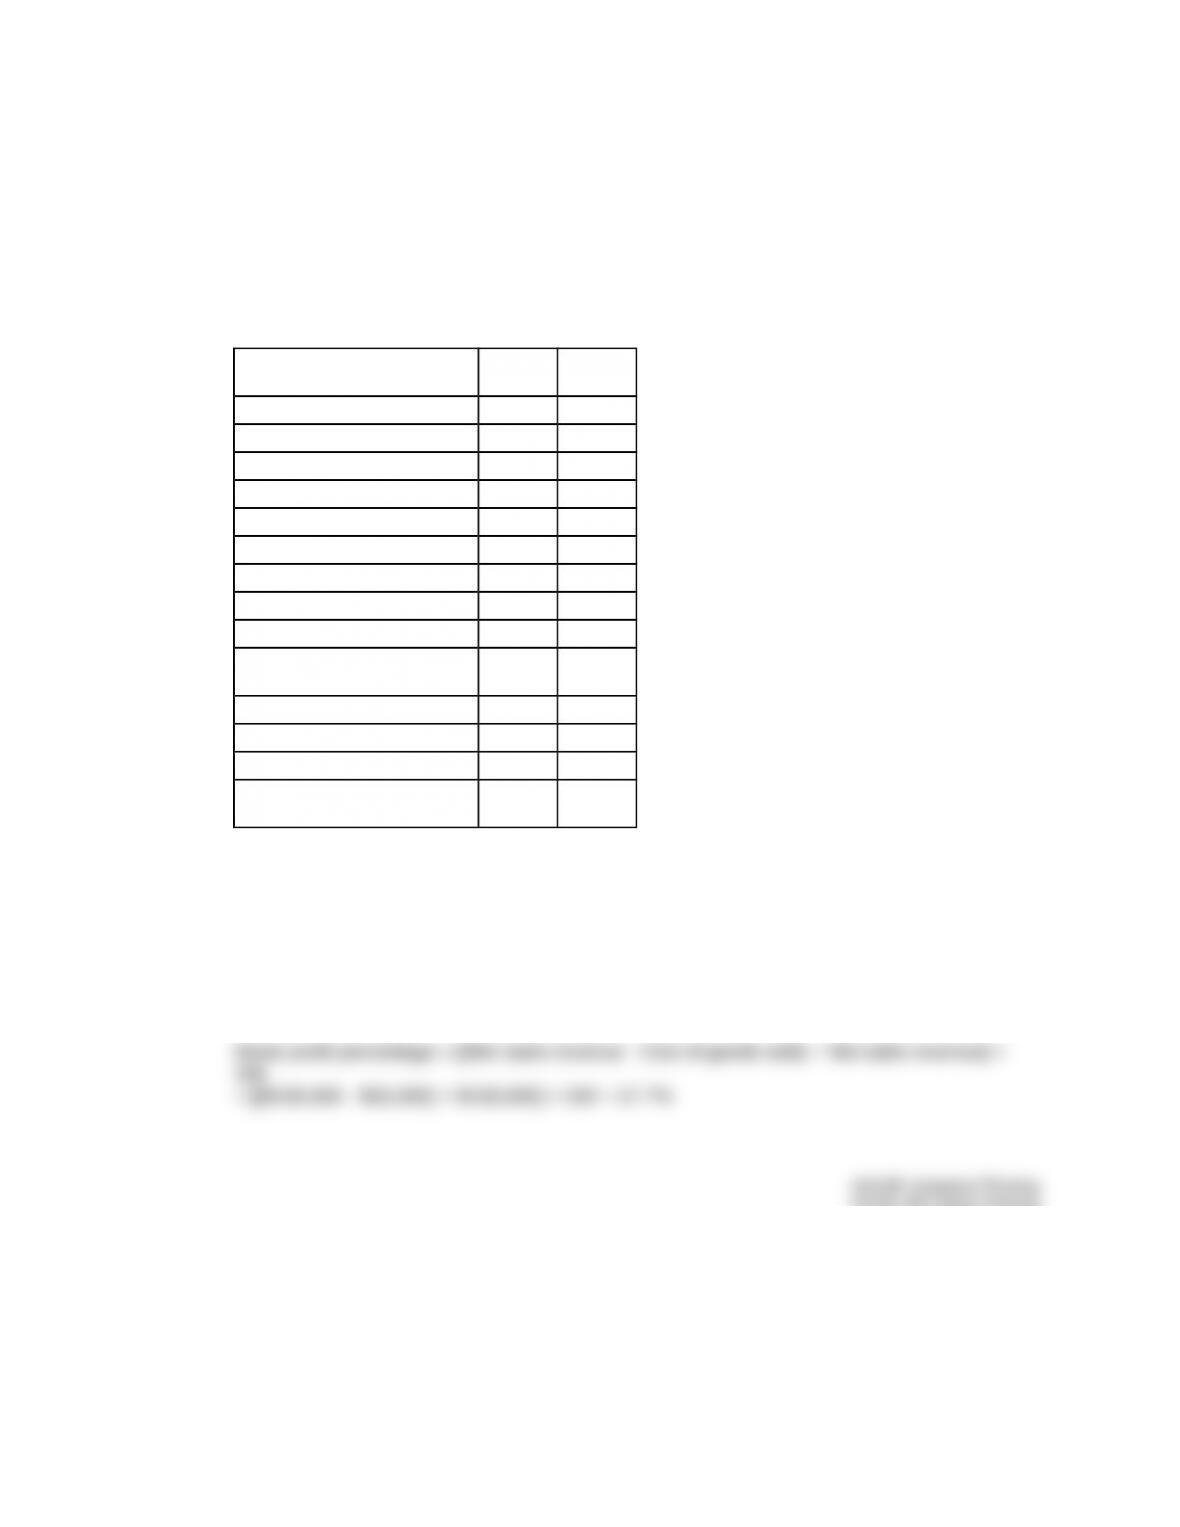
10. If the debt-to-assets ratio is 0.63, it means that 37% of the company’s financing has been
provided by stockholders’ equity.
AICPA: BB Critical Thinking
AICPA: FN Risk Analysis
Accessibility: Keyboard Navigation
Blooms: Analyze
Difficulty: 2 Medium
Learning Objective: 13-05 Interpret the results of financial analyses.
Topic: Interpreting Ratio Analyses
11. The higher the times interest earned ratio, the greater the risk of nonpayment of interest.
AICPA: BB Critical Thinking
AICPA: FN Risk Analysis
Accessibility: Keyboard Navigation
Blooms: Understand
Difficulty: 2 Medium
Learning Objective: 13-05 Interpret the results of financial analyses.
Topic: Interpreting Ratio Analyses
12. Benchmarks are required to evaluate a company’s performance.
AICPA: BB Resource Management
AICPA: FN Risk Analysis
Accessibility: Keyboard Navigation
Blooms: Understand
Difficulty: 2 Medium
Learning Objective: 13-05 Interpret the results of financial analyses.
Topic: Interpreting Ratio Analyses
13-4
Copyright © 2017 McGraw-Hill Education. All rights reserved. No reproduction or distribution without the prior written consent of
McGraw-Hill Education.
13. The going-concern assumption is also known as the continuity assumption.
AICPA: BB Critical Thinking
AICPA: FN Risk Analysis
Accessibility: Keyboard Navigation
Blooms: Remember
Difficulty: 1 Easy
Learning Objective: 13-06 Describe how analyses depend on key accounting decisions and concepts.
Topic: Underlying Accounting Decisions and Concepts
14. According to the full disclosure principle, financial reports should present detailed information
about every transaction.
AICPA: BB Critical Thinking
AICPA: FN Measurement
Accessibility: Keyboard Navigation
Blooms: Understand
Difficulty: 1 Easy
Learning Objective: 13-06 Describe how analyses depend on key accounting decisions and concepts.
Topic: Underlying Accounting Decisions and Concepts
Multiple Choice Questions
13-5
Copyright © 2017 McGraw-Hill Education. All rights reserved. No reproduction or distribution without the prior written consent of
McGraw-Hill Education.
15. The primary objective of external financial reporting is to:
A. enhance the ability of the company to acquire financial capital from external sources.
B. accurately provide financial results for tax purposes.
C. comply with external regulations and requirements of government and professional
associations.
AICPA: BB Critical Thinking
AICPA: FN Measurement
Accessibility: Keyboard Navigation
Blooms: Remember
Difficulty: 1 Easy
Learning Objective: 13-01 Describe the purposes and uses of horizontal, vertical, and ratio analyses.
Topic: Horizontal, Vertical, and Ratio Analysis
16. Which of the following analysis techniques does not pertain to changes over time?
A. Trend analysis
B. Horizontal analysis
C. Time-series analysis
AICPA: BB Critical Thinking
AICPA: FN Risk Analysis
Accessibility: Keyboard Navigation
Blooms: Understand
Difficulty: 2 Medium
Learning Objective: 13-01 Describe the purposes and uses of horizontal, vertical, and ratio analyses.
Topic: Horizontal, Vertical, and Ratio Analysis
13-6
Copyright © 2017 McGraw-Hill Education. All rights reserved. No reproduction or distribution without the prior written consent of
McGraw-Hill Education.
17. Horizontal analysis involves:
A. Comparing individual financial statement line items with each other to understand the
relationships between line items.
B. Comparing individual financial statement line items to some benchmark, typically similar
competitors’ financial statement line items.
D. Comparing individual financial statement line items that have been arranged horizontally
from highest to lowest dollar amounts.
Horizontal analysis is conducted to examine trends over time with individual financial
statement line items (e.g., trends in Gross Profit or Net Income from one year to the next).
AICPA: BB Industry
AICPA: FN Decision Making
Accessibility: Keyboard Navigation
Blooms: Remember
Difficulty: 1 Easy
Learning Objective: 13-01 Describe the purposes and uses of horizontal, vertical, and ratio analyses.
Topic: Horizontal, Vertical, and Ratio Analysis
18. Which of the following statements is not true?
A. Horizontal analyses help financial statement users recognize changes that unfold over
time.
B. Vertical analyses focus on relationships between items on the same financial statement.
C. Ratio analyses focus on relationships between items on one or more of the financial
statements.
AICPA: BB Industry
AICPA: FN Decision Making
Accessibility: Keyboard Navigation
Blooms: Remember
Difficulty: 1 Easy
Learning Objective: 13-01 Describe the purposes and uses of horizontal, vertical, and ratio analyses.
Topic: Horizontal, Vertical, and Ratio Analysis
13-7
Copyright © 2017 McGraw-Hill Education. All rights reserved. No reproduction or distribution without the prior written consent of
McGraw-Hill Education.
19. Financial statement analysis is useful for:
B. selecting the most appropriate accounting rules to follow.
C. determining the market price of a company’s stock.
D. comparing US companies with foreign companies.
AICPA: BB Industry
AICPA: FN Decision Making
Accessibility: Keyboard Navigation
Blooms: Remember
Difficulty: 1 Easy
Learning Objective: 13-01 Describe the purposes and uses of horizontal, vertical, and ratio analyses.
Source: LearnSmart
Topic: Horizontal, Vertical, and Ratio Analysis
20. Often loan agreements require the borrower to comply with certain requirements, such as
maintaining a particular current ratio or limiting future borrowing. To decide if a company has
complied with its loan covenants, a creditor would look at the company’s:
B. chart of accounts.
C. bank statements.
D. charter.
AICPA: BB Critical Thinking
AICPA: FN Risk Analysis
Accessibility: Keyboard Navigation
Blooms: Understand
Difficulty: 1 Easy
Learning Objective: 13-01 Describe the purposes and uses of horizontal, vertical, and ratio analyses.
Source: LearnSmart
Topic: Horizontal, Vertical, and Ratio Analysis
13-8
Copyright © 2017 McGraw-Hill Education. All rights reserved. No reproduction or distribution without the prior written consent of
McGraw-Hill Education.
21. Vertical analysis:
B. identifies trends over time.
C. provides an understanding of the relationships among various items on financial
statements by expressing the differences in terms of dollars.
D. involves comparing amounts across different financial statements.
AICPA: BB Industry
AICPA: FN Decision Making
Accessibility: Keyboard Navigation
Blooms: Understand
Difficulty: 2 Medium
Learning Objective: 13-01 Describe the purposes and uses of horizontal, vertical, and ratio analyses.
Source: LearnSmart
Topic: Horizontal, Vertical, and Ratio Analysis
22. Horizontal analysis:
B. identifies the relative contribution made by each financial statement line item.
C. provides an understanding of the relationships among various items on financial
statements.
D. involves comparing amounts across different financial statements.
Horizontal (trend) analyses are conducted to help financial statement users recognize
important financial changes that unfold over time. Horizontal analyses compare individual
AICPA: BB Industry
AICPA: FN Decision Making
Accessibility: Keyboard Navigation
Blooms: Understand
Difficulty: 2 Medium
Learning Objective: 13-01 Describe the purposes and uses of horizontal, vertical, and ratio analyses.
Source: LearnSmart
Topic: Horizontal, Vertical, and Ratio Analysis
13-9
Copyright © 2017 McGraw-Hill Education. All rights reserved. No reproduction or distribution without the prior written consent of
McGraw-Hill Education.
23. To analyze changes in a company’s sales over the last five years, you should perform:
A. vertical analysis.
B. ratio analysis.
D. cross-sectional analysis.
Horizontal (trend) analyses are conducted to help financial statement users recognize
important financial changes that unfold over time. Horizontal analyses compare individual
AICPA: BB Industry
AICPA: FN Decision Making
Accessibility: Keyboard Navigation
Blooms: Understand
Difficulty: 2 Medium
Learning Objective: 13-01 Describe the purposes and uses of horizontal, vertical, and ratio analyses.
Source: LearnSmart
Topic: Horizontal, Vertical, and Ratio Analysis
24. To analyze changes in a company’s net income over the last ten years, you should perform:
B. vertical analysis.
C. cross-section analysis.
D. ratio analysis.
Horizontal (trend) analyses are conducted to help financial statement users recognize
important financial changes that unfold over time. Horizontal analyses compare individual
AICPA: BB Industry
AICPA: FN Decision Making
Accessibility: Keyboard Navigation
Blooms: Understand
Difficulty: 2 Medium
Learning Objective: 13-01 Describe the purposes and uses of horizontal, vertical, and ratio analyses.
Source: LearnSmart
Topic: Horizontal, Vertical, and Ratio Analysis
13-10
Copyright © 2017 McGraw-Hill Education. All rights reserved. No reproduction or distribution without the prior written consent of
McGraw-Hill Education.
25. Ratio analysis:
A. is required by GAAP as part of every company’s income statement and balance sheet.
B. will always identify the best investment decision.
C. will tell you how a company will perform in the future.
AICPA: BB Critical Thinking
AICPA: FN Risk Analysis
Accessibility: Keyboard Navigation
Blooms: Understand
Difficulty: 2 Medium
Learning Objective: 13-01 Describe the purposes and uses of horizontal, vertical, and ratio analyses.
Source: LearnSmart
Topic: Horizontal, Vertical, and Ratio Analysis
26. Which of the following statements about trend analysis is correct?
A. Time-series analysis is an example of trend analysis.
B. Trend data are always in dollars.
C. Trend analysis is also known as vertical analysis.
D. Common-size analysis is an example of trend analysis.
Horizontal analyses compare individual financial statement line items horizontally (from one
period to the next), with the general goal of identifying significant sustained changes (trends).
Because it compares results over a series of periods, it is sometimes called time-series
analysis.
AICPA: BB Critical Thinking
AICPA: FN Measurement
Accessibility: Keyboard Navigation
Blooms: Understand
Difficulty: 3 Hard

AICPA: BB Critical Thinking
AICPA: FN Measurement
Accessibility: Keyboard Navigation
Blooms: Remember
Difficulty: 2 Medium
AICPA: BB Critical Thinking
AICPA: FN Measurement
Accessibility: Keyboard Navigation
Blooms: Apply
Difficulty: 2 Medium

AICPA: BB Industry
AICPA: FN Decision Making
Accessibility: Keyboard Navigation
Blooms: Apply
Difficulty: 3 Hard
AICPA: BB Resource Management
AICPA: FN Measurement
Accessibility: Keyboard Navigation
Blooms: Apply
Difficulty: 2 Medium

AICPA: BB Resource Management
AICPA: FN Measurement
Accessibility: Keyboard Navigation
Blooms: Apply
Difficulty: 2 Medium
AICPA: BB Critical Thinking
AICPA: FN Measurement
Accessibility: Keyboard Navigation
Blooms: Apply
Difficulty: 3 Hard
Learning Objective: 13-02 Use horizontal (trend) analyses to recognize financial changes that unfold over time.
Source: LearnSmart
Topic: Horizontal (Trend) Computations
13-14
Copyright © 2017 McGraw-Hill Education. All rights reserved. No reproduction or distribution without the prior written consent of
McGraw-Hill Education.
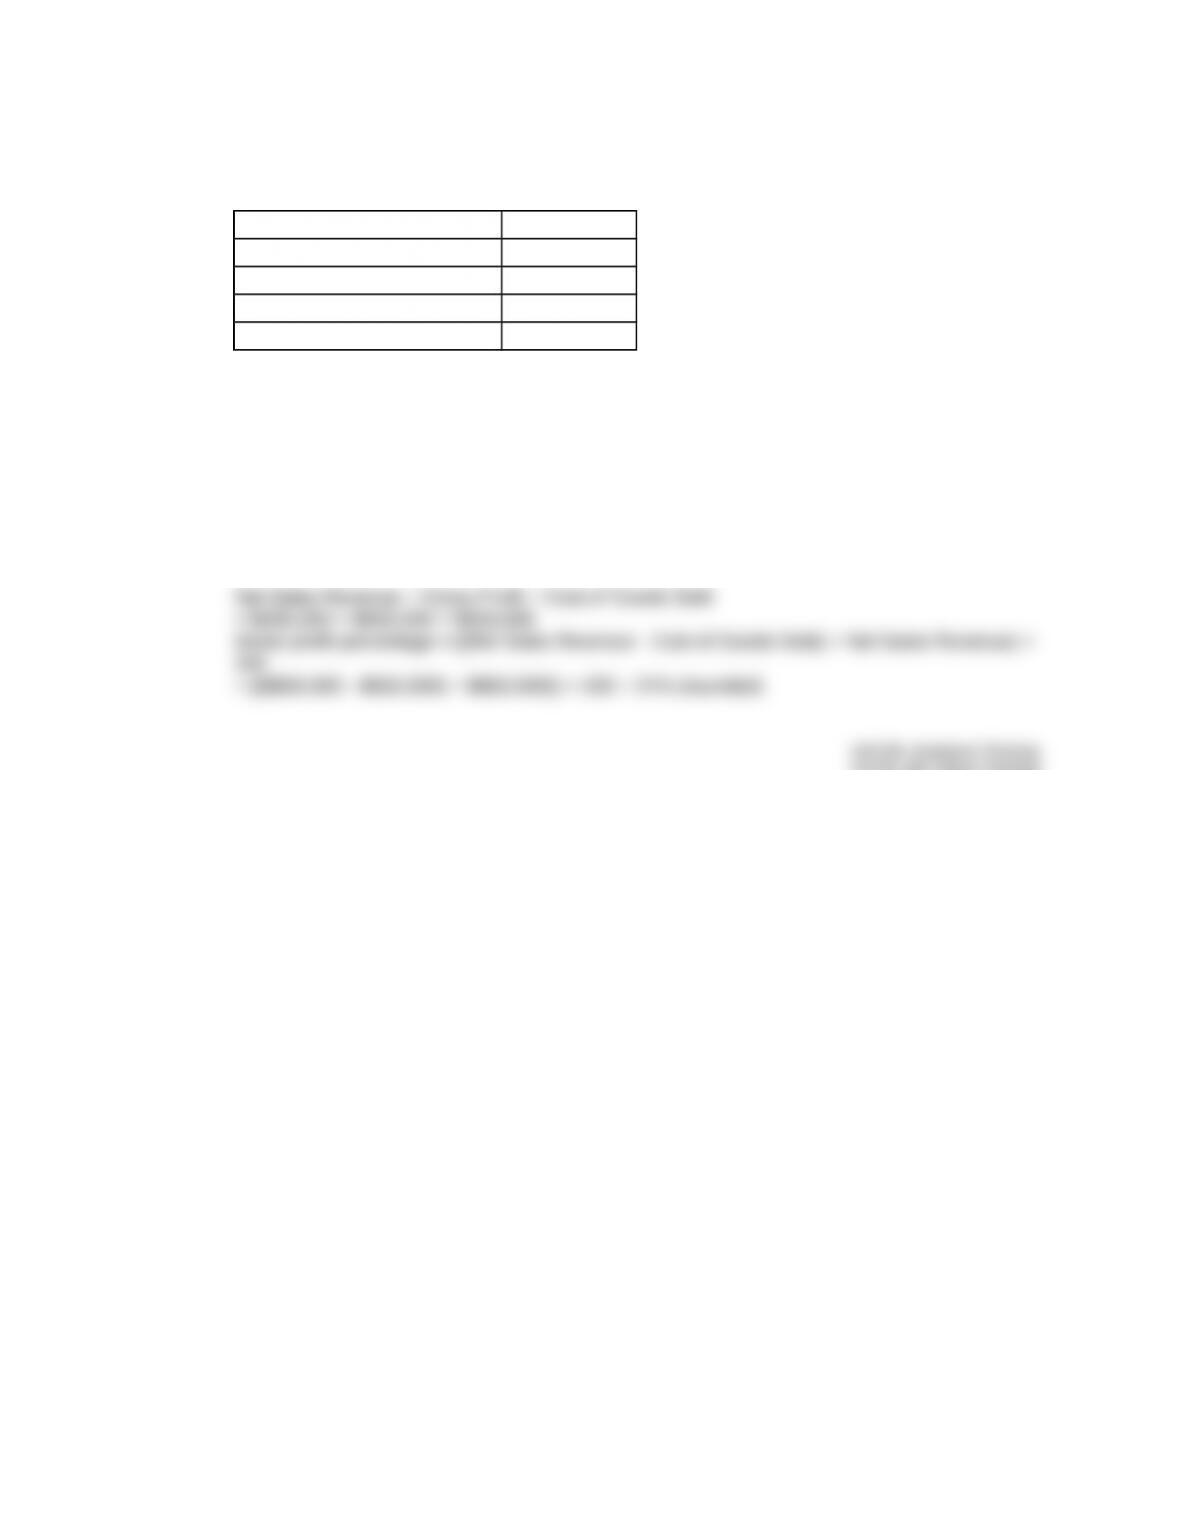
33. Which income statement line item had the largest percentage increase from the prior year to
the current year?
Current
Year
Prior
Year
Sales $120,000 $100,000
Cost of Goods Sold 80,000 60,000
Depreciation Expense 30,000 20,000
Interest Expense 2,000 5,000
B. Cost of Goods Sold
C. Interest Expense
D. Sales
Depreciation Expense increased by 50% [or $30,000 – $20,000) ÷ $20,000)] which is the
highest percentage increase. Sales increased by 20% [or $120,000 – $100,000) ÷ $100,000)].
AICPA: BB Critical Thinking
AICPA: FN Measurement
Accessibility: Keyboard Navigation
Blooms: Apply
Difficulty: 3 Hard
Learning Objective: 13-02 Use horizontal (trend) analyses to recognize financial changes that unfold over time.
Source: LearnSmart
Topic: Horizontal (Trend) Computations
34. In a common size balance sheet, each item on the balance sheet is expressed as a
percentage of:
B. total liabilities.
C. net income.
D. total stockholders’ equity.
AICPA: BB Critical Thinking
AICPA: FN Measurement
Accessibility: Keyboard Navigation
Blooms: Remember
Difficulty: 1 Easy
Learning Objective: 13-03 Use vertical (common size) analyses to understand important relationships within financial
statements.
Topic: Vertical (Common Size) Computations
13-15
Copyright © 2017 McGraw-Hill Education. All rights reserved. No reproduction or distribution without the prior written consent of
McGraw-Hill Education.

35. In a common size income statement, each item on the income statement is expressed as a
percentage of:
A. net income.
B. gross profit.
C. total expenses.
D. sales revenue.
AICPA: BB Critical Thinking
AICPA: FN Measurement
Accessibility: Keyboard Navigation
Blooms: Remember
Difficulty: 1 Easy
Learning Objective: 13-03 Use vertical (common size) analyses to understand important relationships within financial
statements.
Topic: Vertical (Common Size) Computations
36. The following information is taken from the financial statements of a company for the current
year:
Current Assets $395,000
Total Assets 890,000
Cost of Goods Sold 650,000
Gross Profit 200,000
Net Income 120,000
On a common size income statement for the year, what is the percentage that would be
shown next to the dollar amount of sales revenue?
B. 14%
C. 60%
D. Cannot be determined
AICPA: BB Critical Thinking
AICPA: FN Measurement
Accessibility: Keyboard Navigation
Blooms: Apply
Difficulty: 2 Medium
Learning Objective: 13-03 Use vertical (common size) analyses to understand important relationships within financial
statements.
Topic: Vertical (Common Size) Computations
13-16
Copyright © 2017 McGraw-Hill Education. All rights reserved. No reproduction or distribution without the prior written consent of
McGraw-Hill Education.
37. The following information is taken from the financial statements of a company for the current
year:
Current Assets $395,000
Total Assets 890,000
Cost of Goods Sold 650,000
Gross Profit 200,000
Net Income 120,000
The gross profit percentage for the current year rounded to the nearest whole percent is
closest to:
B. 76%.
C. 60%.
D. 31%.
AICPA: BB Critical Thinking
AICPA: FN Measurement
Accessibility: Keyboard Navigation
Blooms: Apply
Difficulty: 2 Medium
Learning Objective: 13-04 Calculate financial ratios to assess profitability, liquidity, and solvency.
Topic: Ratio Computations
13-17
Copyright © 2017 McGraw-Hill Education. All rights reserved. No reproduction or distribution without the prior written consent of
McGraw-Hill Education.
38. The following information is taken from the financial statements of a company for the current
year:
Current Assets $395,000
Total Assets 890,000
Cost of Goods Sold 650,000
Gross Profit 200,000
Net Income 120,000
On a common size income statement for this year, what is the percentage that would be
shown next to the dollar amount of cost of goods sold?
B. 24%
C. 31%
D. 18%
AICPA: BB Critical Thinking
AICPA: FN Measurement
Accessibility: Keyboard Navigation
Blooms: Apply
Difficulty: 2 Medium
Learning Objective: 13-03 Use vertical (common size) analyses to understand important relationships within financial
statements.
Topic: Vertical (Common Size) Computations
39. On a common size balance sheet what is the percentage that would be shown next to the
dollar amount of current assets?
A. 100%
C. 30%
D. 33%
AICPA: BB Resource Management
AICPA: FN Measurement
Accessibility: Keyboard Navigation
Blooms: Apply
Difficulty: 2 Medium
Learning Objective: 13-03 Use vertical (common size) analyses to understand important relationships within financial
statements.
Topic: Vertical (Common Size) Computations
13-18
Copyright © 2017 McGraw-Hill Education. All rights reserved. No reproduction or distribution without the prior written consent of
McGraw-Hill Education.

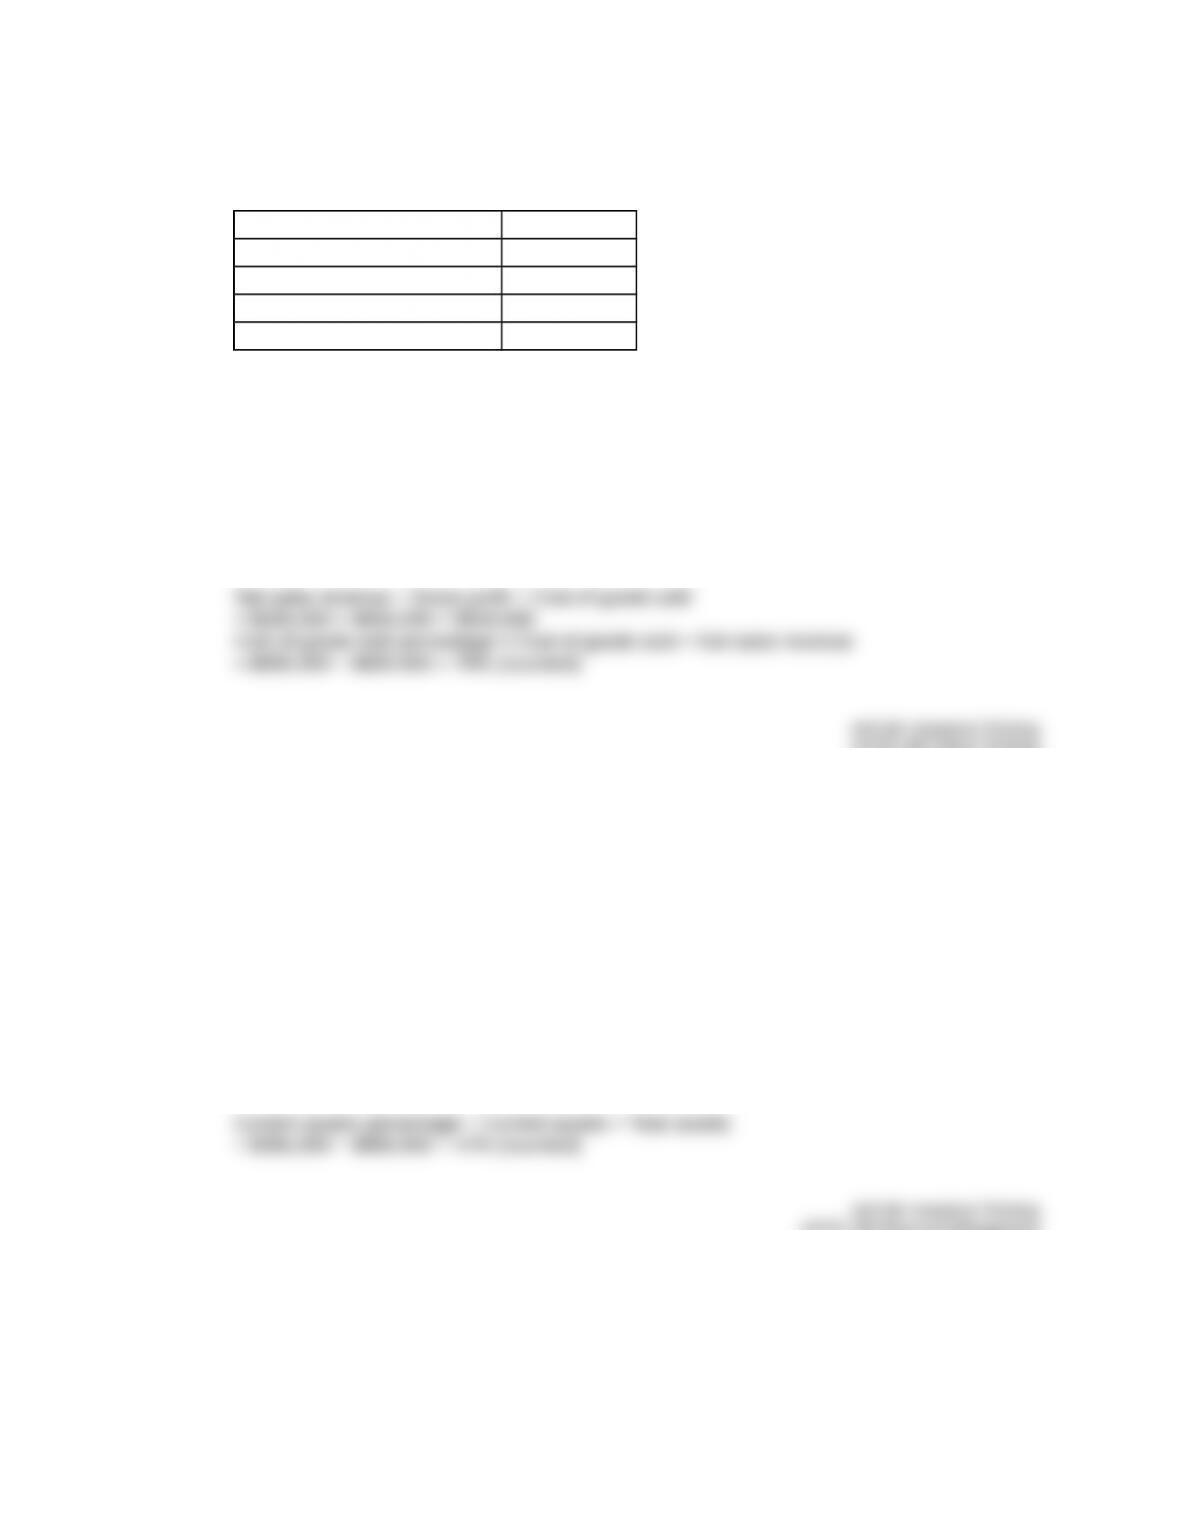
40. The following information pertains to the CJ Company:
Net Sales Revenue $48,230
Cost of Sales 31,729
Gross Profit 16,501
Operating and Other Expenses 12,715
Interest Expense 280
Income Tax Expense 1,311
Net Income $2,195
What would be reported next to Interest Expense on a common sized income statement?
A. 12.7%
B. 1.7%
D. 0.9%
AICPA: BB Industry
AICPA: FN Decision Making
Accessibility: Keyboard Navigation
Blooms: Apply
Difficulty: 3 Hard
Learning Objective: 13-03 Use vertical (common size) analyses to understand important relationships within financial
statements.
Topic: Vertical (Common Size) Computations
13-19
Copyright © 2017 McGraw-Hill Education. All rights reserved. No reproduction or distribution without the prior written consent of
McGraw-Hill Education.
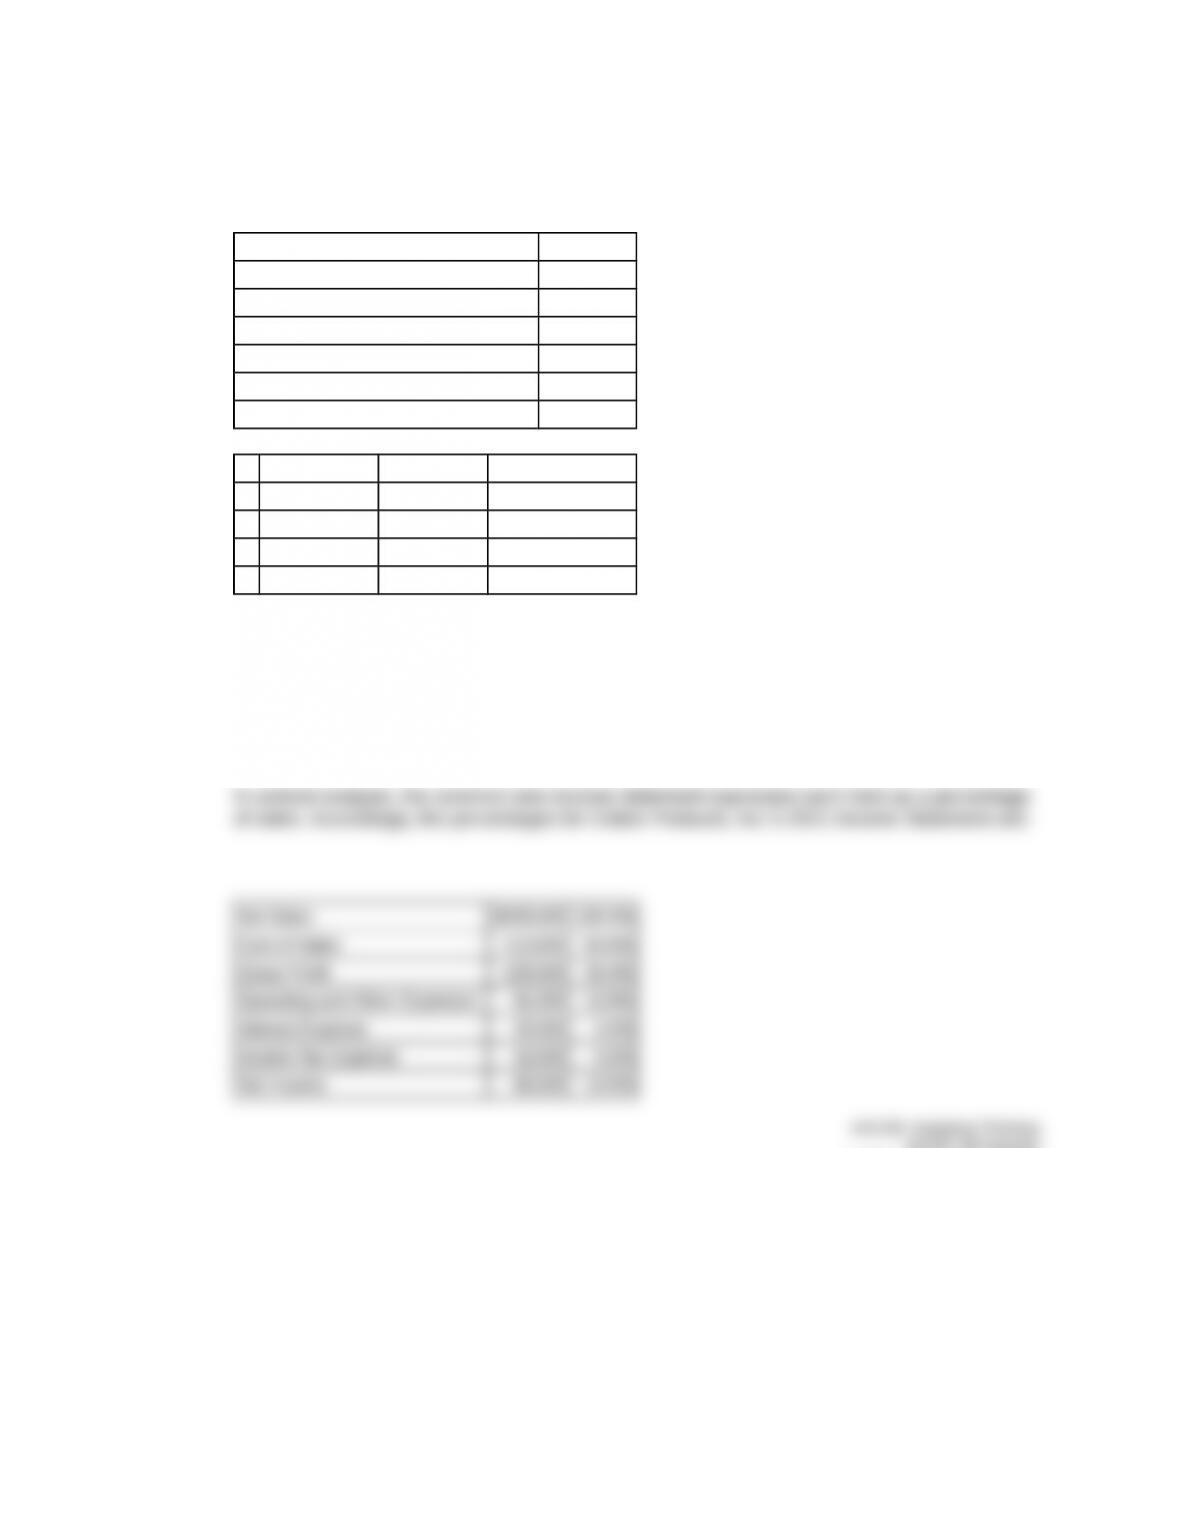
41. Cotton Products, Inc. prepared its income statement containing the information below. Using
vertical analysis, what percentages would apply to cost of sales, gross profit, and interest
expense, respectively?
Net Sales $635,000
Cost of Sales 410,000
Gross Profit 225,000
Operating and Other Expenses 81,500
Interest Expense 25,500
Income Tax Expense 32,000
Net Income $86,000
Cost of Sales Gross Profit Interest Expense
A) 182.2% 100.0% 14.2%
B) 476.7% 261.6% 37.2%
C) 100.0% 54.9% 7.8%
D) 64.6% 35.4% 4.0%
A. Option A
B. Option B
C. Option C
AICPA: BB Industry
AICPA: FN Decision Making
Accessibility: Keyboard Navigation
Blooms: Apply
Difficulty: 3 Hard
Learning Objective: 13-03 Use vertical (common size) analyses to understand important relationships within financial
statements.
Topic: Vertical (Common Size) Computations
13-20
Copyright © 2017 McGraw-Hill Education. All rights reserved. No reproduction or distribution without the prior written consent of
McGraw-Hill Education.
42. To perform a vertical analysis of an income statement, you would divide each line item on the
statement by:
B. cost of goods sold.
C. operating expenses.
D. net income.
AICPA: BB Critical Thinking
AICPA: FN Decision Making
Accessibility: Keyboard Navigation
Blooms: Remember
Difficulty: 2 Medium
Learning Objective: 13-03 Use vertical (common size) analyses to understand important relationships within financial
statements.
Source: LearnSmart
Topic: Vertical (Common Size) Computations
43. If you wish to examine how one aspect of a business is doing relative to other aspects of the
business at the current time, you are most likely to use:
A. time-series analysis.
B. ratio analysis.
C. horizontal analysis.
D. cross-sectional analysis.
Ratio analyses help financial statement users to understand relationships among various items
reported in the financial statements. Ratio analyses are useful because they consider
differences in the size of the amounts being compared, similar to common size statements.
AICPA: BB Critical Thinking
AICPA: FN Risk Analysis
Accessibility: Keyboard Navigation
Blooms: Understand
Difficulty: 2 Medium
Learning Objective: 13-01 Describe the purposes and uses of horizontal, vertical, and ratio analyses.

AICPA: BB Critical Thinking
AICPA: FN Risk Analysis
Accessibility: Keyboard Navigation
Blooms: Understand
Difficulty: 1 Easy
Learning Objective: 13-04 Calculate financial ratios to assess profitability, liquidity, and solvency.
Topic: Ratio Computations
45. If an analyst wants to examine a company’s short-run ability to survive, which of the following
would best be considered?
B. Market share
C. Profitability
D. Solvency
Liquidity ratios relate to the company’s short-term survival, in particular, the company’s ability
to use current assets to repay liabilities as they become due.
AICPA: BB Critical Thinking
AICPA: FN Risk Analysis
Accessibility: Keyboard Navigation
Blooms: Understand
Difficulty: 1 Easy
Learning Objective: 13-04 Calculate financial ratios to assess profitability, liquidity, and solvency.
Topic: Ratio Computations
13-22
Copyright © 2017 McGraw-Hill Education. All rights reserved. No reproduction or distribution without the prior written consent of
McGraw-Hill Education.
46. Solvency ratio data are primarily concerned with the ability of a company to:
A. produce profits.
C. manage its cash flow.
D. provide income for stockholders.
AICPA: BB Resource Management
AICPA: FN Risk Analysis
Accessibility: Keyboard Navigation
Blooms: Understand
Difficulty: 2 Medium
Learning Objective: 13-04 Calculate financial ratios to assess profitability, liquidity, and solvency.
Topic: Ratio Computations
47. If an analyst wanted to assess a company’s long-run survival, which of the following categories
of ratios would most likely be used?
A. Liquidity
B. Market share
C. Profitability
AICPA: BB Critical Thinking
AICPA: FN Risk Analysis
Accessibility: Keyboard Navigation
Blooms: Understand
Difficulty: 1 Easy
Learning Objective: 13-04 Calculate financial ratios to assess profitability, liquidity, and solvency.
Topic: Ratio Computations
13-23
Copyright © 2017 McGraw-Hill Education. All rights reserved. No reproduction or distribution without the prior written consent of
McGraw-Hill Education.
48. Which of the following statements about liquidity and solvency ratios is correct?
A. Unlike solvency ratios, liquidity ratios relate to the company’s long-run survival.
obligations.
C. Liquidity ratios include the return on equity ratio and the times interest earned ratio.
D. Solvency ratios include the current ratio and the net profit margin ratio.
Liquidity ratios relate to the company’s short-term survival, in particular, the company’s ability
to use current assets to repay liabilities as they become due. Solvency ratios relate to the
AICPA: BB Resource Management
AICPA: FN Risk Analysis
Accessibility: Keyboard Navigation
Blooms: Understand
Difficulty: 1 Easy
Learning Objective: 13-04 Calculate financial ratios to assess profitability, liquidity, and solvency.
Topic: Ratio Computations
49. Which of the following measures would assist in assessing the profitability of a company?
A. Debt-to-assets ratio
C. Receivables turnover ratio
D. Current ratio
AICPA: BB Critical Thinking
AICPA: FN Risk Analysis
Accessibility: Keyboard Navigation
Blooms: Understand
Difficulty: 1 Easy
Learning Objective: 13-04 Calculate financial ratios to assess profitability, liquidity, and solvency.
Topic: Ratio Computations
13-24
Copyright © 2017 McGraw-Hill Education. All rights reserved. No reproduction or distribution without the prior written consent of
McGraw-Hill Education.
50. Which of the following measures would assist in assessing the profitability of a company?
B. Times interest earned ratio
C. Inventory turnover ratio
D. Debt-to-assets ratio
Profitability ratios relate to the company’s performance in the current period, in particular, the
company’s ability to generate income. The fixed asset turnover ratio is a profitability ratio. The
AICPA: BB Critical Thinking
AICPA: FN Risk Analysis
Accessibility: Keyboard Navigation
Blooms: Understand
Difficulty: 1 Easy
Learning Objective: 13-04 Calculate financial ratios to assess profitability, liquidity, and solvency.
Topic: Ratio Computations
51. Which of the following is a profitability measure?
B. Total assets ÷ Total stockholders’ equity
C. Total liabilities ÷ Total stockholders’ equity
D. Cost of goods sold ÷ Average inventory
AICPA: BB Critical Thinking
AICPA: FN Risk Analysis
Accessibility: Keyboard Navigation
Blooms: Understand
Difficulty: 1 Easy
Learning Objective: 13-04 Calculate financial ratios to assess profitability, liquidity, and solvency.
Topic: Ratio Computations
52. Which of the following is not a profitability ratio?
A. Return on equity (ROE)
B. Earnings per share
C. Fixed asset turnover
AICPA: BB Resource Management
13-25
Copyright © 2017 McGraw-Hill Education. All rights reserved. No reproduction or distribution without the prior written consent of
McGraw-Hill Education.
AICPA: FN Risk Analysis
Accessibility: Keyboard Navigation
Blooms: Remember
Difficulty: 2 Medium
Learning Objective: 13-04 Calculate financial ratios to assess profitability, liquidity, and solvency.
Topic: Ratio Computations
53. Which of the following is a liquidity ratio?
B. Price/Earnings ratio
C. Net profit margin
D. Times interest earned
Liquidity ratios measure the company’s ability to use current assets to pay its current
obligations as they become due. Inventory turnover is a liquidity ratio. Price/Earnings and net
AICPA: BB Resource Management
AICPA: FN Risk Analysis
Accessibility: Keyboard Navigation
Blooms: Remember
Difficulty: 1 Easy
Learning Objective: 13-04 Calculate financial ratios to assess profitability, liquidity, and solvency.
Topic: Ratio Computations
54. Which of the following measures would assist in assessing the liquidity of a company?
A. Return on equity
B. Fixed asset turnover ratio
D. Times interest earned
Liquidity ratios measure the company’s ability to use current assets to pay its current
obligations as they become due. The receivables turnover ratio is a liquidity ratio. Return on
AICPA: BB Critical Thinking
AICPA: FN Risk Analysis
Accessibility: Keyboard Navigation
Blooms: Understand
Difficulty: 1 Easy
Learning Objective: 13-04 Calculate financial ratios to assess profitability, liquidity, and solvency.
Topic: Ratio Computations
13-26
Copyright © 2017 McGraw-Hill Education. All rights reserved. No reproduction or distribution without the prior written consent of
McGraw-Hill Education.
55. Which of the following ratios is used to evaluate a company’s liquidity?
A. Debt-to-assets ratio
B. Fixed asset turnover ratio
C. Return on equity ratio
Liquidity ratios measure the company’s ability to use current assets to pay its current
obligations as they become due. The current ratio is a liquidity ratio. The debt-to-assets ratio is
AICPA: BB Critical Thinking
AICPA: FN Risk Analysis
Accessibility: Keyboard Navigation
Blooms: Understand
Difficulty: 1 Easy
Learning Objective: 13-04 Calculate financial ratios to assess profitability, liquidity, and solvency.
Topic: Ratio Computations
56. Which of the following ratios is used to evaluate solvency?
A. Earnings per share (EPS)
B. Fixed asset turnover
D. Current ratio
AICPA: BB Resource Management
AICPA: FN Risk Analysis
Accessibility: Keyboard Navigation
Blooms: Remember
Difficulty: 1 Easy
Learning Objective: 13-04 Calculate financial ratios to assess profitability, liquidity, and solvency.
Topic: Ratio Computations
13-27
Copyright © 2017 McGraw-Hill Education. All rights reserved. No reproduction or distribution without the prior written consent of
McGraw-Hill Education.
57. Which of the following measures would assist in assessing the solvency of a company?
B. Fixed asset turnover
C. Return on equity
D. Current ratio
AICPA: BB Critical Thinking
AICPA: FN Risk Analysis
Accessibility: Keyboard Navigation
Blooms: Understand
Difficulty: 1 Easy
Learning Objective: 13-04 Calculate financial ratios to assess profitability, liquidity, and solvency.
Topic: Ratio Computations
58. Which of the following ratios is used to evaluate solvency?
A. Fixed asset turnover ratio
B. Days to sell ratio
C. Current ratio
AICPA: BB Critical Thinking
AICPA: FN Risk Analysis
Accessibility: Keyboard Navigation
Blooms: Remember
Difficulty: 1 Easy
Learning Objective: 13-04 Calculate financial ratios to assess profitability, liquidity, and solvency.
Topic: Ratio Computations
13-28
Copyright © 2017 McGraw-Hill Education. All rights reserved. No reproduction or distribution without the prior written consent of
McGraw-Hill Education.
59. Which of the following ratios is a solvency ratio?
A. Net profit margin ratio
B. Current ratio
C. Fixed asset turnover ratio
AICPA: BB Critical Thinking
AICPA: FN Risk Analysis
Accessibility: Keyboard Navigation
Blooms: Remember
Difficulty: 1 Easy
Learning Objective: 13-04 Calculate financial ratios to assess profitability, liquidity, and solvency.
Topic: Ratio Computations
60. Which of the measures below is used to assess profitability?
A. Current ratio
B. Debt-to-assets ratio
D. Receivables turnover
The asset turnover ratio is a profitability measure that helps to gauge the efficiency of assets in
generating net sales revenue. It is calculated as: Net Sales Revenue ÷ Average Total Assets.
AICPA: BB Critical Thinking
AICPA: FN Decision Making
Accessibility: Keyboard Navigation
Blooms: Remember
Difficulty: 1 Easy
Learning Objective: 13-04 Calculate financial ratios to assess profitability, liquidity, and solvency.
Topic: Ratio Computations
13-29
Copyright © 2017 McGraw-Hill Education. All rights reserved. No reproduction or distribution without the prior written consent of
McGraw-Hill Education.
61. Which ratio is a test of liquidity?
A. Net profit margin
C. Times interest earned
D. Debt-to-assets
AICPA: BB Industry
AICPA: FN Decision Making
Accessibility: Keyboard Navigation
Blooms: Remember
Difficulty: 1 Easy
Learning Objective: 13-04 Calculate financial ratios to assess profitability, liquidity, and solvency.
Topic: Ratio Computations
62. Which of the measures below is used to measure liquidity?
B. Debt-to-assets ratio
C. Price ÷ Earnings ratio
D. Times interest earned
The current ratio is used to measure liquidity, and is calculated as: Current Assets ÷ Current
Liabilities. It measures the ability of a company to pay its short term obligation with current
assets. The Price ÷ Earnings ratio is a profitability measure. The debt-to-assets and the times
AICPA: BB Critical Thinking
AICPA: FN Decision Making
Accessibility: Keyboard Navigation
Blooms: Remember
Difficulty: 1 Easy
Learning Objective: 13-04 Calculate financial ratios to assess profitability, liquidity, and solvency.
Topic: Ratio Computations
13-30
Copyright © 2017 McGraw-Hill Education. All rights reserved. No reproduction or distribution without the prior written consent of
McGraw-Hill Education.

63. In which of the following company attributes would a long-term bond holder be most
interested?
A. Quality of earnings
C. Profitability
D. Liquidity
A bond holder would be particularly interested in the company’s ability to make periodic
payments over the long-term and to be able to repay the face value of the bonds when they
mature. While liquidity and profitability are important, they tend to be more short-term in
AICPA: BB Critical Thinking
AICPA: FN Decision Making
Accessibility: Keyboard Navigation
Blooms: Remember
Difficulty: 1 Easy
Learning Objective: 13-04 Calculate financial ratios to assess profitability, liquidity, and solvency.
Topic: Ratio Computations
64. Which of the following is calculated by dividing net income by revenues?
A. Gross profit margin
B. Current ratio
D. Asset turnover
AICPA: BB Critical Thinking
AICPA: FN Measurement
Accessibility: Keyboard Navigation
Blooms: Remember
Difficulty: 1 Easy
Learning Objective: 13-04 Calculate financial ratios to assess profitability, liquidity, and solvency.
Topic: Ratio Computations
13-31
Copyright © 2017 McGraw-Hill Education. All rights reserved. No reproduction or distribution without the prior written consent of
McGraw-Hill Education.
65. Company X has net sales revenue of $780,000, cost of goods sold of $343,200, and all other
expenses of $327,600. The net profit margin is closest to:
A. 0.32.
B. 0.56.
C. 0.86.
AICPA: BB Critical Thinking
AICPA: FN Measurement
Accessibility: Keyboard Navigation
Blooms: Apply
Difficulty: 2 Medium
Learning Objective: 13-04 Calculate financial ratios to assess profitability, liquidity, and solvency.
Topic: Ratio Computations
66. Which of the following ratios is calculated by dividing net income by revenues?
A. Return on equity ratio
C. Current ratio
D. Fixed asset turnover ratio
AICPA: BB Resource Management
AICPA: FN Measurement
Accessibility: Keyboard Navigation
Blooms: Remember
Difficulty: 1 Easy
Learning Objective: 13-04 Calculate financial ratios to assess profitability, liquidity, and solvency.
Topic: Ratio Computations
13-32
Copyright © 2017 McGraw-Hill Education. All rights reserved. No reproduction or distribution without the prior written consent of
McGraw-Hill Education.
67. Company X has net sales revenue of $780,000, cost of goods sold of $343,200, and all other
expenses of $327,600. The gross profit percentage is closest to:
A. 32%.
C. 86%.
D. 14%.
AICPA: BB Critical Thinking
AICPA: FN Measurement
Accessibility: Keyboard Navigation
Blooms: Apply
Difficulty: 2 Medium
Learning Objective: 13-04 Calculate financial ratios to assess profitability, liquidity, and solvency.
Topic: Ratio Computations
68. Net revenue divided by average net fixed assets is the calculation for which of the following
ratios?
A. Net profit margin
C. Current ratio
D. Return on assets
AICPA: BB Resource Management
AICPA: FN Measurement
Accessibility: Keyboard Navigation
Blooms: Remember
Difficulty: 1 Easy
Learning Objective: 13-04 Calculate financial ratios to assess profitability, liquidity, and solvency.
Topic: Ratio Computations
69. Which of the following is calculated by dividing net revenue by average net fixed assets?
A. Net profit margin
B. Fixed asset turnover
D. Current ratio
AICPA: BB Critical Thinking
AICPA: FN Measurement
Accessibility: Keyboard Navigation
13-33
Copyright © 2017 McGraw-Hill Education. All rights reserved. No reproduction or distribution without the prior written consent of
McGraw-Hill Education.
Blooms: Remember
Difficulty: 1 Easy
Learning Objective: 13-04 Calculate financial ratios to assess profitability, liquidity, and solvency.
Topic: Ratio Computations
70. Company X has net sales revenue of $1,250,000, cost of goods sold of $760,000, and all
other expenses of $290,000. The beginning balance of stockholders’ equity is $400,000 and
the beginning balance of fixed assets is $361,000. The ending balance of stockholders’ equity
is $600,000 and the ending balance of fixed assets is $389,000. The fixed asset turnover ratio
is closest to:
A. 0.53.
B. 2.50.
D. 0.80.
AICPA: BB Resource Management
AICPA: FN Measurement
Accessibility: Keyboard Navigation
Blooms: Apply
Difficulty: 2 Medium
Learning Objective: 13-04 Calculate financial ratios to assess profitability, liquidity, and solvency.
Topic: Ratio Computations
71. Which of the following is calculated by dividing (net income less preferred dividends) by
average common stockholders’ equity?
A. Return on assets ratio
C. Earnings per share
D. Net profit margin ratio
AICPA: BB Critical Thinking
AICPA: FN Measurement
Accessibility: Keyboard Navigation
Blooms: Remember
Difficulty: 1 Easy
Learning Objective: 13-04 Calculate financial ratios to assess profitability, liquidity, and solvency.
Topic: Ratio Computations
13-34
Copyright © 2017 McGraw-Hill Education. All rights reserved. No reproduction or distribution without the prior written consent of
McGraw-Hill Education.
72. Which of the following actions would likely increase the Return on Equity (ROE)?
A. An increase in the cost of goods sold
C. Issuing shares of preferred stock
D. An increase in the income tax rate
ROE = (Net Income – Preferred Dividends) ÷ Average Stockholder’s Equity) × 100
Purchasing treasury stock decreases stockholder’s equity, which would cause ROE to
increase. An increase in cost of goods sold or in the income tax rate would cause net income
AICPA: BB Industry
AICPA: FN Decision Making
Accessibility: Keyboard Navigation
Blooms: Understand
Difficulty: 2 Medium
Learning Objective: 13-04 Calculate financial ratios to assess profitability, liquidity, and solvency.
Topic: Ratio Computations
73. Vesuvius Company has net sales revenue of $780,000, cost of goods sold of $343,200, net
income of $119,200, and preferred dividends of $10,000 during the current year. At the
beginning of the year, 503,000 shares of common stock were outstanding, and, at the end of
the year, 537,000 shares of common stock were outstanding. A total of 1,000 preferred shares
were outstanding throughout the year. The company’s earnings per share for the current year
is closest to:
A. $1.50.
B. $0.84.
D. $0.87.
AICPA: BB Critical Thinking
AICPA: FN Measurement
Accessibility: Keyboard Navigation
Blooms: Apply
Difficulty: 3 Hard
Learning Objective: 13-04 Calculate financial ratios to assess profitability, liquidity, and solvency.
Topic: Ratio Computations
13-35
Copyright © 2017 McGraw-Hill Education. All rights reserved. No reproduction or distribution without the prior written consent of
McGraw-Hill Education.

74. Which of the following will increase earnings per share?
A. A ten percent increase in net income and a ten percent increase in the average number of
shares of common stock outstanding
B. A ten percent decrease in net income and a ten percent increase in the average number of
shares of common stock outstanding
shares of common stock outstanding
D. A ten percent decrease in net income and a ten percent decrease in the average number
of shares of common stock outstanding
Earnings per share is net income divided by the average number of shares of common stock
outstanding. An increase in the numerator and a decrease in the denominator will increase the
earnings per share.
AICPA: BB Industry
AICPA: FN Decision Making
Accessibility: Keyboard Navigation
Blooms: Understand
Difficulty: 2 Medium
Learning Objective: 13-04 Calculate financial ratios to assess profitability, liquidity, and solvency.
Topic: Ratio Computations
75. A company has earnings per share of $1.20, it paid a dividend of $.50 per share, and the
market price of the company’s stock is $45 per share. The price/earnings ratio is closest to:
B. 64.29.
C. 2.40.
D. 2.0.
AICPA: BB Resource Management
AICPA: FN Measurement
Accessibility: Keyboard Navigation
Blooms: Apply
Difficulty: 2 Medium
Learning Objective: 13-04 Calculate financial ratios to assess profitability, liquidity, and solvency.
Topic: Ratio Computations
13-36
Copyright © 2017 McGraw-Hill Education. All rights reserved. No reproduction or distribution without the prior written consent of
McGraw-Hill Education.
76. A share of stock sells for $20. The company has $64 million in earnings and 200 million
outstanding shares. The Price/Earnings ratio for the company is closest to:
B. 200.
C. 0.31.
D. 6.4.
AICPA: BB Resource Management
AICPA: FN Measurement
Accessibility: Keyboard Navigation
Blooms: Apply
Difficulty: 2 Medium
Learning Objective: 13-04 Calculate financial ratios to assess profitability, liquidity, and solvency.
Topic: Ratio Computations
77. Thomas, Inc. has the following information:
Net income $15,000
Stock price (per share) 20
Average number of shares outstanding 5,000
Average amount of stockholders’ equity 45,000
What is the Price/Earnings ratio?
A. 2.2
B. 4.0
D. 20.0
AICPA: BB Industry
AICPA: FN Decision Making
Accessibility: Keyboard Navigation
Blooms: Apply
Difficulty: 3 Hard
Learning Objective: 13-04 Calculate financial ratios to assess profitability, liquidity, and solvency.
Topic: Ratio Computations
13-37
Copyright © 2017 McGraw-Hill Education. All rights reserved. No reproduction or distribution without the prior written consent of
McGraw-Hill Education.
78. Which of the following is calculated by dividing net sales revenue by average net receivables?
A. Days to sell ratio
B. Current ratio
C. Profit margin
AICPA: BB Critical Thinking
AICPA: FN Measurement
Accessibility: Keyboard Navigation
Blooms: Remember
Difficulty: 1 Easy
Learning Objective: 13-04 Calculate financial ratios to assess profitability, liquidity, and solvency.
Topic: Ratio Computations
79. During the current accounting period, revenue from credit sales is $671,000. The Accounts
Receivable balance is $51,480 at the beginning of the period and $52,200 at the end of the
period. Which of the following statements is correct?
B. On average, it takes 12.9 days to collect payment from credit customers.
C. The receivables turnover ratio is 28.3.
D. On average, the company sells its inventory every 28.3 days.
AICPA: BB Resource Management
AICPA: FN Measurement
Accessibility: Keyboard Navigation
Blooms: Apply
Difficulty: 3 Hard
Learning Objective: 13-04 Calculate financial ratios to assess profitability, liquidity, and solvency.
Topic: Ratio Computations
13-38
Copyright © 2017 McGraw-Hill Education. All rights reserved. No reproduction or distribution without the prior written consent of
McGraw-Hill Education.
80. Cost of goods sold divided by average inventory is the calculation for which of the following
ratios?
A. Net profit margin ratio
B. Current ratio
D. Fixed asset turnover ratio
AICPA: BB Resource Management
AICPA: FN Measurement
Accessibility: Keyboard Navigation
Blooms: Remember
Difficulty: 1 Easy
Learning Objective: 13-04 Calculate financial ratios to assess profitability, liquidity, and solvency.
Topic: Ratio Computations
81. A company has $72,500 of inventory at the beginning of the year and $65,500 at the end of
the year. Sales revenue is $986,400, cost of goods sold is $572,700, and net income is
$124,200 for the year. The inventory turnover ratio is closest to:
A. 1.8.
C. 6.0.
D. 14.3.
AICPA: BB Resource Management
AICPA: FN Measurement
Accessibility: Keyboard Navigation
Blooms: Apply
Difficulty: 2 Medium
Learning Objective: 13-04 Calculate financial ratios to assess profitability, liquidity, and solvency.
Topic: Ratio Computations
13-39
Copyright © 2017 McGraw-Hill Education. All rights reserved. No reproduction or distribution without the prior written consent of
McGraw-Hill Education.
82. A company has $72,500 in inventory at the beginning of the accounting period and $65,500 at
the end of the accounting period. Sales revenue is $986,400, cost of goods sold is $572,700,
and net income is $124,200 for the accounting period. On average, the number of days to sell
inventory is approximately:
A. 203.
C. 61.
D. 26.
AICPA: BB Resource Management
AICPA: FN Measurement
Accessibility: Keyboard Navigation
Blooms: Apply
Difficulty: 2 Medium
Learning Objective: 13-04 Calculate financial ratios to assess profitability, liquidity, and solvency.
Topic: Ratio Computations
83. Which of the following is calculated by dividing cost of goods sold by average inventory and
then dividing this result into 365 days?
A. Inventory turnover
B. Current ratio
C. Days to collect ratio
AICPA: BB Critical Thinking
AICPA: FN Measurement
Accessibility: Keyboard Navigation
Blooms: Remember
Difficulty: 1 Easy
Learning Objective: 13-04 Calculate financial ratios to assess profitability, liquidity, and solvency.
Topic: Ratio Computations
13-40
Copyright © 2017 McGraw-Hill Education. All rights reserved. No reproduction or distribution without the prior written consent of
McGraw-Hill Education.
84. Which of the following ratios is calculated by dividing current assets by current liabilities?
A. Quick ratio
B. Solvency ratio
C. Debt ratio
AICPA: BB Critical Thinking
AICPA: FN Measurement
Accessibility: Keyboard Navigation
Blooms: Remember
Difficulty: 1 Easy
Learning Objective: 13-04 Calculate financial ratios to assess profitability, liquidity, and solvency.
Topic: Ratio Computations
85. A company has current assets of $450,000 and a current ratio is 2.5. Assume that the
company prepays rent for 9 months in the amount of $20,000. The current ratio after this
transaction is closest to:
A. 2.39.
B. 2.61.
D. 2.81.
AICPA: BB Critical Thinking
AICPA: FN Measurement
Accessibility: Keyboard Navigation
Blooms: Analyze
Difficulty: 2 Medium
Learning Objective: 13-04 Calculate financial ratios to assess profitability, liquidity, and solvency.
Topic: Ratio Computations
13-41
Copyright © 2017 McGraw-Hill Education. All rights reserved. No reproduction or distribution without the prior written consent of
McGraw-Hill Education.

86. A company has a debt-to-assets ratio of 0.45. If the company then borrows cash from the bank
to finance a building acquisition, which of the following is a correct statement?
A. The debt-to-assets ratio will be unchanged.
C. The debt-to-assets ratio will decrease.
D. The debt-to-assets ratio will increase as a result of the cash received and then decrease as
a result of the building acquisition.
Debt-to-assets ratio = Total liabilities ÷ Total assets
Currently, the company’s total liabilities are 45% of its total assets; as such, the numerator
was less than the denominator when this ratio was calculated. Borrowing cash will increase
the company’s total liabilities and total assets by the same amount. The effect on the
numerator will be greater since it is a smaller number, so the debt-to-assets ratio will increase.
AICPA: BB Critical Thinking
AICPA: FN Risk Analysis
Accessibility: Keyboard Navigation
Blooms: Analyze
Difficulty: 3 Hard
Learning Objective: 13-04 Calculate financial ratios to assess profitability, liquidity, and solvency.
Topic: Ratio Computations
87. Westcott, Inc. has the following information from its accounting records:
Current assets $40,000
Total assets 100,000
Current liabilities 20,000
Total liabilities 60,000
If Westcott uses cash of $5,000 to pay a current liability, its:
A. current ratio increases and its debt-to-assets ratio increases
C. current ratio decreases and its debt-to-assets ratio increases
D. current ratio decreases and its debt-to-assets ratio decreases
AICPA: BB Industry
AICPA: FN Reporting
13-42
Copyright © 2017 McGraw-Hill Education. All rights reserved. No reproduction or distribution without the prior written consent of
McGraw-Hill Education.

Accessibility: Keyboard Navigation
Blooms: Understand
Difficulty: 2 Medium
Learning Objective: 13-04 Calculate financial ratios to assess profitability, liquidity, and solvency.
Topic: Ratio Computations
88. Company X has net sales revenue of $436,000, cost of goods sold of $343,000, and net
income of $3,000. If interest expense is $10,000 and income tax expense is $1,000, the times
interest earned ratio is closest to:
B. 0.33.
C. 1.3.
D. 0.40.
AICPA: BB Critical Thinking
AICPA: FN Measurement
Accessibility: Keyboard Navigation
Blooms: Apply
Difficulty: 2 Medium
Learning Objective: 13-04 Calculate financial ratios to assess profitability, liquidity, and solvency.
Topic: Ratio Computations
89. The following information is taken from the financial statements of Lopez Company:
Total Assets $200,000
Total Liabilities 90,000
Total Stockholders’ Equity 110,000
Net Income 70,000
Income Tax Expense 21,000
Interest Expense 5,000
The company’s times interest earned ratio is closest to:
B. 4.7.
C. 15.0.
D. 18.2.
AICPA: BB Resource Management
AICPA: FN Measurement
Accessibility: Keyboard Navigation
Blooms: Apply
Difficulty: 2 Medium
Learning Objective: 13-04 Calculate financial ratios to assess profitability, liquidity, and solvency.
13-43
Copyright © 2017 McGraw-Hill Education. All rights reserved. No reproduction or distribution without the prior written consent of
McGraw-Hill Education.

Topic: Ratio Computations
90. The following information comes from the balance sheets and income statements of the
Rocket Company:
As of or for the Year
ended December 31
Current
Year
Prior
Year
Cash $12,000 $10,000
Accounts receivable 19,000 22,000
Inventory 32,000 25,000
Property and equipment 112,000 109,000
Current liabilities 44,000 40,000
Long-term liabilities 53,000 50,000
Stockholders’ equity 78,000 76,000
Net sales revenues 340,000 315,000
Cost of goods sold 220,000 210,000
Operating expenses 80,000 75,000
Interest expense 5,000 4,000
Income tax expense 9,000 8,000
What is the times interest earned ratio for the current year?
A. 2.2
B. 5.2
C. 6.2
AICPA: BB Critical Thinking
AICPA: FN Decision Making
Accessibility: Keyboard Navigation
Blooms: Remember
Learning Objective: 13-04 Calculate financial ratios to assess profitability, liquidity, and solvency.
Topic: Ratio Computations
13-44
Copyright © 2017 McGraw-Hill Education. All rights reserved. No reproduction or distribution without the prior written consent of
McGraw-Hill Education.
91. Which of the following ratios does not use net income in its calculation?
A. Net profit margin
B. Earnings per share
C. Return on equity
AICPA: BB Resource Management
AICPA: FN Measurement
Accessibility: Keyboard Navigation
Blooms: Understand
Difficulty: 2 Medium
Learning Objective: 13-04 Calculate financial ratios to assess profitability, liquidity, and solvency.
Topic: Ratio Computations
92. If a company increases the selling price of the product it sells and all other data on the
financial statements remains the same, which of the following ratios will be unaffected?
A. Fixed asset turnover
B. Net profit margin
D. Earnings per share
If sales revenue increases and all other data on the financial statements remains the same,
there will be an increase in gross profit (sales revenues minus cost of goods sold), an increase
in operating income, and an increase in net income. The fixed asset turnover ratio increases
AICPA: BB Industry
AICPA: FN Reporting
Accessibility: Keyboard Navigation
Blooms: Understand
Difficulty: 2 Medium
Learning Objective: 13-04 Calculate financial ratios to assess profitability, liquidity, and solvency.
Topic: Ratio Computations
13-45
Copyright © 2017 McGraw-Hill Education. All rights reserved. No reproduction or distribution without the prior written consent of
McGraw-Hill Education.
93. At the end of last year, Ace Company had total assets in the amount of $6,000,000 and total
liabilities in the amount of $4,000,000. The company issued shares to new stockholders at the
beginning of the current year for $1,000,000. As a direct result of this transaction, the:
A. debt-to-assets ratio will increase.
C. net profit margin ratio will increase.
D. net profit margin ratio will decrease.
AICPA: BB Industry
AICPA: FN Decision Making
Accessibility: Keyboard Navigation
Blooms: Understand
Difficulty: 2 Medium
Learning Objective: 13-04 Calculate financial ratios to assess profitability, liquidity, and solvency.
Topic: Ratio Computations
94. Which of these is not one of the categories of ratio analysis?
A. Profitability
B. Liquidity
C. Solvency
AICPA: BB Industry
AICPA: FN Decision Making
Accessibility: Keyboard Navigation
Blooms: Remember
Difficulty: 1 Easy
Learning Objective: 13-04 Calculate financial ratios to assess profitability, liquidity, and solvency.
Source: LearnSmart
Topic: Ratio Computations
13-46
Copyright © 2017 McGraw-Hill Education. All rights reserved. No reproduction or distribution without the prior written consent of
McGraw-Hill Education.
95. Which type of ratio indicates a company’s ability to generate income in the current period?
B. Liquidity ratios
C. Solvency ratios
D. Current ratios
Profitability ratios relate to the company’s performance in the current period, in particular, the
company’s ability to generate income. Liquidity ratios relate to the company’s short-term
AICPA: BB Industry
AICPA: FN Decision Making
Accessibility: Keyboard Navigation
Blooms: Understand
Difficulty: 2 Medium
Learning Objective: 13-04 Calculate financial ratios to assess profitability, liquidity, and solvency.
Source: LearnSmart
Topic: Ratio Computations
96. Which of the following is a profitability ratio?
B. Times interest earned
C. Inventory turnover
D. Receivables turnover
Profitability ratios (such as return on equity) relate to the company’s performance in the current
period, in particular, the company’s ability to generate income.
AICPA: BB Industry
AICPA: FN Decision Making
Accessibility: Keyboard Navigation
Blooms: Understand
Difficulty: 2 Medium
Learning Objective: 13-04 Calculate financial ratios to assess profitability, liquidity, and solvency.
Source: LearnSmart
Topic: Ratio Computations
13-47
Copyright © 2017 McGraw-Hill Education. All rights reserved. No reproduction or distribution without the prior written consent of
McGraw-Hill Education.

97. Which of these are liquidity ratios?
A. Net profit margin
C. Fixed asset turnover
D. Times interest earned
Liquidity ratios (such as receivables turnover) relate to the company’s short-term survival, in
particular, the company’s ability to use current assets to repay liabilities as they become due.
AICPA: BB Industry
AICPA: FN Decision Making
Accessibility: Keyboard Navigation
Blooms: Understand
Difficulty: 2 Medium
Learning Objective: 13-04 Calculate financial ratios to assess profitability, liquidity, and solvency.
Source: LearnSmart
Topic: Ratio Computations
98. Which of these ratios measure liquidity?
B. Net profit margin
C. Debt-to-assets ratio
D. Fixed asset turnover
Liquidity ratios (such as receivables turnover) relate to the company’s short-term survival, in
particular, the company’s ability to use current assets to repay liabilities as they become due.
AICPA: BB Industry
AICPA: FN Decision Making
Accessibility: Keyboard Navigation
Blooms: Understand
Difficulty: 2 Medium
Learning Objective: 13-04 Calculate financial ratios to assess profitability, liquidity, and solvency.
Source: LearnSmart
Topic: Ratio Computations
99. Which of these are solvency ratios?
B. Current ratio
C. Return on equity
D. Net profit margin
13-48
Copyright © 2017 McGraw-Hill Education. All rights reserved. No reproduction or distribution without the prior written consent of
McGraw-Hill Education.
AICPA: BB Industry
AICPA: FN Decision Making
Accessibility: Keyboard Navigation
Blooms: Understand
Difficulty: 2 Medium
Learning Objective: 13-04 Calculate financial ratios to assess profitability, liquidity, and solvency.
Source: LearnSmart
Topic: Ratio Computations
100. The comparative financial statements of B. Darin include the following data:
Current
Year
Prior
Year
Income Statement
Net Sales Revenue $130,000 $100,000
Cost of Goods Sold 55,000 47,000
Operating Expenses 39,000 32,000
Interest Expense 3,500 3,500
Income Tax Expense 5,000 4,000
Net Income 27,500 13,500
Balance Sheet
Current Assets 115,000 95,000
Plant, Property and
Equipment, Net 98,000 105,000
Current Liabilities 45,000 38,000
Long-Term Liabilities 43,000 43,000
Stockholders’ Equity 125,000 119,000
Total Liabilities & Stockholders’
Equity 213,000 200,000
The gross profit percentage for the current year is closest to:
A. 42%.
B. 13.5%.
D. 21.15%.
AICPA: BB Critical Thinking
AICPA: FN Measurement
Accessibility: Keyboard Navigation
Blooms: Apply
Difficulty: 2 Medium
Learning Objective: 13-04 Calculate financial ratios to assess profitability, liquidity, and solvency.
Topic: Ratio Computations
13-49
Copyright © 2017 McGraw-Hill Education. All rights reserved. No reproduction or distribution without the prior written consent of
McGraw-Hill Education.

101. The comparative financial statements of B. Darin include the following data:
Current
Year
Prior
Year
Income Statement
Net Sales Revenue $130,000 $100,000
Cost of Goods Sold 55,000 47,000
Operating Expenses 39,000 32,000
Interest Expense 3,500 3,500
Income Tax Expense 5,000 4,000
Net Income 27,500 13,500
Balance Sheet
Current Assets 115,000 95,000
Plant, Property and
Equipment, Net 98,000 105,000
Current Liabilities 45,000 38,000
Long-Term Liabilities 43,000 43,000
Stockholders’ Equity 125,000 119,000
Total Liabilities & Stockholders’
Equity 213,000 200,000
Which of the following would be shown on B. Darin’s horizontal analysis when calculating
percentage changes from the prior year to the current year?
A. An increase in sales revenue of 23%
B. An increase in gross profit of 41.5%
C. An increase in interest expense of 100%
D. An increase in net income of 57%
Gross profit = (Net sales revenue – Cost of goods sold)
Current year:
= $130,000 – $55,000 = $75,000
Prior year:
= $100,000 – $47,000 = $53,000
Percentage change = (Current year’s total – Prior year’s total) ÷ Prior year’s total
($75,000 – $53,000) ÷ $53,000 = 41.5% increase
AICPA: BB Critical Thinking
AICPA: FN Measurement
Accessibility: Keyboard Navigation
Blooms: Apply
Difficulty: 3 Hard

AICPA: BB Critical Thinking
AICPA: FN Measurement
Accessibility: Keyboard Navigation
Blooms: Apply
Difficulty: 2 Medium
Learning Objective: 13-04 Calculate financial ratios to assess profitability, liquidity, and solvency.
Topic: Ratio Computations
13-51
Copyright © 2017 McGraw-Hill Education. All rights reserved. No reproduction or distribution without the prior written consent of
McGraw-Hill Education.
103. Which type of analysis could reveal that a company is relying heavily on debt financing?
B. Horizontal analysis
C. The fixed asset turnover ratio
D. Trend analysis
AICPA: BB Critical Thinking
AICPA: FN Risk Analysis
Accessibility: Keyboard Navigation
Blooms: Understand
Difficulty: 2 Medium
Learning Objective: 13-05 Interpret the results of financial analyses.
Topic: Interpreting Horizontal and Vertical Analyses
104. When evaluating its net profit margin for the current year, Coca Cola would most likely use all
of the following benchmarks except:
B. the Fortune 500’s net profit margin.
C. Pepsico’s net profit margin.
D. the average net profit margin for the soft drink manufacturing industry.
AICPA: BB Industry
AICPA: FN Measurement
Accessibility: Keyboard Navigation
Blooms: Understand
Difficulty: 2 Medium
Learning Objective: 13-05 Interpret the results of financial analyses.
Topic: Interpreting Ratio Analyses
105. If net income is rising, but net sales revenue and the gross profit percentage remain the same,
then:
B. operating expenses are rising.
C. cost of goods sold is falling.
D. cost of goods sold is rising.
AICPA: BB Critical Thinking
13-52
Copyright © 2017 McGraw-Hill Education. All rights reserved. No reproduction or distribution without the prior written consent of
McGraw-Hill Education.
AICPA: FN Risk Analysis
Accessibility: Keyboard Navigation
Blooms: Analyze
Difficulty: 2 Medium
Learning Objective: 13-05 Interpret the results of financial analyses.
Topic: Interpreting Ratio Analyses
106. An increase in the gross profit percentage indicates that:
B. cost of goods sold as a percentage of sales has increased.
C. operating expenses as a percentage of sales have increased.
AICPA: BB Critical Thinking
AICPA: FN Risk Analysis
Accessibility: Keyboard Navigation
Blooms: Analyze
Difficulty: 2 Medium
Learning Objective: 13-05 Interpret the results of financial analyses.
Topic: Interpreting Ratio Analyses
107. Which of the following ratios is used to evaluate how efficient a company is in using its fixed
assets to generate revenues?
A. Current ratio
B. Debt-to-assets ratio
C. Return on fixed assets ratio
AICPA: BB Critical Thinking
AICPA: FN Risk Analysis
Accessibility: Keyboard Navigation
Blooms: Understand
Difficulty: 1 Easy
Learning Objective: 13-05 Interpret the results of financial analyses.
Topic: Interpreting Ratio Analyses
13-53
Copyright © 2017 McGraw-Hill Education. All rights reserved. No reproduction or distribution without the prior written consent of
McGraw-Hill Education.
108. Which ratio is used to evaluate how well a company is managing its property, plant, and
equipment?
A. Receivables turnover
B. Inventory turnover
D. Asset turnover
AICPA: BB Critical Thinking
AICPA: FN Risk Analysis
Accessibility: Keyboard Navigation
Blooms: Understand
Difficulty: 1 Easy
Learning Objective: 13-05 Interpret the results of financial analyses.
Topic: Interpreting Ratio Analyses
109. If net sales revenue for a retail chain has been relatively constant for the last four years, but
the fixed asset turnover has been decreasing, what would be the most likely cause?
B. Cost of Goods sold has been increasing.
C. Employee wages have been increasing.
D. The company has closed some of its stores.
The fixed asset turnover (calculated as net sales revenue ÷ average net fixed assets)
measures the ability of a company’s fixed assets to generate net sales revenue. An expanded
AICPA: BB Industry
AICPA: FN Decision Making
Accessibility: Keyboard Navigation
Blooms: Understand
Difficulty: 2 Medium
Learning Objective: 13-04 Calculate financial ratios to assess profitability, liquidity, and solvency.
Learning Objective: 13-05 Interpret the results of financial analyses.
Topic: Interpreting Horizontal and Vertical Analyses
Topic: Ratio Computations
13-54
Copyright © 2017 McGraw-Hill Education. All rights reserved. No reproduction or distribution without the prior written consent of
McGraw-Hill Education.
110. Which of the following statements about the Price/Earnings ratio is not correct?
A. The Price/Earnings ratio indicates how much investors are willing to pay for a share of a
company’s stock as a multiple of current earnings.
B. A high Price/Earnings ratio may mean that investors have pushed the price of the stock up
in anticipation of higher future net income.
Price/Earnings ratio will decrease.
D. If the market price of the stock increases and there is no change in EPS, the
Price/Earnings ratio will increase.
AICPA: BB Critical Thinking
AICPA: FN Risk Analysis
Accessibility: Keyboard Navigation
Blooms: Analyze
Difficulty: 2 Medium
Learning Objective: 13-05 Interpret the results of financial analyses.
Topic: Interpreting Ratio Analyses
111. E. Choudhury Company’s price/earnings ratio is 15.3. Its closest competitor, Bhatt, Inc. has a
Price/Earnings ratio of 9.4. Which of the following would not be a valid conclusion to draw from
a comparison of the two companies’ Price/Earnings ratios?
A. E. Choudhury Company’s stock is overpriced.
B. Investors believe E. Choudhury Co. has a brighter future than Bhatt, Inc.
C. E. Choudhury Company has been more profitable than Bhatt, Inc.
D. The stock price of E. Choudhury Company has been bid up due to rumors of a merger.
AICPA: BB Critical Thinking
AICPA: FN Risk Analysis
Accessibility: Keyboard Navigation
Blooms: Analyze
Difficulty: 2 Medium
Learning Objective: 13-05 Interpret the results of financial analyses.
Topic: Interpreting Ratio Analyses
13-55
Copyright © 2017 McGraw-Hill Education. All rights reserved. No reproduction or distribution without the prior written consent of
McGraw-Hill Education.
112. A decrease in receivables turnover ratio is indicative of:
A. an increase in sales revenue.
B. slower-selling inventory.
D. a decline in cost of goods sold.
AICPA: BB Critical Thinking
AICPA: FN Risk Analysis
Accessibility: Keyboard Navigation
Blooms: Understand
Difficulty: 2 Medium
Learning Objective: 13-05 Interpret the results of financial analyses.
Topic: Interpreting Ratio Analyses
113. Kirk Furniture Company had net Accounts Receivable of $750,000 at the beginning of the year
and $925,000 at the end of the year. Net Sales Revenue for 2010 was $6,500,000. What is the
days to collect from customers?
A. 60.00
B. 42.12
C. 51.94
AICPA: BB Industry
AICPA: FN Decision Making
Accessibility: Keyboard Navigation
Blooms: Apply
Difficulty: 3 Hard
Learning Objective: 13-04 Calculate financial ratios to assess profitability, liquidity, and solvency.
Learning Objective: 13-05 Interpret the results of financial analyses.
Topic: Ratio Computations
13-56
Copyright © 2017 McGraw-Hill Education. All rights reserved. No reproduction or distribution without the prior written consent of
McGraw-Hill Education.
114. If cost of goods sold remains unchanged, an increase in the inventory turnover ratio is
indicative of a(n):
A. reduction in the cost of goods sold.
C. increase in inventory.
D. increase in sales revenue.
AICPA: BB Critical Thinking
AICPA: FN Risk Analysis
Accessibility: Keyboard Navigation
Blooms: Understand
Difficulty: 2 Medium
Learning Objective: 13-05 Interpret the results of financial analyses.
Topic: Interpreting Ratio Analyses
115. The ratio that measures how many times a company replenishes its inventory in a year is the:
A. days to sell ratio.
B. receivables turnover ratio.
D. days to collect ratio.
AICPA: BB Resource Management
AICPA: FN Risk Analysis
Accessibility: Keyboard Navigation
Blooms: Understand
Difficulty: 2 Medium
Learning Objective: 13-05 Interpret the results of financial analyses.
Topic: Interpreting Ratio Analyses
13-57
Copyright © 2017 McGraw-Hill Education. All rights reserved. No reproduction or distribution without the prior written consent of
McGraw-Hill Education.

116. Assume that Charmin and Barker are two retailers selling different goods. Charmin reports a
days to sell ratio of 6 and Barker reports a days to sell ratio of 64. What types of merchandise
are Charmin and Barker likely to sell, given their measures of days to sell?
A. Charmin sells clothing and Barker sells wine.
B. Charmin sells consumer electronics and Barker sells gasoline.
C. Charmin sells footwear and Barker sells consumer electronics.
AICPA: BB Critical Thinking
AICPA: FN Decision Making
Accessibility: Keyboard Navigation
Blooms: Remember
Difficulty: 2 Medium
Learning Objective: 13-05 Interpret the results of financial analyses.
Topic: Interpreting Horizontal and Vertical Analyses
117. Judging only from the ratios below, which of the following clothing wholesalers is least likely to
be having cash flow problems?
A. Company A: Receivable turnover of 5; inventory turnover of 2
B. Company B: Receivable turnover of 2; inventory turnover of 5
D. Company D: Receivable turnover of 1; inventory turnover of 1
The two ratios are liquidity, which focus on the company’s ability to survive in the short term,
by converting assets to cash that can be used to pay current liabilities as they come due.
AICPA: BB Critical Thinking
AICPA: FN Risk Analysis
Accessibility: Keyboard Navigation
Blooms: Evaluate
Difficulty: 1 Easy
Learning Objective: 13-05 Interpret the results of financial analyses.
Topic: Interpreting Ratio Analyses
13-58
Copyright © 2017 McGraw-Hill Education. All rights reserved. No reproduction or distribution without the prior written consent of
McGraw-Hill Education.
118. A current ratio of 2.5 means that for every dollar of:
A. accounts payable, there is $2.50 of cash.
C. current assets, there is $2.50 of current liabilities.
D. total liabilities, there is $2.50 of cash.
AICPA: BB Critical Thinking
AICPA: FN Risk Analysis
Accessibility: Keyboard Navigation
Blooms: Understand
Difficulty: 2 Medium
Learning Objective: 13-05 Interpret the results of financial analyses.
Topic: Interpreting Ratio Analyses
119. Listed below are the current ratios of four different companies. Based on these current ratios,
which company is in the most liquid position?
A. 2.0
B. 1.8
D. 2.1
AICPA: BB Critical Thinking
AICPA: FN Decision Making
Accessibility: Keyboard Navigation
Blooms: Remember
Difficulty: 2 Medium
Learning Objective: 13-05 Interpret the results of financial analyses.
Topic: Interpreting Horizontal and Vertical Analyses
13-59
Copyright © 2017 McGraw-Hill Education. All rights reserved. No reproduction or distribution without the prior written consent of
McGraw-Hill Education.
120. A company that has a current ratio less than one cannot cover:
A. current liabilities with its current cash flow.
B. current expenses with its current sales revenue.
C. expenses with its current revenues.
AICPA: BB Resource Management
AICPA: FN Risk Analysis
Accessibility: Keyboard Navigation
Blooms: Understand
Difficulty: 1 Easy
Learning Objective: 13-05 Interpret the results of financial analyses.
Topic: Interpreting Ratio Analyses
121. A current ratio of less than one is not so much of a concern when the company has a:
A. low fixed asset turnover ratio.
B. high days to collect number.
D. high debt-to-equity ratio.
AICPA: BB Critical Thinking
AICPA: FN Risk Analysis
Accessibility: Keyboard Navigation
Blooms: Analyze
Difficulty: 2 Medium
Learning Objective: 13-05 Interpret the results of financial analyses.
Topic: Interpreting Ratio Analyses
122. The debt-to-assets ratio is the:
A. ratio of current liabilities to current assets.
B. ratio of long term liabilities to fixed assets.
D. proportion of short-term liabilities to total liabilities.
AICPA: BB Resource Management
AICPA: FN Measurement
Accessibility: Keyboard Navigation
13-60
Copyright © 2017 McGraw-Hill Education. All rights reserved. No reproduction or distribution without the prior written consent of
McGraw-Hill Education.

Blooms: Remember
Difficulty: 1 Easy
Learning Objective: 13-05 Interpret the results of financial analyses.
Topic: Interpreting Ratio Analyses
123. The ratio that measures the percentage of financing from creditors is the:
A. current ratio.
B. times interest earned ratio.
D. Price/Earnings ratio.
The debt-to-assets ratio indicates the proportion of total assets that creditors finance. The
AICPA: BB Critical Thinking
AICPA: FN Risk Analysis
Accessibility: Keyboard Navigation
Blooms: Understand
Difficulty: 1 Easy
Learning Objective: 13-05 Interpret the results of financial analyses.
Topic: Interpreting Ratio Analyses
124. A debt-to-assets ratio of 0.50 indicates that the company has:
A. more liabilities than stockholders’ equity.
C. more stockholders’ equity than liabilities.
D. no liabilities.
A debt-to-assets ratio of 0.50 indicates the proportion of total assets that creditors finance is
0.50; as such, an equal proportion is from equity financing.
AACSB: Analytical Thinking
AICPA: BB Critical Thinking
AICPA: FN Risk Analysis
Accessibility: Keyboard Navigation
Blooms: Analyze
Difficulty: 2 Medium
Learning Objective: 13-05 Interpret the results of financial analyses.
Topic: Interpreting Ratio Analyses
13-61
Copyright © 2017 McGraw-Hill Education. All rights reserved. No reproduction or distribution without the prior written consent of
McGraw-Hill Education.
125. Which of the following could indicate bad news?
A. An increase in fixed asset turnover ratio
B. A decrease in days to sell
D. A decrease in the debt-to-assets ratio
AICPA: BB Critical Thinking
AICPA: FN Risk Analysis
Accessibility: Keyboard Navigation
Blooms: Analyze
Difficulty: 2 Medium
Learning Objective: 13-05 Interpret the results of financial analyses.
Topic: Interpreting Ratio Analyses
126. A company has a debt-to-assets ratio of 0.45 and a return on equity ratio of 10%. If the
company then issues additional shares of common stock for cash, which of the following is a
correct statement?
B. The debt-to-assets ratio will increase and the return on equity ratio will increase.
C. The debt-to-assets ratio will not change and the return on equity ratio will not change.
D. The debt-to-assets ratio will decrease and the return on equity ratio will increase.
AICPA: BB Critical Thinking
AICPA: FN Risk Analysis
Accessibility: Keyboard Navigation
Blooms: Analyze
Difficulty: 2 Medium
Learning Objective: 13-05 Interpret the results of financial analyses.
Topic: Interpreting Ratio Analyses
13-62
Copyright © 2017 McGraw-Hill Education. All rights reserved. No reproduction or distribution without the prior written consent of
McGraw-Hill Education.

127. A times interest earned ratio of 11 means that the company’s:
A. net income is large enough to pay interest and taxes 11 times.
B. net cash flow from operations before taxes and interest is large enough to pay interest and
taxes 11 times.
C. net cash flow from operations is large enough to pay interest and taxes 11 times.
Times interest earned = (Net income + Interest expense + Income tax expense) ÷ Interest
Expense
This ratio indicates how many times the company’s interest expense was covered by its
operating income. Or, in other words, the company’s net income before interest expense and
AICPA: BB Critical Thinking
AICPA: FN Risk Analysis
Accessibility: Keyboard Navigation
Blooms: Understand
Difficulty: 2 Medium
Learning Objective: 13-05 Interpret the results of financial analyses.
Topic: Interpreting Ratio Analyses
128. The ratio that measures the company’s ability to meet required interest payments is the:
A. debt-to-equity ratio.
B. current ratio.
C. Price/Earnings ratio.
AICPA: BB Critical Thinking
AICPA: FN Risk Analysis
Accessibility: Keyboard Navigation
Blooms: Understand
Difficulty: 1 Easy
Learning Objective: 13-05 Interpret the results of financial analyses.
Topic: Interpreting Ratio Analyses
13-63
Copyright © 2017 McGraw-Hill Education. All rights reserved. No reproduction or distribution without the prior written consent of
McGraw-Hill Education.
129. The conceptual framework for financial accounting and reporting consists of which three main
components?
A. Goals, Concepts, and Exceptions.
B. Objective, Codes, and Guidelines.
D. Concepts, Principles, and Practices.
AICPA: BB Industry
AICPA: FN Reporting
Accessibility: Keyboard Navigation
Blooms: Remember
Difficulty: 1 Easy
Learning Objective: 13-06 Describe how analyses depend on key accounting decisions and concepts.
Topic: Underlying Decisions and Concepts
130. Which of the following will not improve a company’s gross profit percentage?
A. An increase in the sales price
B. A decrease in the cost of inventory
C. A decrease in the shipping cost for merchandise purchased
Gross profit percentage = [(Net Sales – Cost of Goods Sold) ÷ Net Sales] × 100
An increase in the sales price, a decrease in the cost of inventory, and/or a decrease in the
shipping cost for merchandise purchased would improve a company’s gross profit percentage.
AICPA: BB Industry
AICPA: FN Decision Making
Accessibility: Keyboard Navigation
Blooms: Understand
Difficulty: 2 Medium
Learning Objective: 13-05 Interpret the results of financial analyses.
Source: LearnSmart
Topic: Interpreting Horizontal and Vertical Analyses
13-64
Copyright © 2017 McGraw-Hill Education. All rights reserved. No reproduction or distribution without the prior written consent of
McGraw-Hill Education.
131. Puffin Turnovers, Inc.’s fixed asset turnover was 0.9 while Muffin Tops, Inc.’s fixed asset
turnover was 0.6. Which of the following statements about Puffin compared with Muffin is
correct?
B. Puffin has greater depreciation expense.
C. Puffin has more fixed assets.
D. Puffin has greater sales.
AICPA: BB Industry
AICPA: FN Decision Making
Accessibility: Keyboard Navigation
Blooms: Understand
Difficulty: 2 Medium
Learning Objective: 13-05 Interpret the results of financial analyses.
Source: LearnSmart
Topic: Interpreting Horizontal and Vertical Analyses
132. Company A has a receivables turnover of 8.0. Company B has a receivables turnover of 10.0.
Which of the following statements is correct?
A. Company A collects its receivables faster than Company B.
B. Company B collects its receivables faster than Company A.
C. Company A makes more sales on account than Company B.
D. Company B makes more sales on account than Company A.
AICPA: BB Industry
AICPA: FN Decision Making
Accessibility: Keyboard Navigation
Blooms: Understand
Difficulty: 2 Medium
Learning Objective: 13-05 Interpret the results of financial analyses.
Source: LearnSmart
Topic: Interpreting Horizontal and Vertical Analyses
13-65
Copyright © 2017 McGraw-Hill Education. All rights reserved. No reproduction or distribution without the prior written consent of
McGraw-Hill Education.
133. Which of the following would improve a current ratio that is now 1.2?
B. Purchasing land for cash
C. Buying equipment in exchange for a two-year note
D. Purchasing inventory on account
AICPA: BB Industry
AICPA: FN Decision Making
Accessibility: Keyboard Navigation
Blooms: Understand
Difficulty: 2 Medium
Learning Objective: 13-05 Interpret the results of financial analyses.
Source: LearnSmart
Topic: Interpreting Horizontal and Vertical Analyses
134. How competitors calculate depreciation is most likely to affect comparisons between
competitors if property, plant and equipment:
B. makes up a small percentage of assets and assets are financed in a different way.
C. makes up a small percentage of assets and average useful lives are fairly similar.
D. is primarily leased in the industry, not purchased.
AICPA: BB Critical Thinking
AICPA: FN Risk Analysis
Accessibility: Keyboard Navigation
Blooms: Analyze
Difficulty: 2 Medium
Learning Objective: 13-06 Describe how analyses depend on key accounting decisions and concepts.
Topic: Underlying Accounting Decisions and Concepts
13-66
Copyright © 2017 McGraw-Hill Education. All rights reserved. No reproduction or distribution without the prior written consent of
McGraw-Hill Education.
135. How competitors calculate inventory cost is least likely to affect comparisons between
competitors if inventory makes up a:
A. large percentage of assets and inventory costs are stable.
B. large percentage of assets and inventory costs are not stable.
C. small percentage of assets and inventory costs are not stable.
D. small percentage of assets and inventory costs are stable.
AICPA: BB Critical Thinking
AICPA: FN Risk Analysis
Accessibility: Keyboard Navigation
Blooms: Analyze
Difficulty: 2 Medium
Learning Objective: 13-06 Describe how analyses depend on key accounting decisions and concepts.
Topic: Underlying Accounting Decisions and Concepts
136. Company A uses the FIFO inventory method and Company B uses the LIFO method. If prices
are rising and there are no other significant differences between the companies, which of the
following is correct?
A. Company A will report a higher current ratio and lower earnings per share than Company
B.
B. Company A will report a higher current ratio and higher earnings per share than Company
B.
C. Company A will report a lower current ratio and higher earnings per share than Company
B.
D. Company A will report a lower current ratio and lower earnings per shares than Company
AICPA: BB Critical Thinking
AICPA: FN Risk Analysis
Accessibility: Keyboard Navigation
Blooms: Analyze
Difficulty: 3 Hard
Learning Objective: 13-04 Calculate financial ratios to assess profitability, liquidity, and solvency.
Learning Objective: 13-06 Describe how analyses depend on key accounting decisions and concepts.
Topic: Ratio Computations
Topic: Underlying Accounting Decisions and Concepts
13-67
Copyright © 2017 McGraw-Hill Education. All rights reserved. No reproduction or distribution without the prior written consent of
McGraw-Hill Education.
137. The going-concern assumption states that the:
A. company will always maximize the profit for stockholders.
C. company is a separate concern from the stockholders.
D. company’s results will be reported in a consistent manner from period to period.
AICPA: BB Critical Thinking
AICPA: FN Risk Analysis
Accessibility: Keyboard Navigation
Blooms: Remember
Difficulty: 1 Easy
Learning Objective: 13-06 Describe how analyses depend on key accounting decisions and concepts.
Topic: Underlying Accounting Decisions and Concepts
138. Which of the following nonfinancial factors is most likely to be a cause of a going-concern
problem?
A. Hiring a new CEO
C. Announcing a new stock issue
D. Replacing an old product line
AICPA: BB Critical Thinking
AICPA: FN Risk Analysis
Accessibility: Keyboard Navigation
Blooms: Analyze
Difficulty: 2 Medium
Learning Objective: 13-06 Describe how analyses depend on key accounting decisions and concepts.
Topic: Underlying Accounting Decisions and Concepts
13-68
Copyright © 2017 McGraw-Hill Education. All rights reserved. No reproduction or distribution without the prior written consent of
McGraw-Hill Education.
139. Which of the following factors would cause the least amount of concern about a company’s
ability to continue as a going-concern?
A. Excessive reliance on debt financing
B. Loss of key personnel without comparable replacement
C. Inadequate maintenance of long-lived assets
AICPA: BB Critical Thinking
AICPA: FN Risk Analysis
Accessibility: Keyboard Navigation
Blooms: Understand
Difficulty: 2 Medium
Learning Objective: 13-06 Describe how analyses depend on key accounting decisions and concepts.
Topic: Underlying Accounting Decisions and Concepts
140. The full disclosure principle refers to:
A. Financial reports should disclose only material transactions related to a company’s
business activities.
B. Financial reports should disclose every transaction related to a company’s business
activities.
company’s business activities.
D. Financial reports should disclose all future transactions related to a company’s business
AICPA: BB Industry
AICPA: FN Reporting
Accessibility: Keyboard Navigation
Blooms: Remember
Difficulty: 1 Easy
Learning Objective: 13-06 Describe how analyses depend on key accounting decisions and concepts.
Topic: Underlying Decisions and Concepts
13-69
Copyright © 2017 McGraw-Hill Education. All rights reserved. No reproduction or distribution without the prior written consent of
McGraw-Hill Education.
141. The primary objective of financial accounting and reporting is to provide:
B. going concern information.
C. ratio analysis.
D. solvency.
AICPA: BB Critical Thinking
AICPA: FN Measurement
Accessibility: Keyboard Navigation
Blooms: Remember
Difficulty: 1 Easy
Learning Objective: 13-06 Describe how analyses depend on key accounting decisions and concepts.
Source: LearnSmart
Topic: Underlying Decisions and Concepts
142. Which events may indicate going-concern problems?
A. An increase in research and development costs
B. A decrease in barriers to expansion
C. Additions of patents
AICPA: BB Critical Thinking
AICPA: FN Risk Analysis
Accessibility: Keyboard Navigation
Blooms: Understand
Difficulty: 2 Medium
Learning Objective: 13-06 Describe how analyses depend on key accounting decisions and concepts.
Source: LearnSmart
Topic: Underlying Decisions and Concepts
13-70
Copyright © 2017 McGraw-Hill Education. All rights reserved. No reproduction or distribution without the prior written consent of
McGraw-Hill Education.
143. The assumption that a business is capable of continuing its operations long enough to meet its
obligations is called the:
A. solvency assumption.
C. profitability assumption.
D. liquidity assumption.
AICPA: BB Critical Thinking
AICPA: FN Measurement
Accessibility: Keyboard Navigation
Blooms: Remember
Difficulty: 1 Easy
Learning Objective: 13-06 Describe how analyses depend on key accounting decisions and concepts.
Source: LearnSmart
Topic: Underlying Decisions and Concepts
144. The principle that requires companies to include notes to their financial statements is the:
B. going-concern principle.
C. cost-benefit principle.
D. historical cost principle.
AICPA: BB Critical Thinking
AICPA: FN Measurement
Accessibility: Keyboard Navigation
Blooms: Remember
Difficulty: 1 Easy
Learning Objective: 13-06 Describe how analyses depend on key accounting decisions and concepts.
Source: LearnSmart
Topic: Underlying Decisions and Concepts
13-71
Copyright © 2017 McGraw-Hill Education. All rights reserved. No reproduction or distribution without the prior written consent of
McGraw-Hill Education.
145. Extraordinary items:
B. include gains and losses from sales of noncurrent assets.
C. are recurring and frequent in occurrence.
D. are included in the determination of gross profit.
AICPA: BB Critical Thinking
AICPA: FN Measurement
Accessibility: Keyboard Navigation
Blooms: Remember
Difficulty: 1 Easy
Learning Objective: 13-06 Describe how analyses depend on key accounting decisions and concepts.
Source: LearnSmart
Topic: Underlying Decisions and Concepts
146. Comprehensive income may be shown on:
A. the balance sheet as a contra-asset account and reports the changes in investments’ fair
value.
currency exchange rates and certain investments.
C. IFRS financial statements only.
D. non-public companies’ financial statements only.
In some cases, you may see that companies include additional items on their income
statements after the net income line. These items may be added to or subtracted from net
AICPA: BB Critical Thinking
AICPA: FN Measurement
Accessibility: Keyboard Navigation
Blooms: Remember
Difficulty: 1 Easy
Learning Objective: 13-06 Describe how analyses depend on key accounting decisions and concepts.
Source: LearnSmart
Topic: Underlying Decisions and Concepts
Essay Questions
13-72
Copyright © 2017 McGraw-Hill Education. All rights reserved. No reproduction or distribution without the prior written consent of
McGraw-Hill Education.
147. The income statements for Urban Outfits, Inc. are presented below:
Urban Outfits, Inc.
Income Statements
Year Ended December 31
Prior Year Current
Year
Sales revenue $731,559 $683,700
Cost of goods sold 358,719 329,100
Gross profit 372,840 354,600
Operating and other
expenses 122,960 114,400
Interest expense 6,600 8,500
Income tax expense 37,200 36,700
Net income $206,080 $195,000
Required:
Part a. Prepare a horizontal analysis of the income statement above. Round to the nearest
whole percent.
Part b. Interpret your analysis. Comment on significant changes.

AACSB: Communication
AICPA: BB Critical Thinking
AICPA: FN Measurement
AICPA: FN Risk Analysis
Blooms: Analyze
Blooms: Apply
Difficulty: 2 Medium
Learning Objective: 13-02 Use horizontal (trend) analyses to recognize financial changes that unfold over time.
Learning Objective: 13-05 Interpret the results of financial analyses.
Topic: Horizontal (Trend) Computations
Topic: Interpreting Horizontal and Vertical Analyses
13-74
Copyright © 2017 McGraw-Hill Education. All rights reserved. No reproduction or distribution without the prior written consent of
McGraw-Hill Education.
13-75
Copyright © 2017 McGraw-Hill Education. All rights reserved. No reproduction or distribution without the prior written consent of
McGraw-Hill Education.
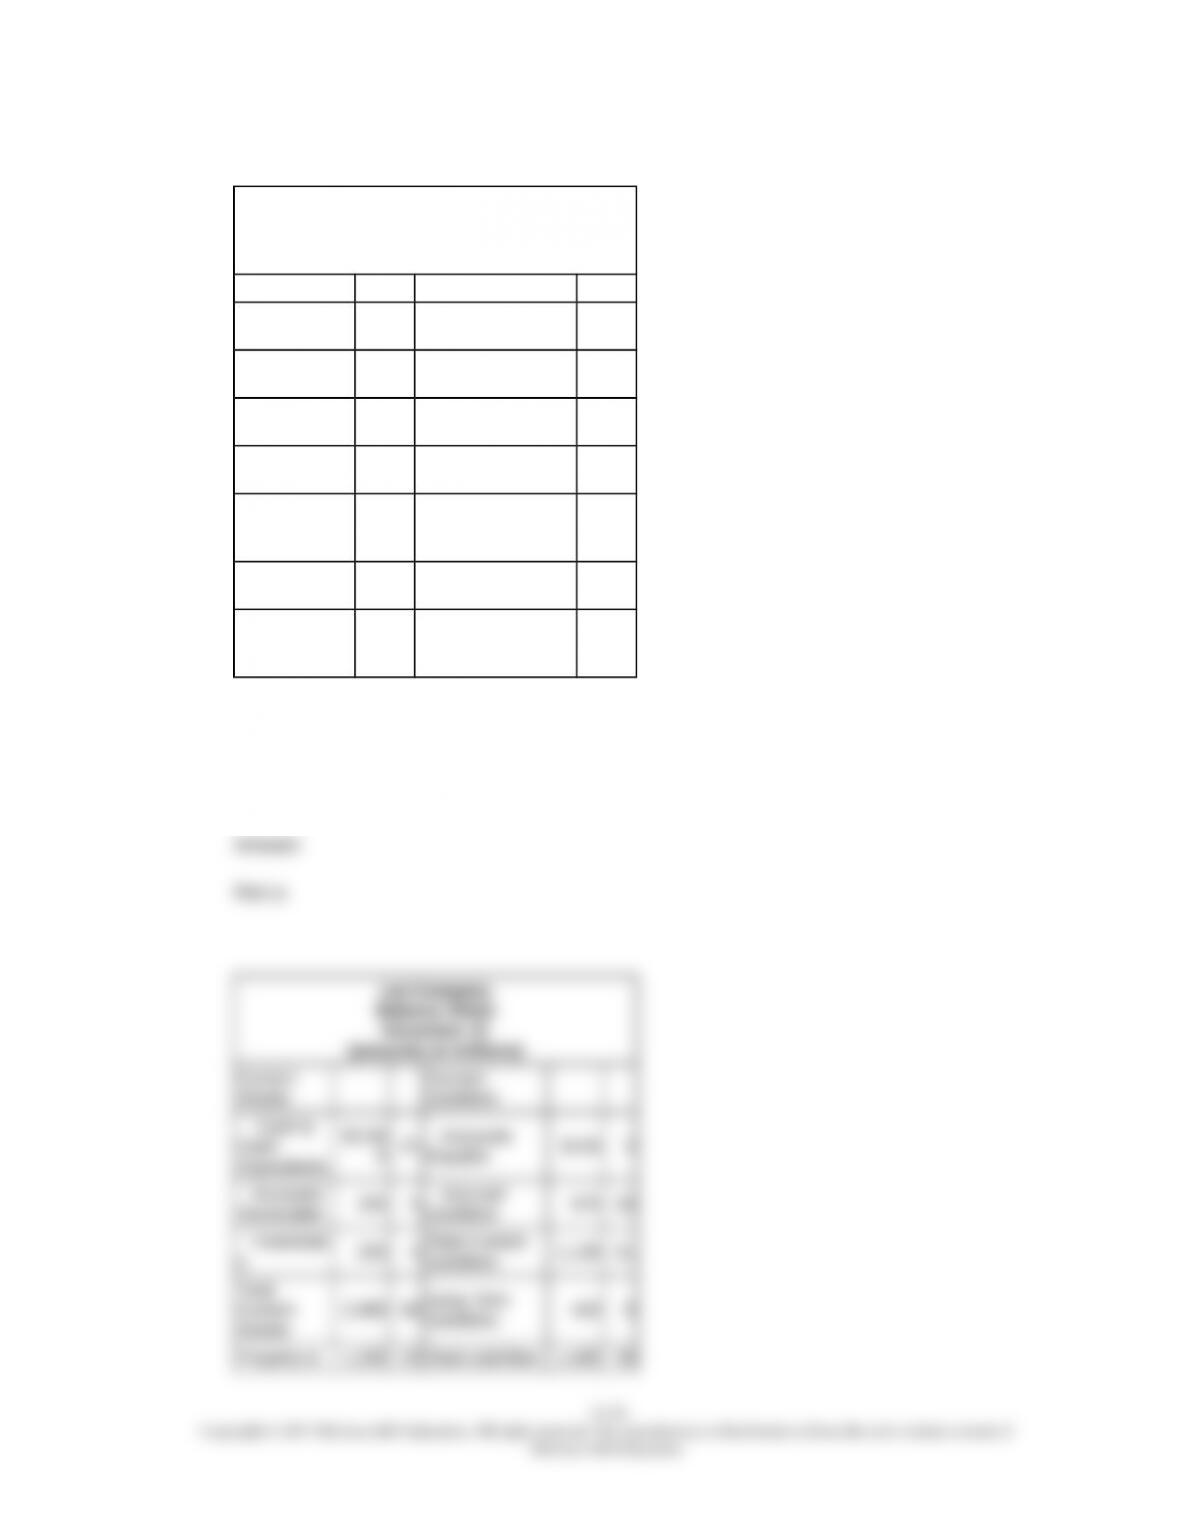
148. A condensed balance sheet for Liu Company is presented below:
Liu Company
Balance Sheet
December 31
(amounts in millions)
Current Assets Current Liabilities
Cash & Cash
Equivalents $2,500 Accounts
Payable $155
Accounts
Receivable 255 Accrued
Liabilities 975
Inventories 225 Total Current
Liabilities 1,130
Total Current
Assets 2,980 Long-Term
Liabilities 450
Property &
Equipment,
Net
1,200 Total Liabilities 1,580
Long-Term
Investments 1,100 Total Stockholders’
Equity 3,700
Total Assets $5,280
Total Liabilities &
Stockholders’
Equity
$5,280
Required:
Part a. Prepare a vertical analysis of the balance sheet above. Round to the nearest whole
percent.
Part b. Interpret your analysis. Identify significant items. Comment on key relationships.
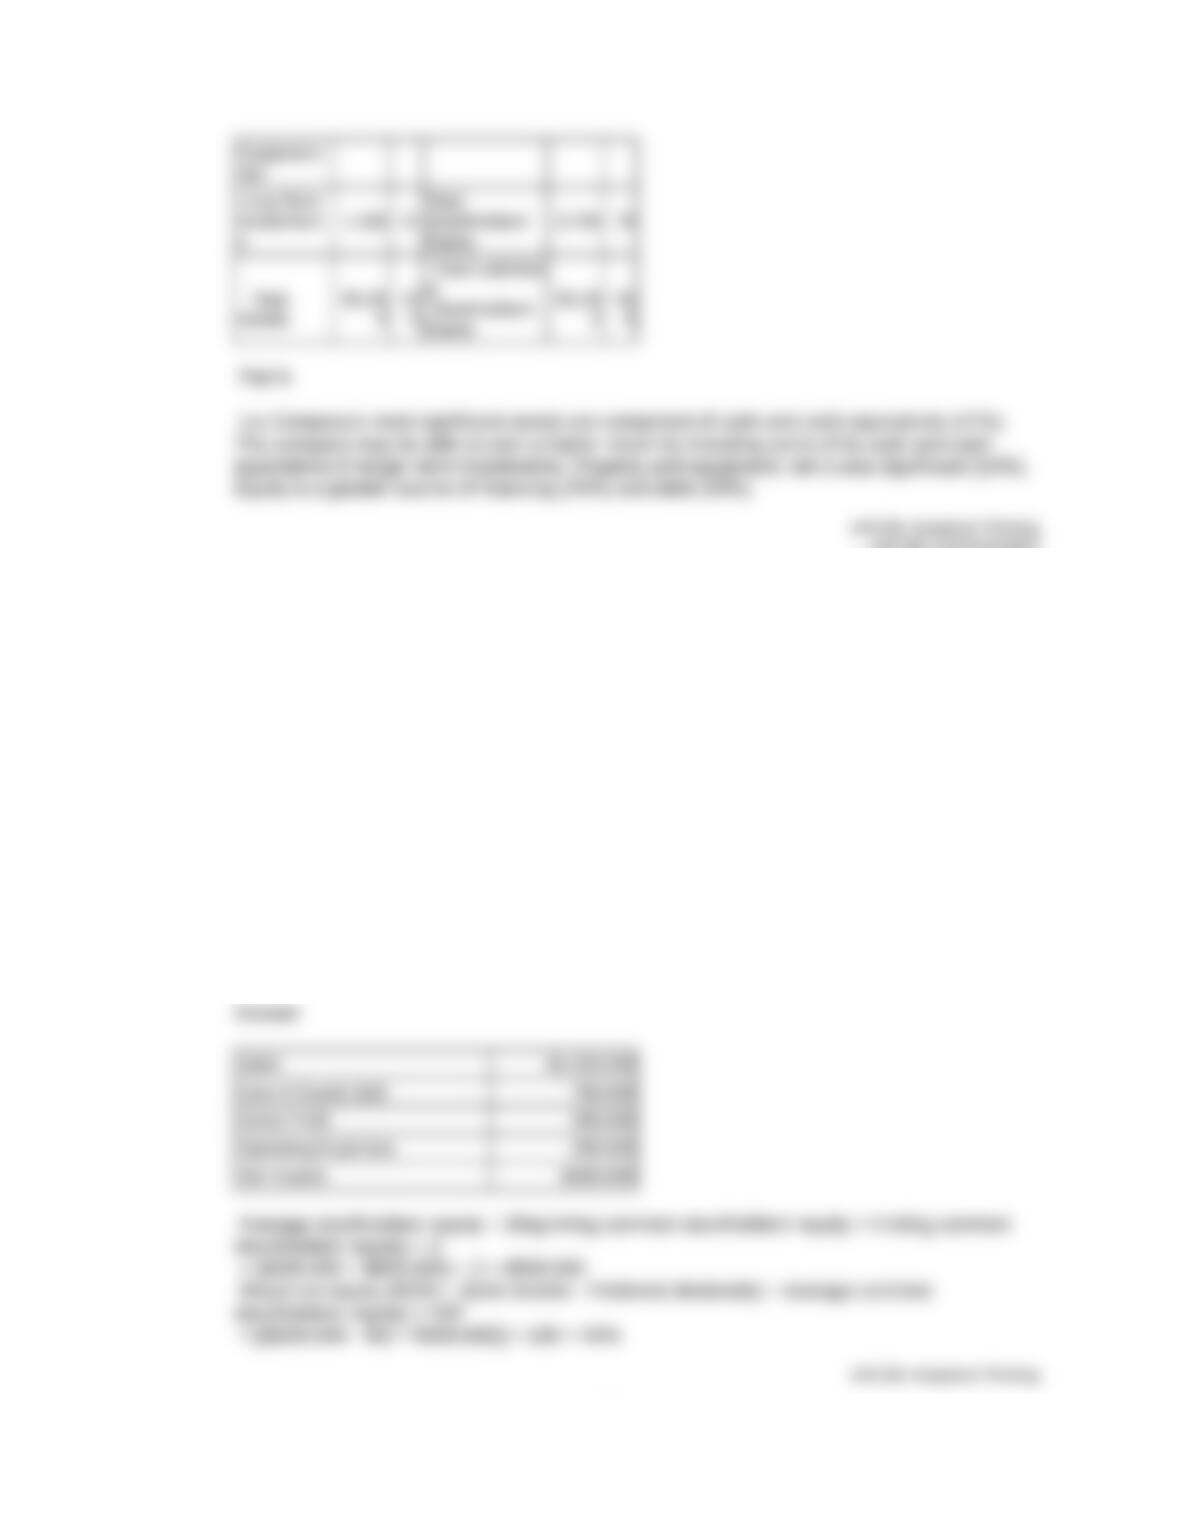
AACSB: Communication
AICPA: BB Critical Thinking
AICPA: FN Measurement
Blooms: Analyze
Blooms: Apply
Difficulty: 2 Medium
Learning Objective: 13-03 Use vertical (common size) analyses to understand important relationships within financial
statements.
Learning Objective: 13-05 Interpret the results of financial analyses.
Topic: Interpreting Horizontal and Vertical Analyses
Topic: Vertical (Common Size) Computations
149. Company X has net sales revenue of $1,250,000, cost of goods sold of $760,000, and all
other expenses of $290,000. The beginning balance of stockholders’ equity is $400,000 and
the beginning balance of fixed assets is $361,000. The ending balance of stockholders’ equity
is $600,000 and the ending balance of fixed assets is $389,000.
Required:
Compute the return on equity (ROE) ratio.
13-77
Copyright © 2017 McGraw-Hill Education. All rights reserved. No reproduction or distribution without the prior written consent of
McGraw-Hill Education.

AICPA: BB Critical Thinking
AICPA: FN Measurement
Blooms: Apply
Difficulty: 2 Medium
Learning Objective: 13-04 Calculate financial ratios to assess profitability, liquidity, and solvency.
Topic: Ratio Computations
150. Choose the appropriate letter match each financial performance ratios with the appropriate
category.
Ratio
___ Debt-to-assets ratio
___ Receivables turnover ratio
___ Fixed asset turnover ratio
___ Current ratio
___ Return on equity
___ Price earnings ratio
___ Times interest earned ratio
___ Quick ratio
___ Inventory turnover ratio
___ Earnings per share
Category
P – Profitability
L – Liquidity
S – Solvency
AICPA: BB Critical Thinking
AICPA: FN Measurement
Blooms: Understand
Difficulty: 2 Medium
Learning Objective: 13-05 Interpret the results of financial analyses.
Topic: Interpreting Ratio Analyses
13-78
Copyright © 2017 McGraw-Hill Education. All rights reserved. No reproduction or distribution without the prior written consent of
McGraw-Hill Education.

151. Consider the formula used to calculate each of the following financial performance ratios.
From the list of financial statement items below, match its letter with the ratio it is used to
calculate. Some financial statement items will be used more than once. Some ratios will use
one letter from the list and some ratios will use two letters from the list.
Ratio
___ Net Profit Margin
___ Debt-to-assets ratio
___ EPS
___ ROE
___ Days to collect
___ Days to sell
___ Price earnings ratio
___ Current ratio
___ Fixed asset turnover
___ Gross profit percentage
___ Quick ratio
Financial Statement Item
A) Net income
B) Interest paid
C) Cost of goods sold
D) Net sales revenue
E) Total liabilities
F) Total assets at year end
G) Average stockholders’ equity
H) Current liabilities
AICPA: BB Critical Thinking
AICPA: FN Measurement
Blooms: Remember
Difficulty: 2 Medium
Learning Objective: 13-04 Calculate financial ratios to assess profitability, liquidity, and solvency.
Topic: Ratio Computations
13-79
Copyright © 2017 McGraw-Hill Education. All rights reserved. No reproduction or distribution without the prior written consent of
McGraw-Hill Education.
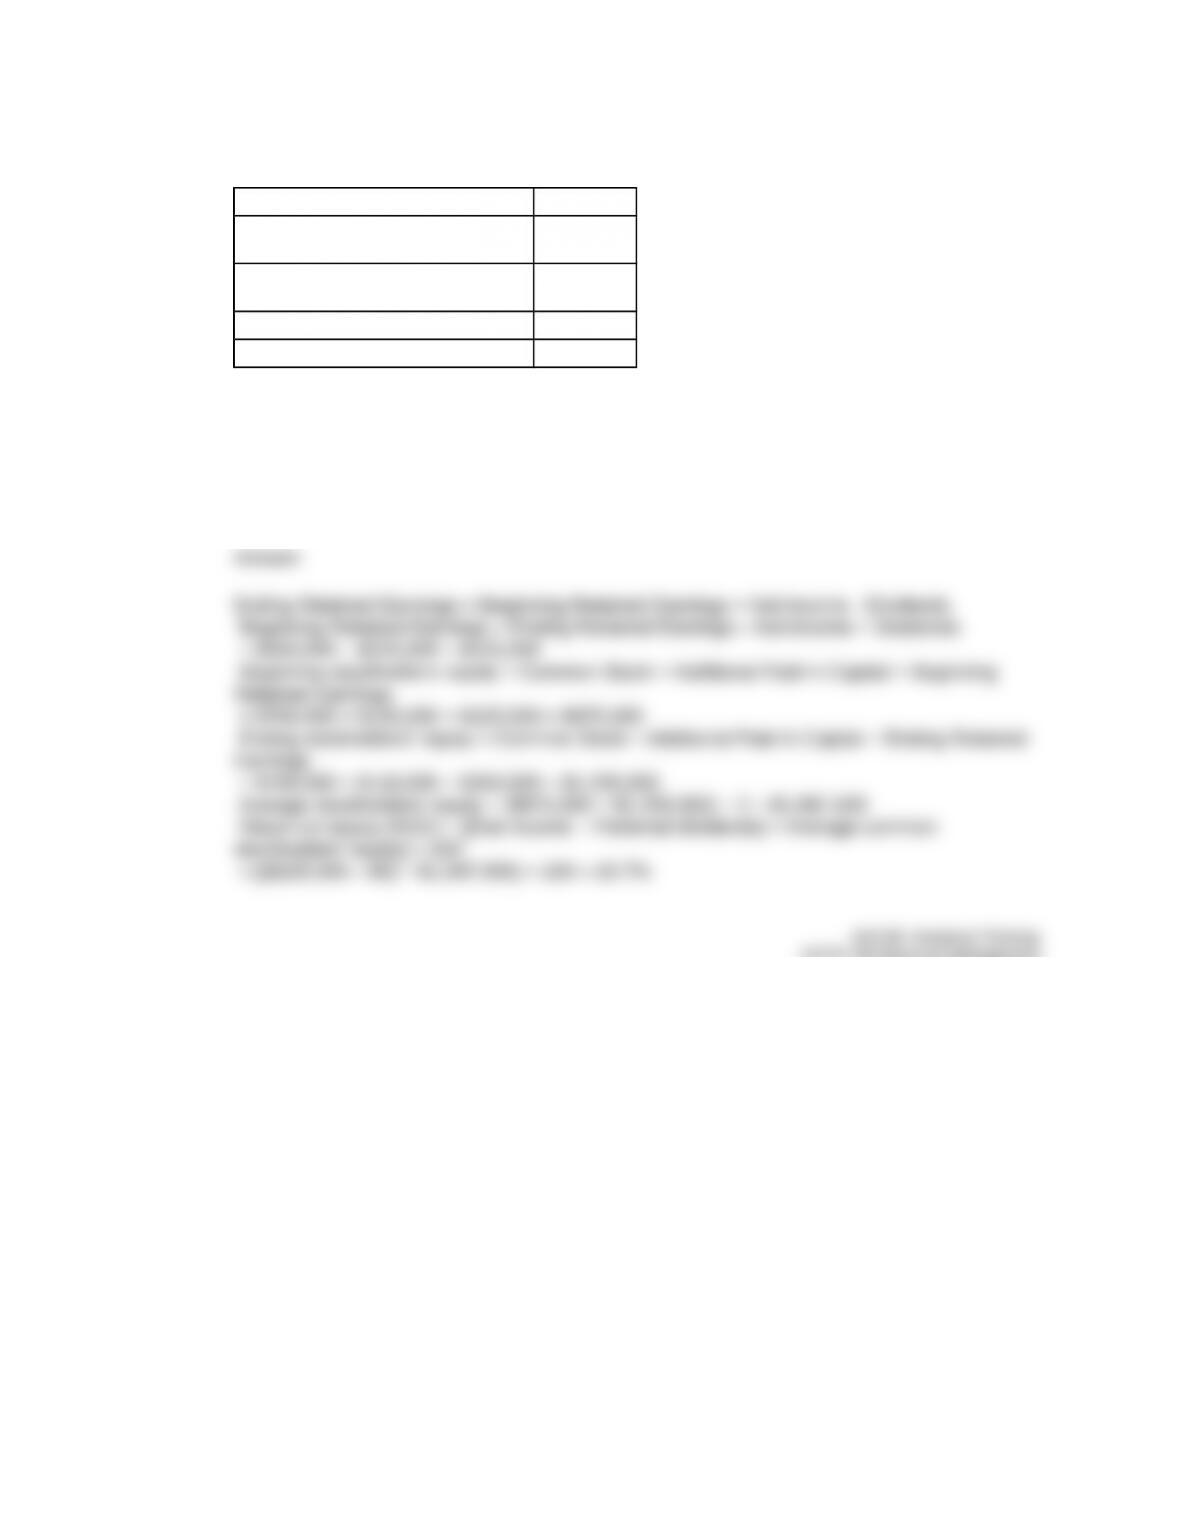
152. A company provided the following information:
Common Stock, end of current year $700,000
Additional Paid-In Capital, end of
current year
150,000
Retained Earnings, end of current
year
350,000
Sales Revenue, current year 900,000
Net Income, current year 225,000
There was no change in contributed capital and there were no dividends declared in the
current year.
Required:
Calculate the return on equity ratio.
AICPA: BB Resource Management
AICPA: FN Measurement
Blooms: Analyze
Difficulty: 3 Hard
Learning Objective: 13-04 Calculate financial ratios to assess profitability, liquidity, and solvency.
Topic: Ratio Computations
13-80
Copyright © 2017 McGraw-Hill Education. All rights reserved. No reproduction or distribution without the prior written consent of
McGraw-Hill Education.

153. A company had 10,000 shares of common stock outstanding throughout the year. The
following information is also available:
Stockholders’ equity, end of year $4,000,000
Net income for the year 1,000,000
Market price per share, end of year $140
Required:
Calculate the Price/Earnings ratio at the end of the current year.
AICPA: BB Resource Management
AICPA: FN Measurement
Blooms: Apply
Difficulty: 2 Medium
Learning Objective: 13-04 Calculate financial ratios to assess profitability, liquidity, and solvency.
Topic: Ratio Computations
13-81
Copyright © 2017 McGraw-Hill Education. All rights reserved. No reproduction or distribution without the prior written consent of
McGraw-Hill Education.
13-82
Copyright © 2017 McGraw-Hill Education. All rights reserved. No reproduction or distribution without the prior written consent of
McGraw-Hill Education.
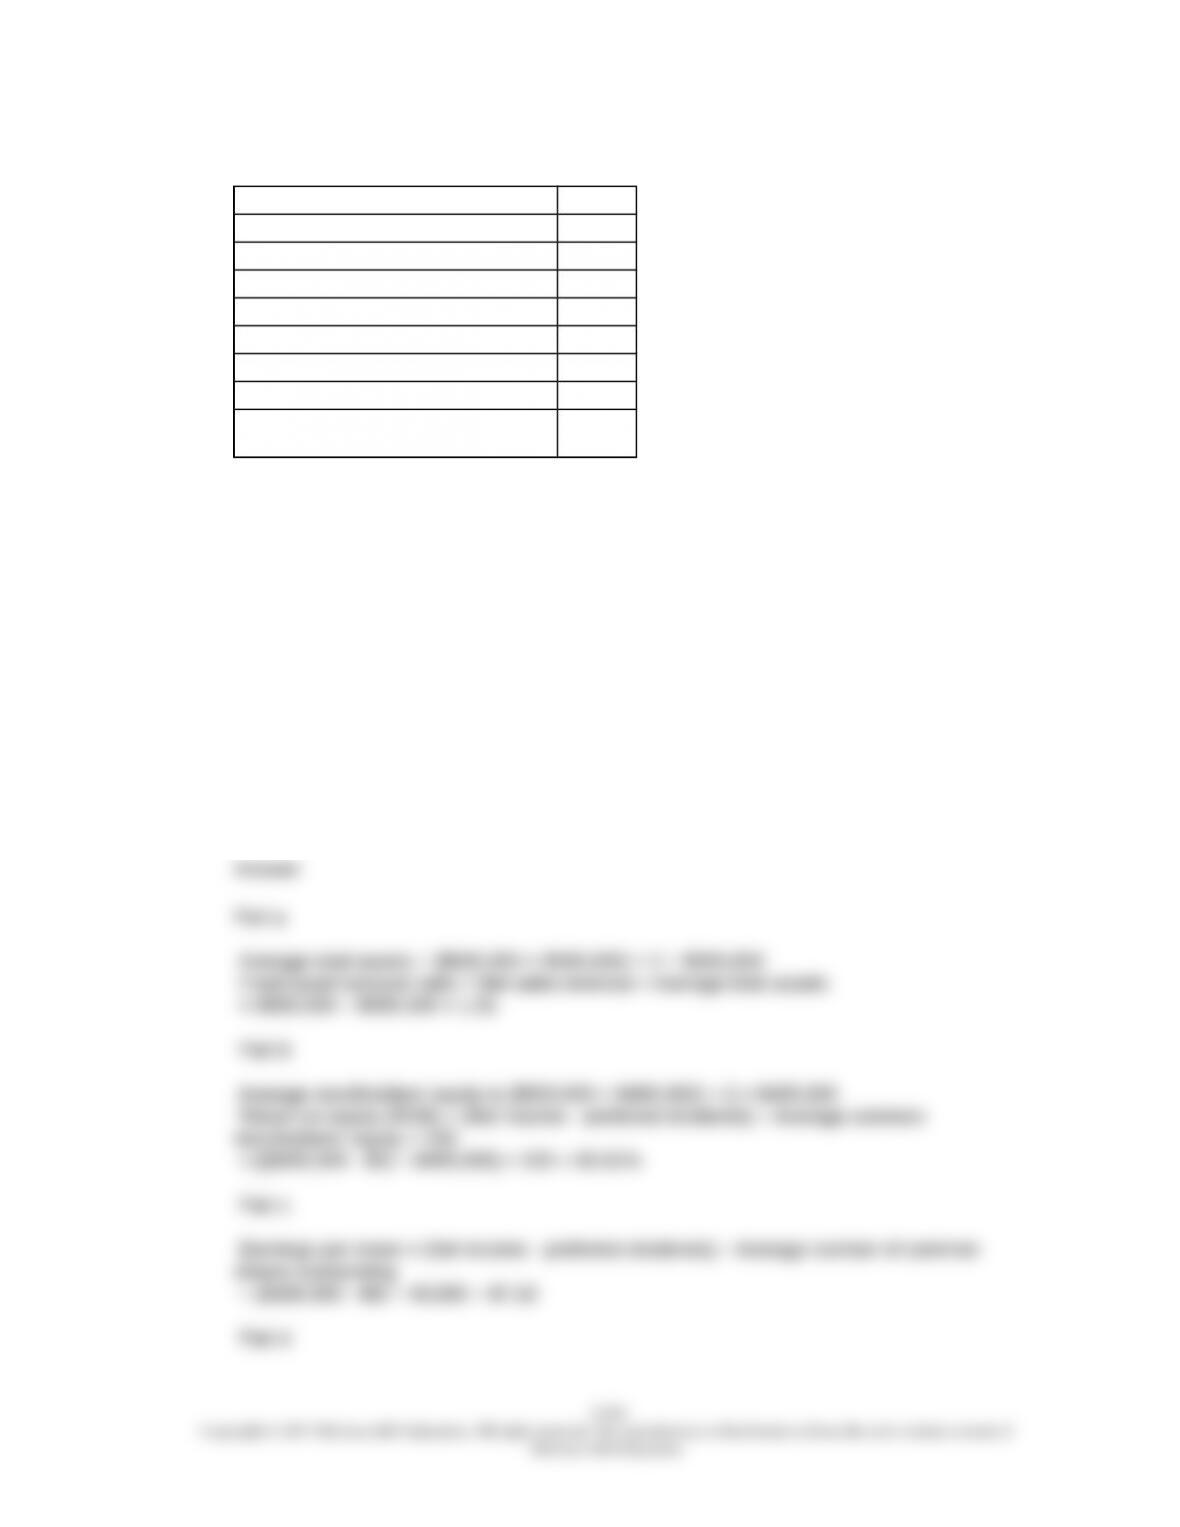
154. The following information is taken from the financial statements of B. Darin Company:
Net sales revenue $900,000
Expenses 600,000
Net income 300,000
Net cash from operations 290,000
Assets, end of current year 600,000
Liabilities, end of current year 100,000
Stockholders’ equity, end of current year 500,000
Assets, end of previous year 590,000
Stockholders’ equity, end of previous
year 490,000
Expenses include interest of $10,000 and income tax of $90,000. There was an average of
40,000 shares of common stock outstanding during the year and the market price of the stock
is $15 per share at the end of the year. There was no preferred stock outstanding during the
year.
Required:
Calculate the following ratios for the current year:
Part a. Fixed asset turnover
Part b. Return on equity (ROE)
Part c. Earnings per share (EPS)
Part d. Times interest earned
Part e. Price/Earnings ratio
Part f. Debt-to-assets ratio
Part g. Net profit margin
AICPA: BB Resource Management
AICPA: FN Measurement
Blooms: Apply
Difficulty: 2 Medium
Learning Objective: 13-04 Calculate financial ratios to assess profitability, liquidity, and solvency.
Topic: Ratio Computations
13-84
Copyright © 2017 McGraw-Hill Education. All rights reserved. No reproduction or distribution without the prior written consent of
McGraw-Hill Education.
13-85
Copyright © 2017 McGraw-Hill Education. All rights reserved. No reproduction or distribution without the prior written consent of
McGraw-Hill Education.

155. Mercedes, Co. has the following quarterly financial information.
4th
Quarter
3rd
Quarter
2nd
Quarter
1st
Quarter
Sales
Revenue
$901,80
0
$911,30
0
$909,60
0
$917,40
0
Cost of
Goods
Sold
304,500 317,100 316,700 321,900
Operating
Expenses 247,700 259,100 257,300 261,400
Interest
Expense 3,600 3,600 3,600 3,500
Income Tax
Expense 84,300 87,200 87,200 89,700
Average
Number of
Common
Shares
Outstandin
g
793,030 788,064 789,670 803,000
Stock price
when Q4
EPS
released
$24.00
Required:
Part a. Calculate the gross profit percentage for each quarter.
Part b. Calculate the net profit margin for each quarter.
Part c. Calculate the EPS for each quarter.
Part d. Calculate the Price/Earnings ratio at the end of the year.
Part e. Evaluate the company’s profitability.
Round all ratios to two decimal places.
66.23% 65.20% 65.18% 64.91%
Part b
Net profit margin = (Net income ÷ Revenues) × 100
4th Quarter 3rd Quarter 2nd Quarter 1st Quarter
29.02% 26.81% 26.91% 26.26%
Part c
13-86
Copyright © 2017 McGraw-Hill Education. All rights reserved. No reproduction or distribution without the prior written consent of
McGraw-Hill Education.
Earnings per share = (Net income – preferred dividends) ÷ Average number of common
shares outstanding
4th Quarter 3rd Quarter 2nd Quarter 1st Quarter
$0.33 $0.31 $0.31 $0.30
Part d
Price/Earnings ratio = Stock price ÷ EPS (for the last four quarters)
= $24.00 ÷ ($0.33 + $0.31 + $0.31 + $0.30) = 19.2
Part e
Mercedes Co.’s profitability improved slowly and steadily over the four quarters, as evidenced
by small incremental increases in its gross and net profit margins. Gross profit increased as
cost of goods sold declined in most quarters, especially in Quarter 4. Since interest expense
was constant and operating expenses decreased over the four quarters, net profit margin and
earnings per share increased. With a Price/Earnings ratio of 19.2, it appears that investors are
optimistic about the company’s future.
AACSB: Analytical Thinking
AACSB: Communication
AICPA: BB Critical Thinking
AICPA: FN Measurement
AICPA: FN Risk Analysis
Blooms: Analyze
Blooms: Apply
Difficulty: 2 Medium
Learning Objective: 13-04 Calculate financial ratios to assess profitability, liquidity, and solvency.
Learning Objective: 13-05 Interpret the results of financial analyses.
Topic: Interpreting Ratio Analyses
Topic: Ratio Computations
13-87
Copyright © 2017 McGraw-Hill Education. All rights reserved. No reproduction or distribution without the prior written consent of
McGraw-Hill Education.
13-88
Copyright © 2017 McGraw-Hill Education. All rights reserved. No reproduction or distribution without the prior written consent of
McGraw-Hill Education.
156. The financial information below presents selected information from the financial statements of
Pelican Company. Sales revenue during the current year was $13,700,300 and cost of goods
sold was $8,905,195. All of Pelican’s sales are made on account and are due within 30 days.
Prior Year Current
Year
Cash and cash
equivalents $552,330 $599,780
Accounts receivable 4,550,000 3,800,000
Inventory 920,360 1,223,440
Total current assets 8,700,030 8,480,100
Total assets 11,100,020 10,980,000
Total current liabilities 7,200,300 7,476,000
Total liabilities 8,449,900 8,240,700
Required:
Part a. Current ratios as of the end of the current and prior year.
Part b. Calculate the receivables turnover ratio for the current year.
Part c. Calculate the days to collect for the current year.
Part d. Calculate the inventory turnover ratio for the current year.
Part d. Calculate the days to sell for the current year.
Part e. Evaluate the company’s liquidity position at the end of the current year. Cite any
additional information not given in the problem that would be helpful in evaluating the
company’s liquidity.
Round all ratios to two decimal places.
AACSB: Communication
AICPA: BB Critical Thinking
AICPA: FN Risk Analysis
Blooms: Analyze
Blooms: Apply
Difficulty: 2 Medium
Learning Objective: 13-04 Calculate financial ratios to assess profitability, liquidity, and solvency.
Learning Objective: 13-05 Interpret the results of financial analyses.
Topic: Interpreting Ratio Analyses
Topic: Ratio Computations
13-90
Copyright © 2017 McGraw-Hill Education. All rights reserved. No reproduction or distribution without the prior written consent of
McGraw-Hill Education.
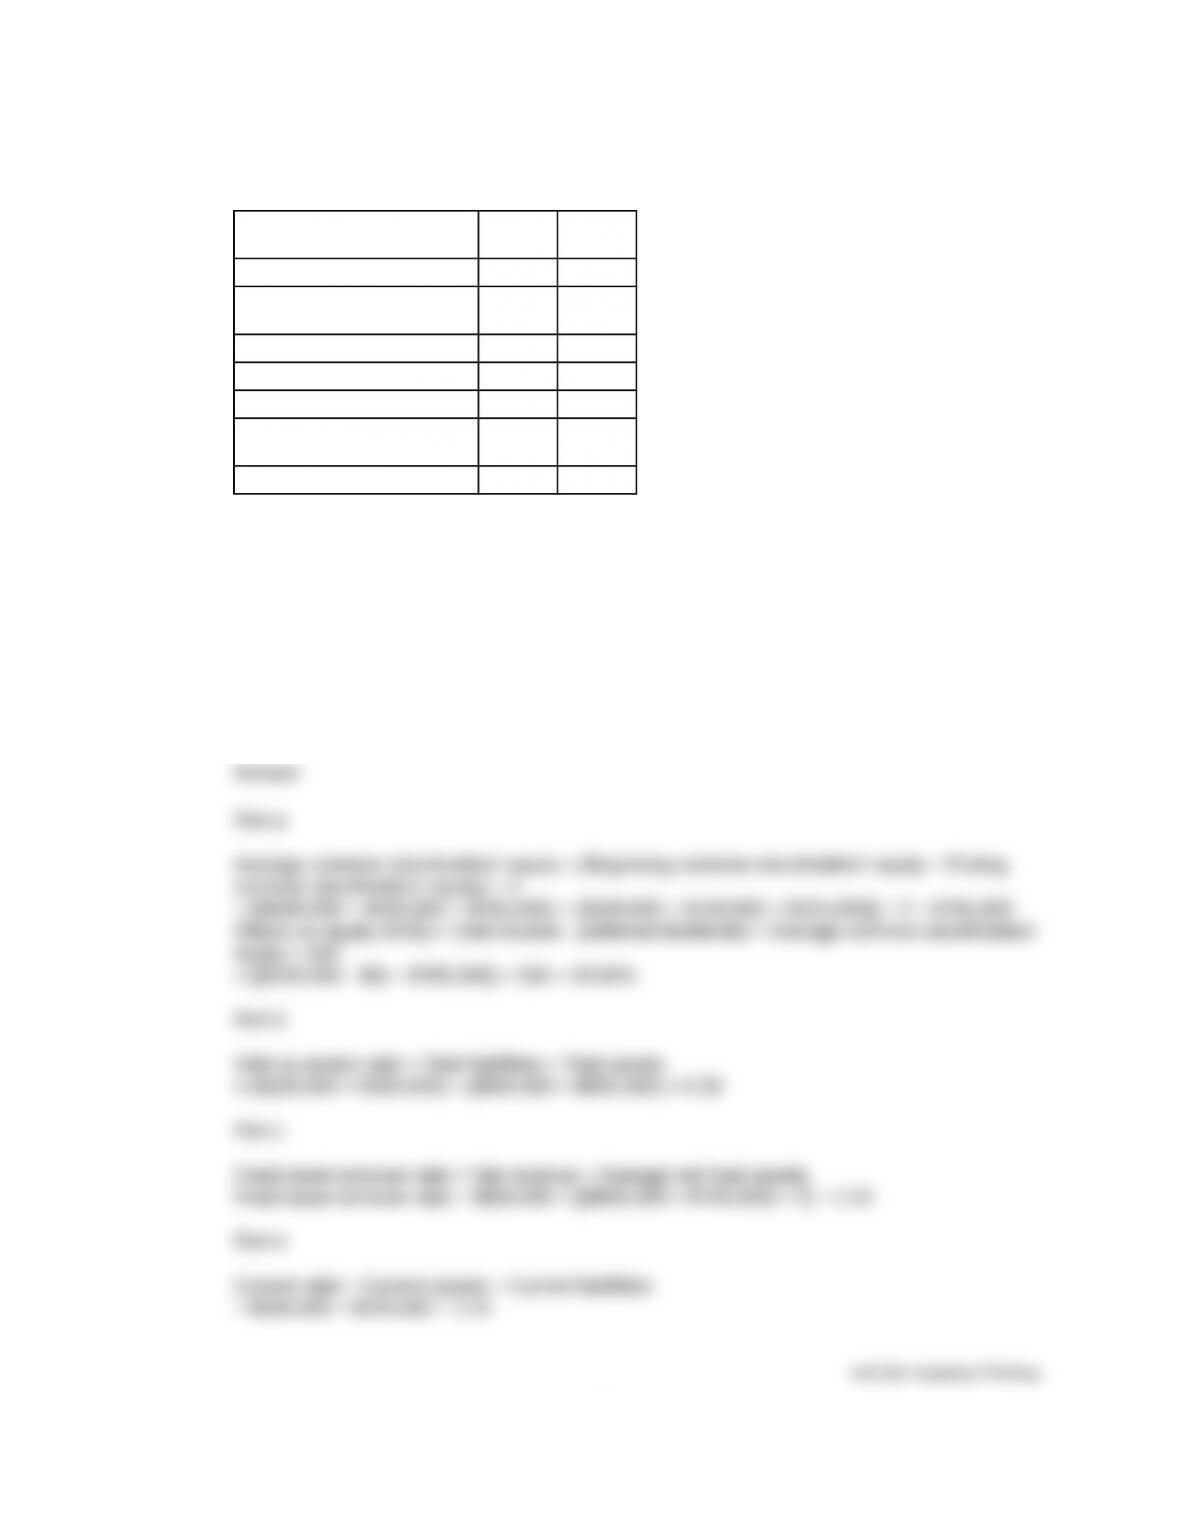
157. Carson Inc. reported net sales revenue of $850,000 and paid no dividends during the current
year. The following information is also available at the end of the current and prior years:
Current
Year
Prior
Year
Total Current Assets $500,000 $450,000
Property, Plant, and
Equipment, Net 850,000 700,000
Total Current Liabilities 225,000 195,000
Total Long-Term Liabilities 300,000 250,000
Common Stock, $5 Par 500,000 500,000
Paid-In Capital in Excess of
Par 100,000 100,000
Retained Earnings 225,000 105,000
There was no preferred stock outstanding during the current year.
Required:
Part a. Calculate the return on equity for the current year.
Part b. Calculate the debt-to-assets ratio for the current year.
Part c. Calculate the fixed asset turnover ratio for the current year.
Part d. Calculate the current ratio for the current year.
Round all ratios to two decimal points.
13-91
Copyright © 2017 McGraw-Hill Education. All rights reserved. No reproduction or distribution without the prior written consent of
McGraw-Hill Education.

AICPA: BB Resource Management
AICPA: FN Measurement
Blooms: Apply
Difficulty: 2 Medium
Learning Objective: 13-04 Calculate financial ratios to assess profitability, liquidity, and solvency.
Topic: Ratio Computations
158. The following information is available for a company for the current year:
Net Sales Revenue $345,000
Cost of Goods Sold 205,000
Average Accounts Receivable 32,500
Average Inventory 9,450
Average Net Fixed Assets 81,250
Average Total Assets 130,000
Required:
Part a. Calculate the receivables turnover ratio for the current year.
Part b. Calculate the days to collect for the current year.
Part c. Calculate the inventory turnover ratio for the current year.
Part d. Calculate the days to sell for the current year.
Round all ratios to two decimal points.
AICPA: BB Resource Management
AICPA: FN Measurement
Blooms: Apply
Difficulty: 2 Medium
Learning Objective: 13-04 Calculate financial ratios to assess profitability, liquidity, and solvency.
Topic: Ratio Computations
13-92
Copyright © 2017 McGraw-Hill Education. All rights reserved. No reproduction or distribution without the prior written consent of
McGraw-Hill Education.
13-93
Copyright © 2017 McGraw-Hill Education. All rights reserved. No reproduction or distribution without the prior written consent of
McGraw-Hill Education.
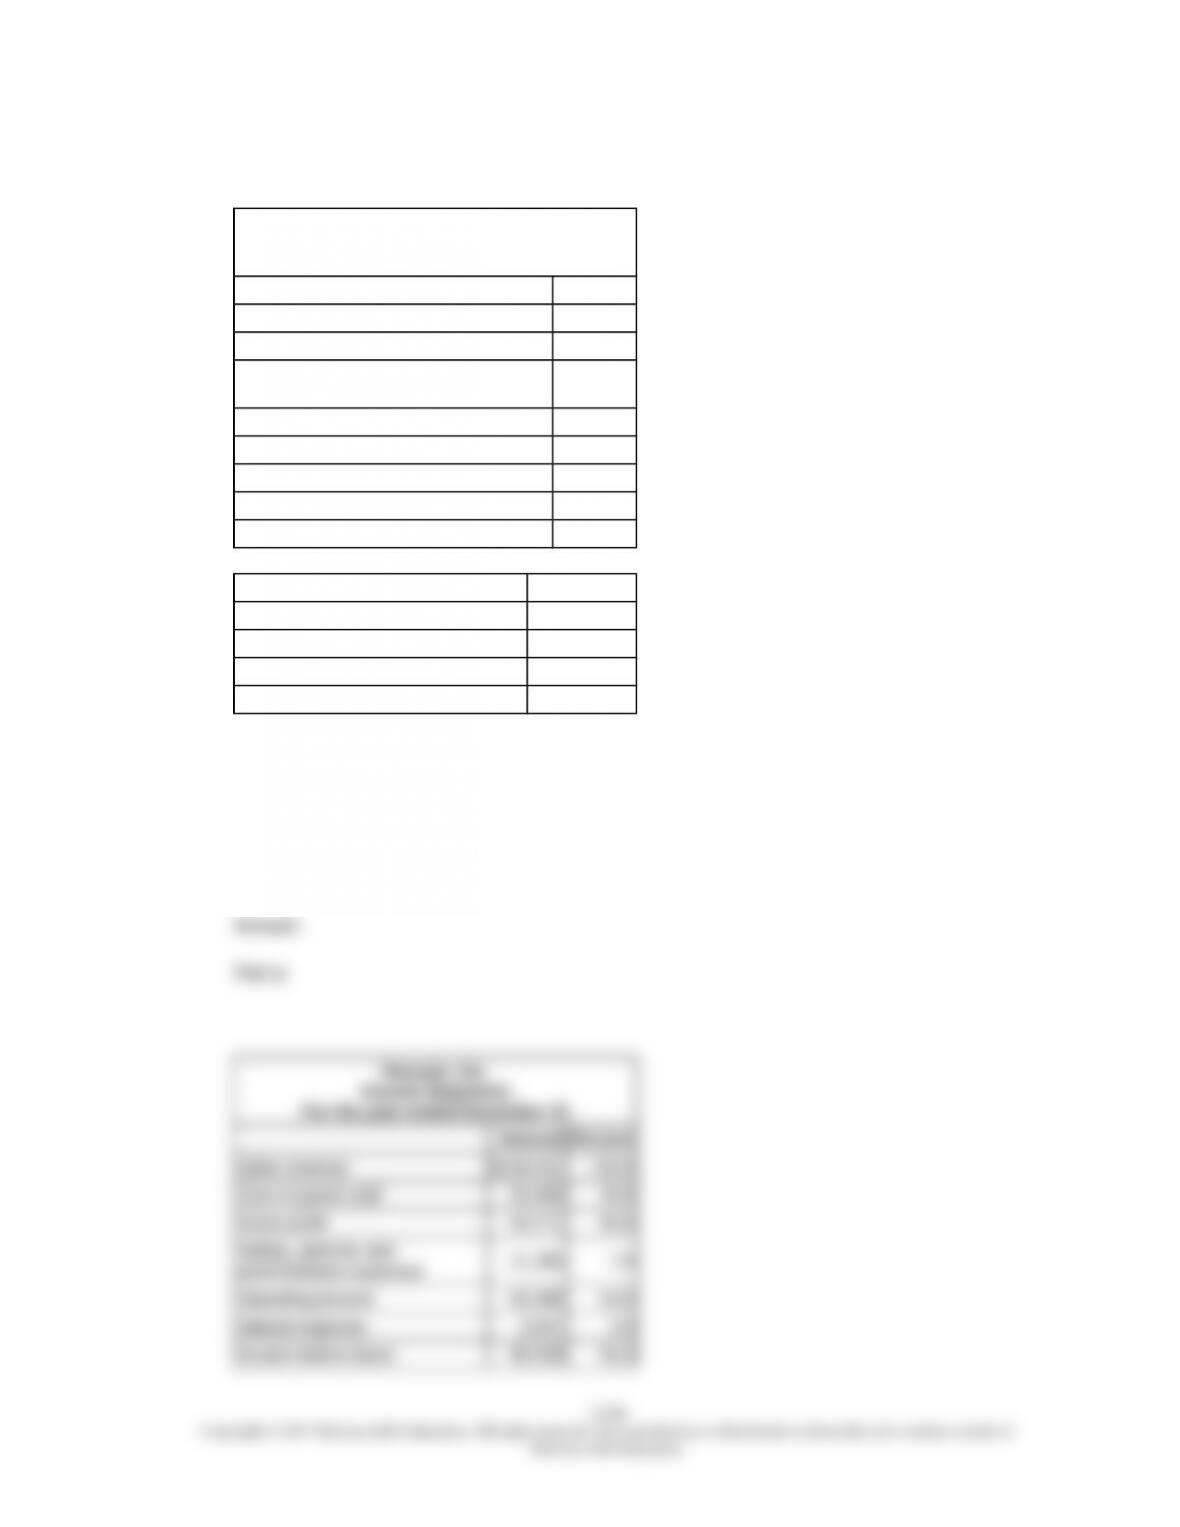
159. Husain, Inc.’s income statement and other financial information for the current year is
presented below.
Hussain, Inc.
Income Statement
For the year ended December 31
Sales revenue $159,131
Cost of goods sold 64,360
Gross profit 94,771
Selling, general, and administrative
expenses 11,385
Operating income 83,386
Interest expense 2,847
Income before taxes 80,539
Income tax expense 3,414
Net income $77,125
Balance sheet information:
Current assets $250,000
Noncurrent assets 500,000
Current liabilities 50,000
Long-term debt 100,000
Required:
Part a. Perform vertical analysis of the income statement. (Round to the nearest whole
percentage.)
Part b. Calculate the debt-to-assets ratio. (Round to two decimal places.)
Part c. Calculate the times interest earned ratio. (Round to two decimal places.)
Part d. Evaluate the company’s solvency.
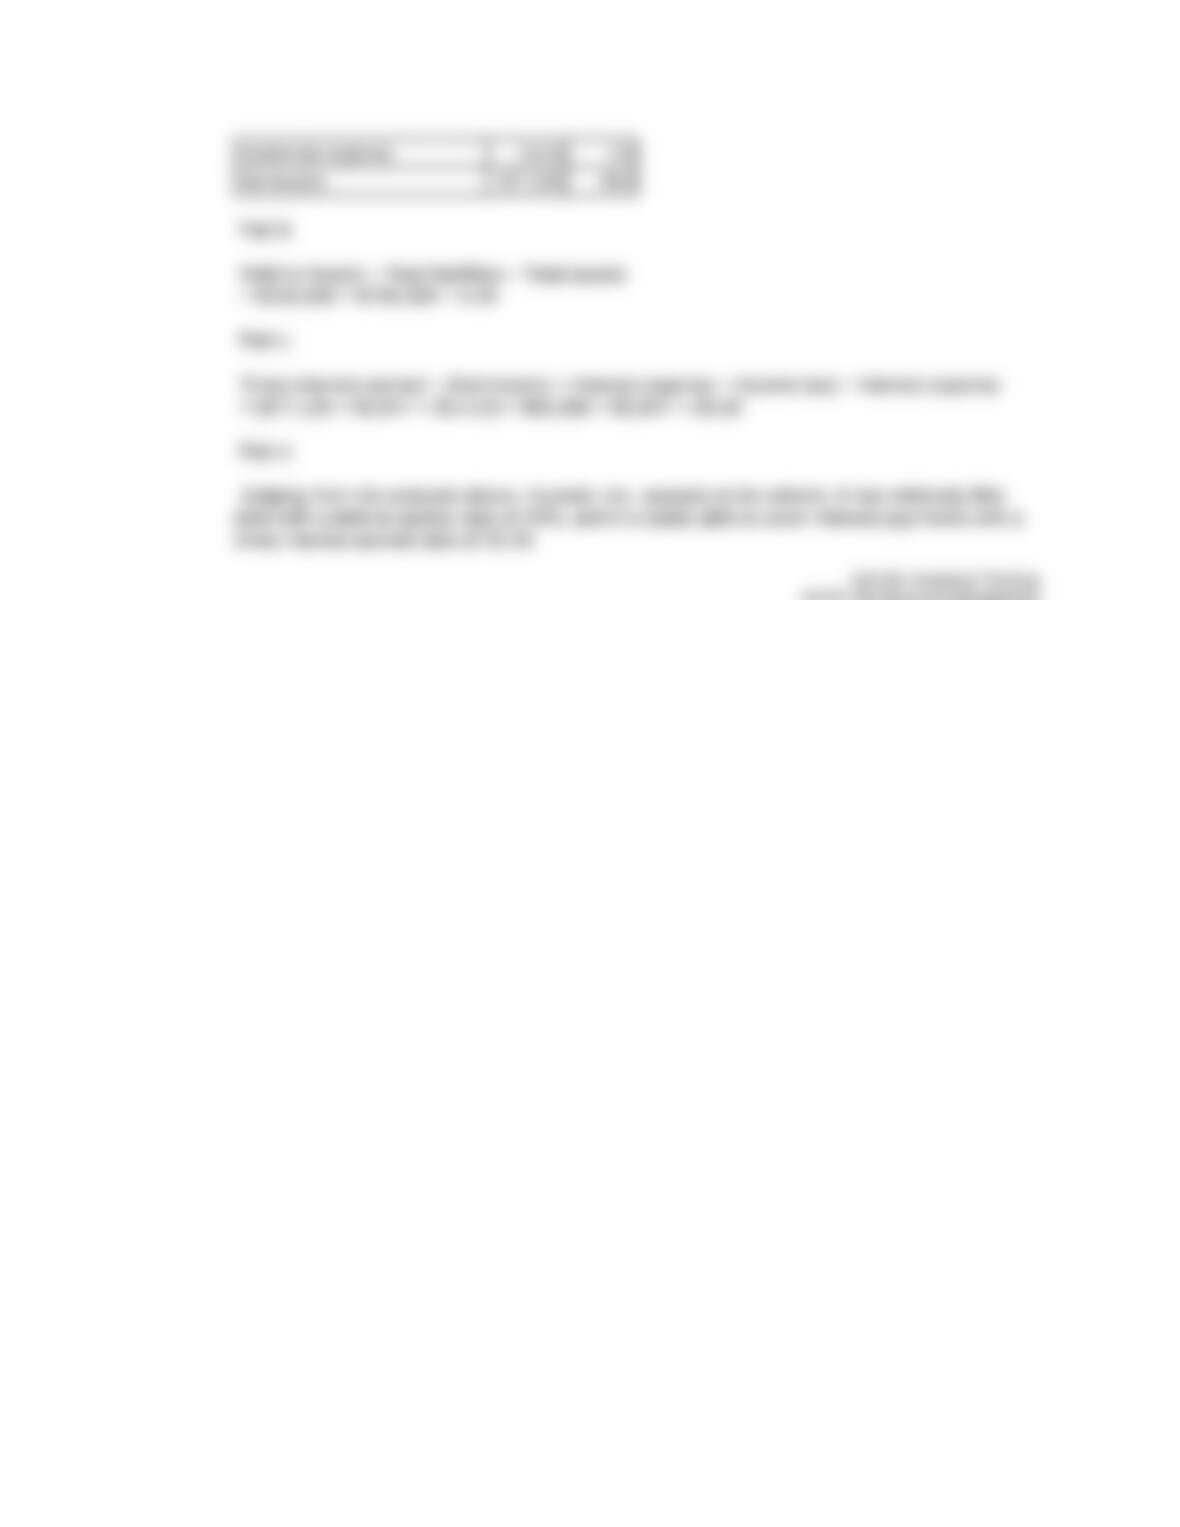
AICPA: BB Resource Management
AICPA: FN Measurement
Blooms: Apply
Difficulty: 2 Medium
Learning Objective: 13-04 Calculate financial ratios to assess profitability, liquidity, and solvency.
Topic: Ratio Computations
13-95
Copyright © 2017 McGraw-Hill Education. All rights reserved. No reproduction or distribution without the prior written consent of
McGraw-Hill Education.
13-96
Copyright © 2017 McGraw-Hill Education. All rights reserved. No reproduction or distribution without the prior written consent of
McGraw-Hill Education.

160. For each of the accounting treatments below, indicate whether it is followed in GAAP, or IFRS,
or both, by placing an “X” in the appropriate column(s).
Accounting Treatment GAAP IFRS
1. Record the purchase of assets at
cost.
2. Report assets at current value on
the balance sheet.
3. May use FIFO for inventory
costing.
4. May use LIFO for inventory
costing.
5. Contingent liabilities are accrued
under specified circumstances.
6. Some preferred stock is classified
as a liability.
7. Common stock is classified as
stockholders’ equity.
8.
Current assets precede
noncurrent assets on the balance
sheet.
9. Equity precedes liabilities on the
balance sheet.
10.
Dividends and interest received
may be classified as either
operating or investing activities.
11.
May use either the direct method
or the indirect method to prepare
the statement of cash flows.
12.
Different parts of a piece of
equipment may be depreciated
over different periods of time
(e.g., for a roller coaster, the
engine may be depreciated over 5
years, the seats, over 7 years,
and the track over 10 years).
1. Record the purchase of assets at
cost. X X
2. Report assets at current value on
the balance sheet. X
3. May use FIFO for inventory
costing. X X
4. May use LIFO for inventory
costing. X
5. Contingent liabilities are accrued
under specified circumstances. X X
13-97
Copyright © 2017 McGraw-Hill Education. All rights reserved. No reproduction or distribution without the prior written consent of
McGraw-Hill Education.

6. Some preferred stock is classified
as a liability. X
7. Common stock is classified as
stockholders’ equity. X X
8.
Current assets precede
noncurrent assets on the balance
sheet.
X
9. Equity precedes liabilities on the
balance sheet. X
10.
Dividends and interest received
may be classified as either
operating or investing activities.
X
11.
May use either the direct method
or the indirect method to prepare
the statement of cash flows.
X X
12.
Different parts of a piece of
equipment may be depreciated
over different periods of time
(e.g., for a roller coaster, the
engine may be depreciated over 5
years, the seats, over 7 years,
and the track over 10 years).
X
AACSB: Diversity
AICPA: BB Global
AICPA: FN Measurement
Blooms: Remember
Difficulty: 3 Hard
Learning Objective: 13-S2
Topic: Reviewing and Contrasting IFRS and GAAP
13-98
Copyright © 2017 McGraw-Hill Education. All rights reserved. No reproduction or distribution without the prior written consent of
McGraw-Hill Education.

161. Choose the appropriate letter to match the term and the definition. Not all definitions will be
used.
Term
_____ Full Disclosure Principle
_____ Ratio Analysis
_____ Liquidity
_____ Going-Concern Assumption
_____ Profitability
_____ Solvency
_____ Trend Analysis
_____ Vertical Analysis
Definition
A) The ability of a company to meet its short-run financial obligations.
B) A type of analysis that focuses on relationships within a single financial statement.
C) Also known as time-series analysis.
D) The standard that companies should present all relevant information needed to interpret a
company’s financial position and performance.
E) The standard that expenses should be recognized when incurred.
F) A measure of current earnings performance.
G) A result from comparing a company’s results to other companies in the industry.
H) A measure of long-run survivability.
I) The standard that revenue should be recorded when earned, provided payment is
reasonably expected.
J) Measures that relate financial variables reported in one or more of the financial statements
from the same year.
K) The characteristic that financial information needs to be valuable to decision makers.
L) The standard that takes for granted a company’s near term financial survival.
AICPA: BB Critical Thinking
AICPA: FN Measurement
Blooms: Understand
Difficulty: 2 Medium
Learning Objective: 13-01 Describe the purposes and uses of horizontal, vertical, and ratio analyses.
Learning Objective: 13-02 Use horizontal (trend) analyses to recognize financial changes that unfold over time.
Learning Objective: 13-03 Use vertical (common size) analyses to understand important relationships within financial
statements.
Learning Objective: 13-04 Calculate financial ratios to assess profitability, liquidity, and solvency.
Learning Objective: 13-06 Describe how analyses depend on key accounting decisions and concepts.
Topic: Horizontal (Trend) Computations
Topic: Horizontal, Vertical, and Ratio Analysis
Topic: Ratio Computations
Topic: Underlying Accounting Decisions and Concepts
Topic: Vertical (Common Size) Computations
13-99
Copyright © 2017 McGraw-Hill Education. All rights reserved. No reproduction or distribution without the prior written consent of
McGraw-Hill Education.

162. Choose the appropriate letter to match the term and the definition. Not all definitions will be
used.
Term
_____ Time-Series Analysis
_____ Common-Size Financial Statements
_____ Management Discussion and Analysis
_____ Price/Earnings Ratio
_____ Earnings Per Share
_____ Comprehensive Income
_____ Discontinued Operations
_____ Net Income
Definition
A) The practice of reporting accounting data in the national monetary unit.
B) A nonrecurring item associated with abandoning or selling an operation.
C) The earnings of a company after taxes.
D) An increase in an asset or a decrease in a liability that results from peripheral activities.
E) After-tax earnings adjusted for gains and losses that may disappear before they are
realized.
F) A section of the annual report that can be used in interpreting the results of financial
statement analysis.
G) The ratio calculated by dividing the net income by the number of common shares
outstanding.
H) The ratio calculated by dividing the price of a share of stock by the earnings per share.
I) Also known as ratio analysis.
J) A nonrecurring item on the income statement that reflects gains and losses associated with
extraordinary events.
K) Another name for a trend analysis.
L) The practice of reporting information in percentages rather than monetary amounts.
AICPA: BB Critical Thinking
AICPA: FN Measurement
Blooms: Understand
Difficulty: 2 Medium
Learning Objective: 13-02 Use horizontal (trend) analyses to recognize financial changes that unfold over time.
Learning Objective: 13-03 Use vertical (common size) analyses to understand important relationships within financial
statements.
Learning Objective: 13-04 Calculate financial ratios to assess profitability, liquidity, and solvency.
Learning Objective: 13-05 Interpret the results of financial analyses.
Topic: Horizontal (Trend) Computations
Topic: Interpreting Horizontal and Vertical Analyses
Topic: Nonrecurring and Other Special Items
Topic: Ratio Computations
Topic: Vertical (Common Size) Computations
13-100
Copyright © 2017 McGraw-Hill Education. All rights reserved. No reproduction or distribution without the prior written consent of
McGraw-Hill Education.