THE DEUTSCH-CASELLA JOINT VENTURE AND
[YELLOW TAIL]® WINES: TRADING UP OR TRADING DOWN?[1]
Armand Gilinsky, Jr. (Sonoma State University)
Raymond H. Lopez (Pace University)
America’s W. J. Deutsch & Sons (a wine importer) and Australia’s Casella (a wine
producer) operate a joint venture that has successfully launched the [Yellow
Tail]® wines. Now facing a financial crisis, top executives face a strategic decision in
terms of pricing.
We should be very proud of our portfolio of wine brands, but we admit that the [yellow tail]® story
has redefined and refocused our firm over the last decade. While the current economic environment
creates uncertainty for most businesses, we must be confident of our ability to navigate uncharted
waters and continue to compete in global markets. — Bill Deutsch
These were the words of Bill Deutsch, founder and chairman of W.J. Deutsch & Sons, a New York-based
importer, to his son, Peter. W.J. Deutsch & Sons was joint venture (JV) partner in the export and sale of
the [yellow tail]® brand of wines from the Casella family winery in New South Wales, Australia. It was
early February 2009. W.J. Deutsch & Sons’ wines were sold to trade intermediaries (wholesalers and
distributors) with marketing and promotional support and in turn, offered to retailers and consumers at
fair market prices.
Bill opened a strategy session with his management team. They met to review final 2008 revenue and
cost data and decide on a strategy for the next two years. Success of [yellow tail]® wines, thecore
brandin W.J. Deutsch & Sons’ portfolio of brands, was expected to play a crucial role in the company’s
future, now guided by CEO Peter Deutsch, Bill’s son.
John Casella, Managing Director of Casella Wines, then joined the meeting on the speakerphone from
his home in Australia: “What are your feelings about going down market on price? Do you believe we
could adopt a differential pricing strategy for the white wines in our U.S. and even our Caribbean
markets, while maintaining prices on our red wines?”
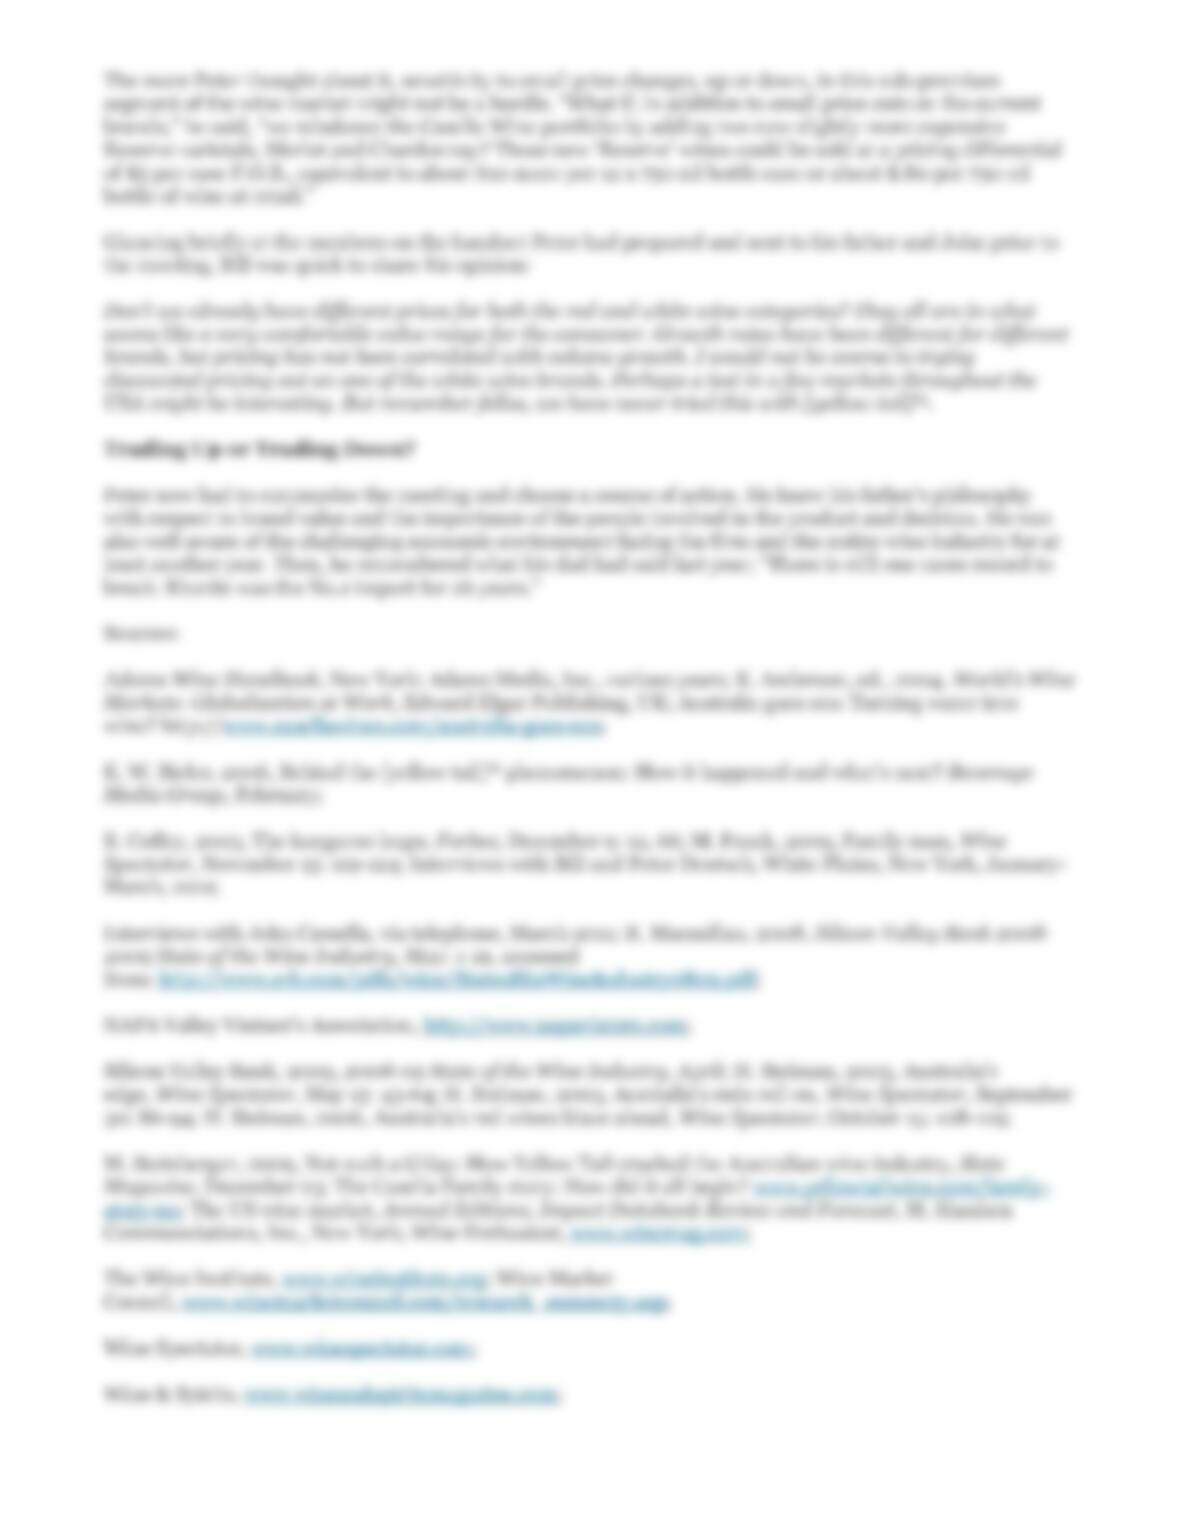
Peter Deutsch mused, “Could ‘trading down’ by customers actually benefit the firm and the brand?
Would recent promotion strategies be sufficient to maintain current [yellow tail]® sales volumes?” He
considered whether or not to leave pricing on all brands unchanged, adopt John Casella’s suggestion to
drop prices on some brands but not others, or possibly even raise prices on some or all brands despite a
turbulent economic outlook for 2009 and beyond. Then again, perhaps it was now time to consider new
brands from other producers besides the Casellas, to add more diversity to the Deutsch wine portfolio.
Peter felt that he had to be careful to decide on a course of action that would benefit all stakeholders in
the brand, not only in the short term, but also for years to come. After all, [yellow tail]® had been the
number one imported brand in the United States for only six years.
A CHANGING LANDSCAPE
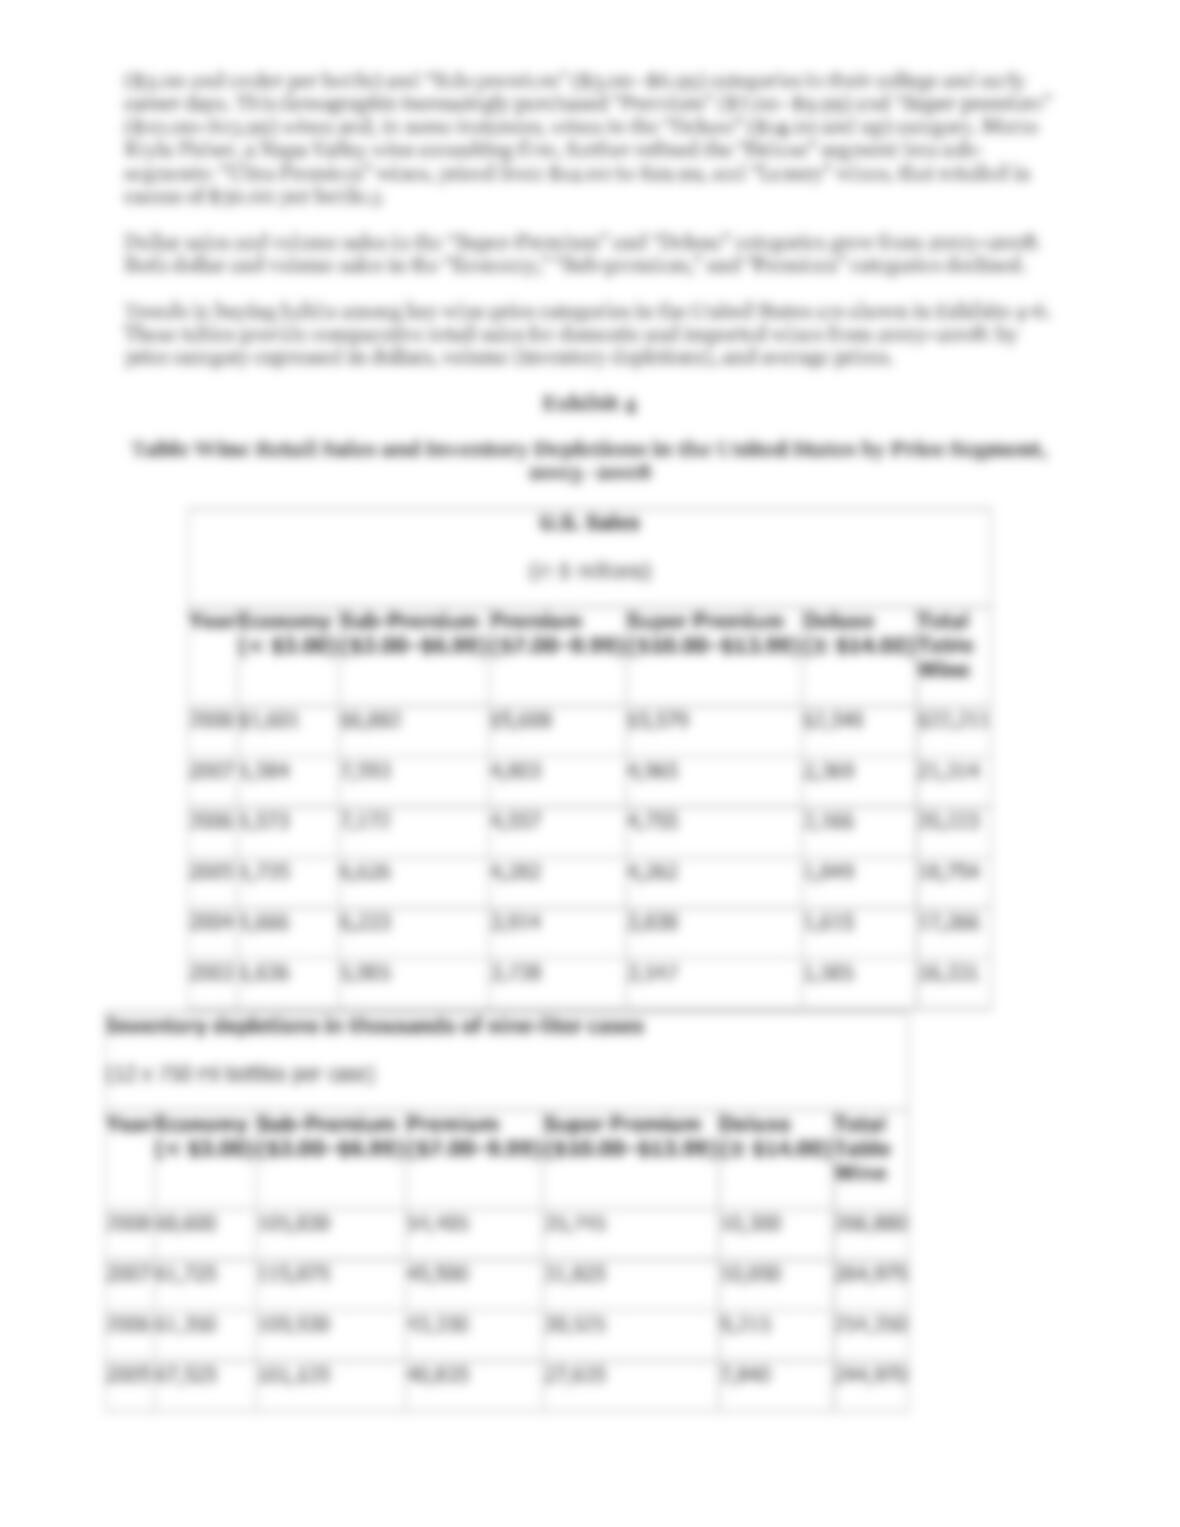
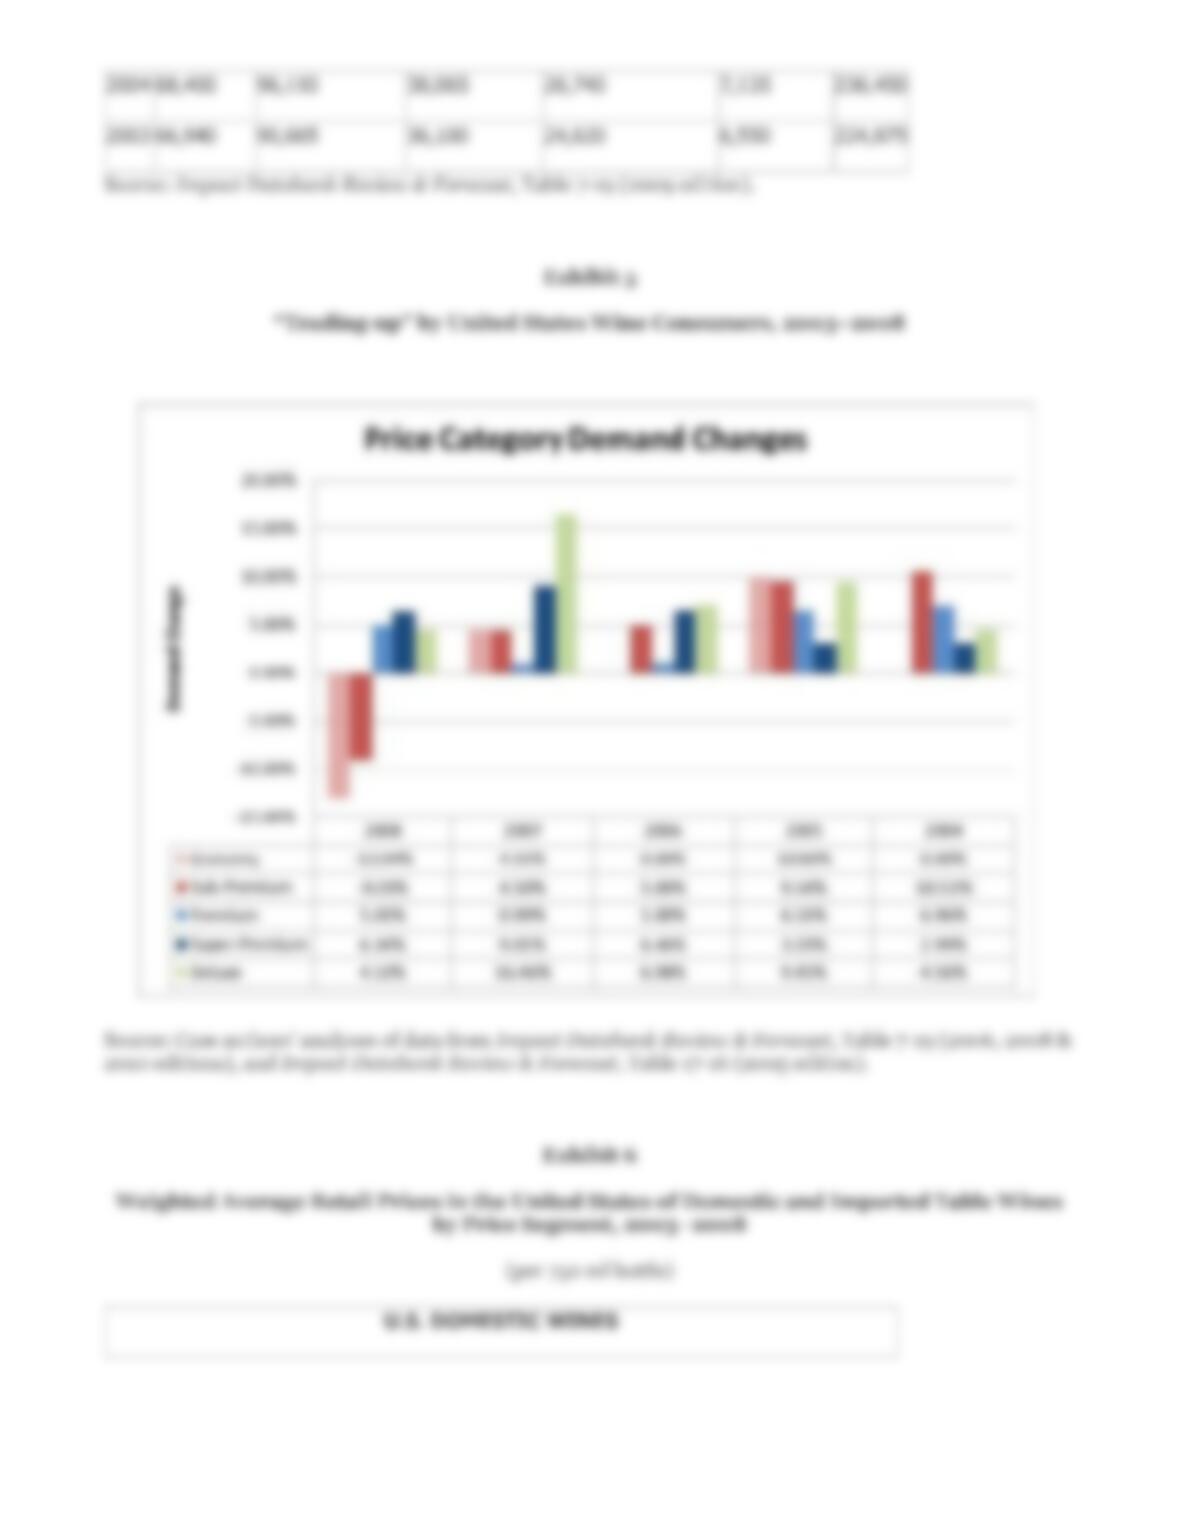
During the global recession that had begun in 2008, for many wine producers and importers, survival
was at stake. Wholesalers and distributors had become reluctant to take on any new wine inventory
until existing levels were depleted. Restaurants and hotels that sold wine “on–premises” severely
curtailed new wine purchases. To reduce existing stocks, “off–premises” retailers, such as chain
supermarkets and specialty wine shops, began using quantity discounts and special limited-time
promotions. Numerous small-to-medium-sized domestic wine producers and importers, unable to sell
through traditional wholesale channels began going into default. After more than a quarter century of
wine consumers’ continuously “trading up” to higher priced, higher quality wine brands, a “trading
down” phenomenon had now taken hold.

Consumption Patterns
The “Baby Boom” generation (born 1946-1964) represented the core market for wine in the United
States in early 2009. This demographic segment was not only aging, but also increasing in spending
power, and thus willing to spend its disposable income on wine, at least up until the global financial
crisis began in 2008.
Wine consumption in the United States increased every year from 2000–2008, according to the US
Department of Commerce and Adams Wine Handbook, the latter an industry trade publication (shown
in Exhibit 1). Domestically produced wine, predominantly from California, made some inroads into the
US market. From 2000–2008, the consumption of domestically produced table wine grew 22%, while
over the same period inroads made by wine imports led to expansion in that category approximately
74%. By comparison, however, imported table wine, which accounted for 10.3% of total US wine
consumption in 1991, accounted for 23.5% by 2008. Also, share of imports by volume, which was 14.5%
in 1991, grew to 25.6% in 2008, according to the U.S. Department of Commerce and Adams Wine
Handbook.
Exhibit 1
Domestic v. Imported Wine Consumption: % Share and Growth Rates in the United
States, by Category, 2003-2008
% share by volume (000 nine-liter cases)
Year
Table
Domestic
Other
Domestic
Total
Domestic
Table
Imported
Other
Imported
Total
Imported
Total Wine
Consumption
2008
68.11
6.13
74.24
23.50
2.60
25.76
100.00
2007
67.27
6.26
73.53
24.14
2.33
26.47
100.00
2006
67.53
6.47
74.00
23.64
2.36
26.00
100.00
2005
67.82
6.75
74.57
23.09
2.34
25.43
100.00
2004
68.32
7.10
75.42
22.27
2.32
24.58
100.00
2003
68.69
7.42
76.11
21.56
2.34
23.89
100.00
2002
69.27
8.15
77.42
20.18
2.40
22.58
100.00
2001
70.32
8.99
79.31
18.26
2.43
20.69
100.00
2000
71.23
8.97
80.20
17.19
2.61
19.80
100.00
Growth rate %ages by volume (000 nine-liter cases)
Year
Table
Domestic
Other
Domestic
Total
Domestic
Table
Imported
Other
Imported
Total
Imported
Total Wine
Consumption
2008
2.16
-1.15
1.88
-1.77
12.63
-1.80
0.91

2007
2.83
-0.19
2.56
5.38
1.87
5.06
3.21
2006
2.96
-0.87
2.62
5.85
4.29
5.71
3.40
2005
1.34
-2.87
0.95
5.88
3.19
5.63
2.10
2004
3.25
-0.68
2.86
7.22
2.98
6.81
3.81
2003
3.98
-4.60
3.08
12.02
1.96
10.95
4.86
2002
3.48
-4.76
2.55
16.09
3.70
14.63
5.05
2001
0.07
1.59
0.24
7.68
-5.47
5.94
1.37
CAGR, 2000-2008
2.50
-1.71
2.09
7.18
3.04
6.52
3.08
Note: The “Other” category includes fortified wines such as vermouth, sherry, and port.
Source: Case authors’ analysis of data from Adams Wine Handbook, 1999-
2008, www.beveragehandbooks.com.
Exhibit 2 presents an analysis of wine imports from 2003–2008 by country of origin, showing that Italy
and Australia led in total exports to the United States. Exhibit 3 shows the analysis of sales and market
shares of the 25 largest wine brands imported to the United States from the years 2005–2008.
Exhibit 2
Top Ten Wine Exporters to the United States by Country
Ranked by % Share in the U.S., 2004-2008
% share by volume of shipments
2008
2007
2006
2005
2004
Italy
29.37
30.49
30.34
30.98
31.45
Australia
24.34
25.18
29.11
30.14
30.39
France
12.24
13.78
13.90
12.09
13.10
Argentina
10.15
8.47
5.45
4.20
3.73
Chile
8.39
7.37
7.32
8.58
9.07
Spain
4.38
4.20
4.18
4.13
3.88
Germany
3.86
3.99
3.86
3.69
3.20
New Zealand
2.67
2.58
2.06
2.22
1.44
South Africa
2.00
1.26
1.29
1.27
1.09
Total, Top 10 Exporting Countries
97.41
97.33
97.53
97.31
97.33
Other Exporting Countries
2.59
2.67
2.47
2.69
2.67
Total
100.00
100.00
100.00
100.00
100.00
Growth rates by volume of shipments
5Y CAGR
2008
2007
2006
2005
Italy
3.56
-5.77
8.46
6.53
9.43
Australia
0.44
-5.44
-6.61
5.03
10.18
France
3.57
-13.15
7.02
25.04
2.57
Argentina
28.27
17.26
67.67
41.11
25.18
Chile
3.38
11.43
8.67
-7.26
5.16
Spain
7.60
1.97
8.56
10.16
18.26
Germany
9.03
-5.29
11.52
13.76
28.21
New Zealand
18.73
0.88
35.47
0.93
71.08
South Africa
18.51
55.73
4.92
10.45
29.52
Total, Top 10 Exporting Countries
5.01
-2.10
7.73
8.99
11.06
Other Exporting Countries
4.40
-5.09
16.66
-0.15
12.16
Total
4.99
-2.18
7.95
8.75
11.09
Notes:
(a) Includes wine coolers and other imported wines not listed
Numbers may not add due to rounding.
ACGR=Annual compound growth rate
Source: Case authors’ analysis of data from U.S. Dept. of Commerce and Adams Wine Handbook, 2009.
Exhibit 3
Shrinking Share of Top 25 Table Wine Importers to the United States, Depletions and
Share, 2005-2008
— Thousands of 9-liter cases
—
Imported Table Wine
Share
2008
2007
2006
2005
2008
2007
2006
2005
Yellow Tail (Deutsch)
8,300
8,050
8,050
7,500
11.4
10.7
11.2
10.8
Total Top 25
35,145
37,135
36,500
34,995
48.3
49.5
50.7
50.6
Other Brands
37,625
37,905
35,445
34,155
51.7
50.5
49.3
49.4
Total Imported Table Wine
Depletions
72,770
75,040
71,945
69,150
100
100
100
100
Note: Depletions are defined as sales of wines from inventories.
Source: Case authors’ analysis of data from Impact Databank, Table 6-43 (2008 edition) and Table 6-
44 (2009 edition).
Markets and Segmentation
Table wine was considered a luxury niche product in the universe of all alcoholic beverages, ranging
from beer to distilled spirits. Table wine had 7%–14 % alcohol content by volume and was traditionally
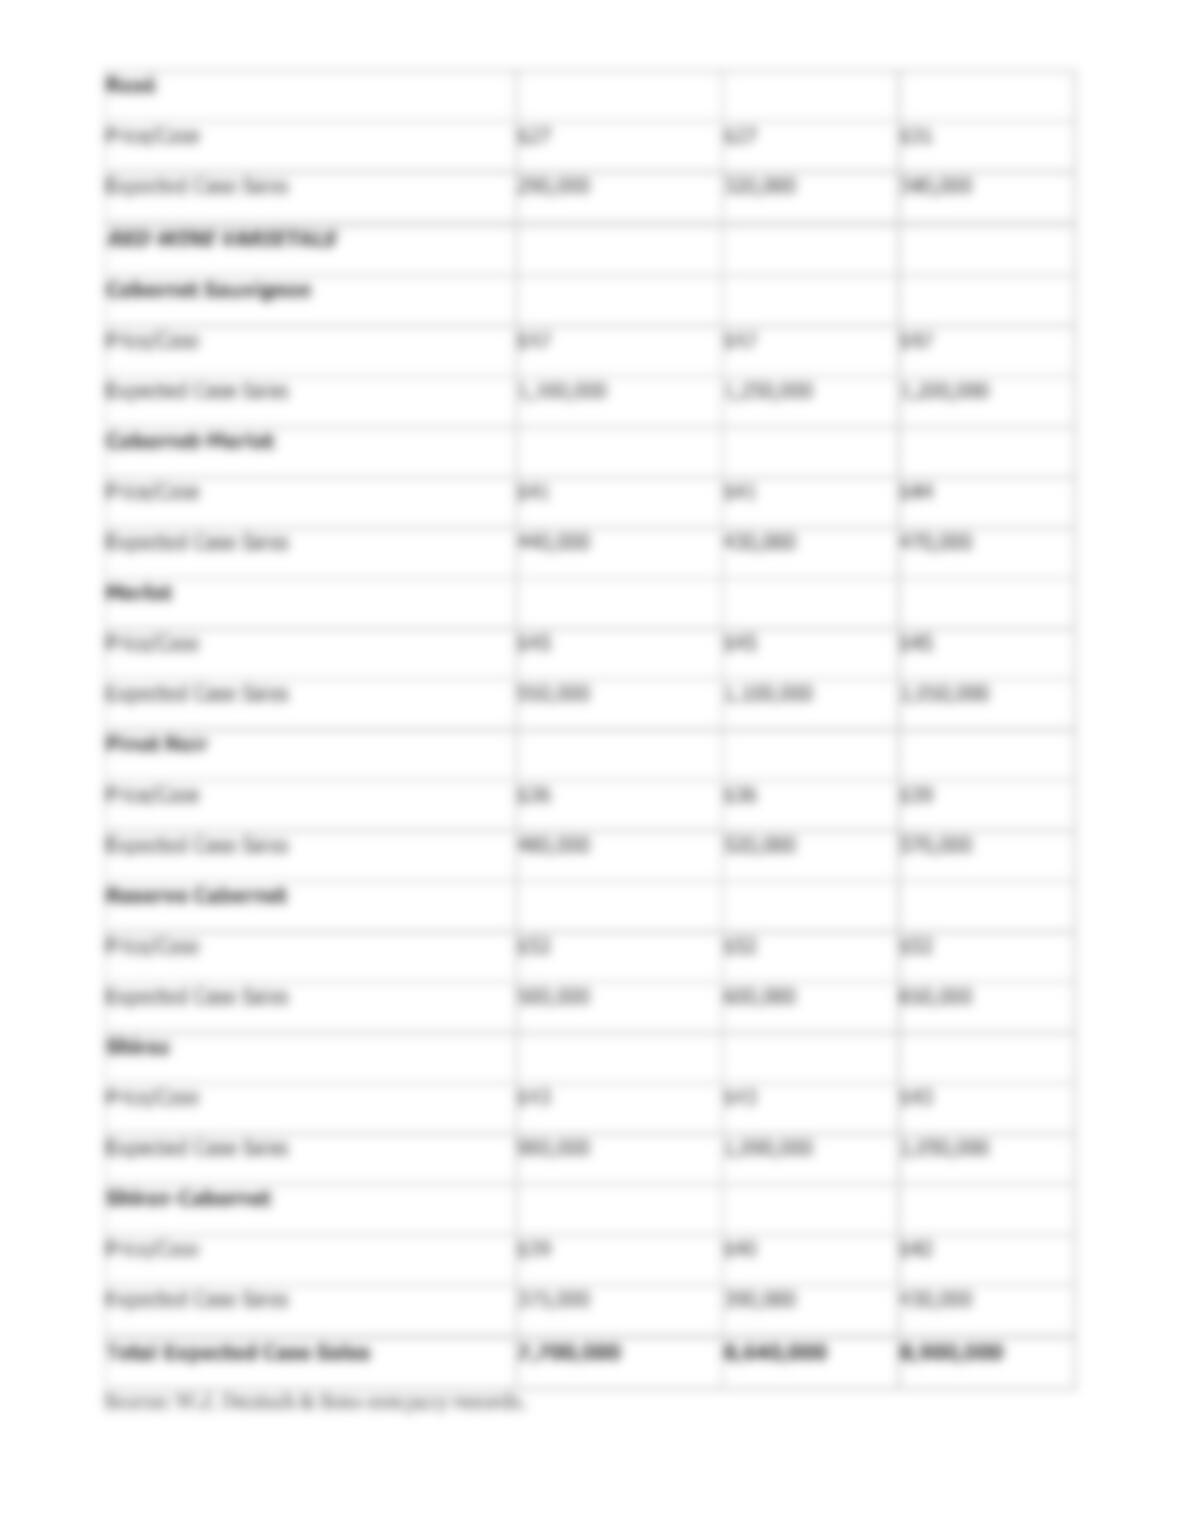
consumed at meals.2 A case of wine normally included twelve (12) 750ml bottles, or nine liters of wine.
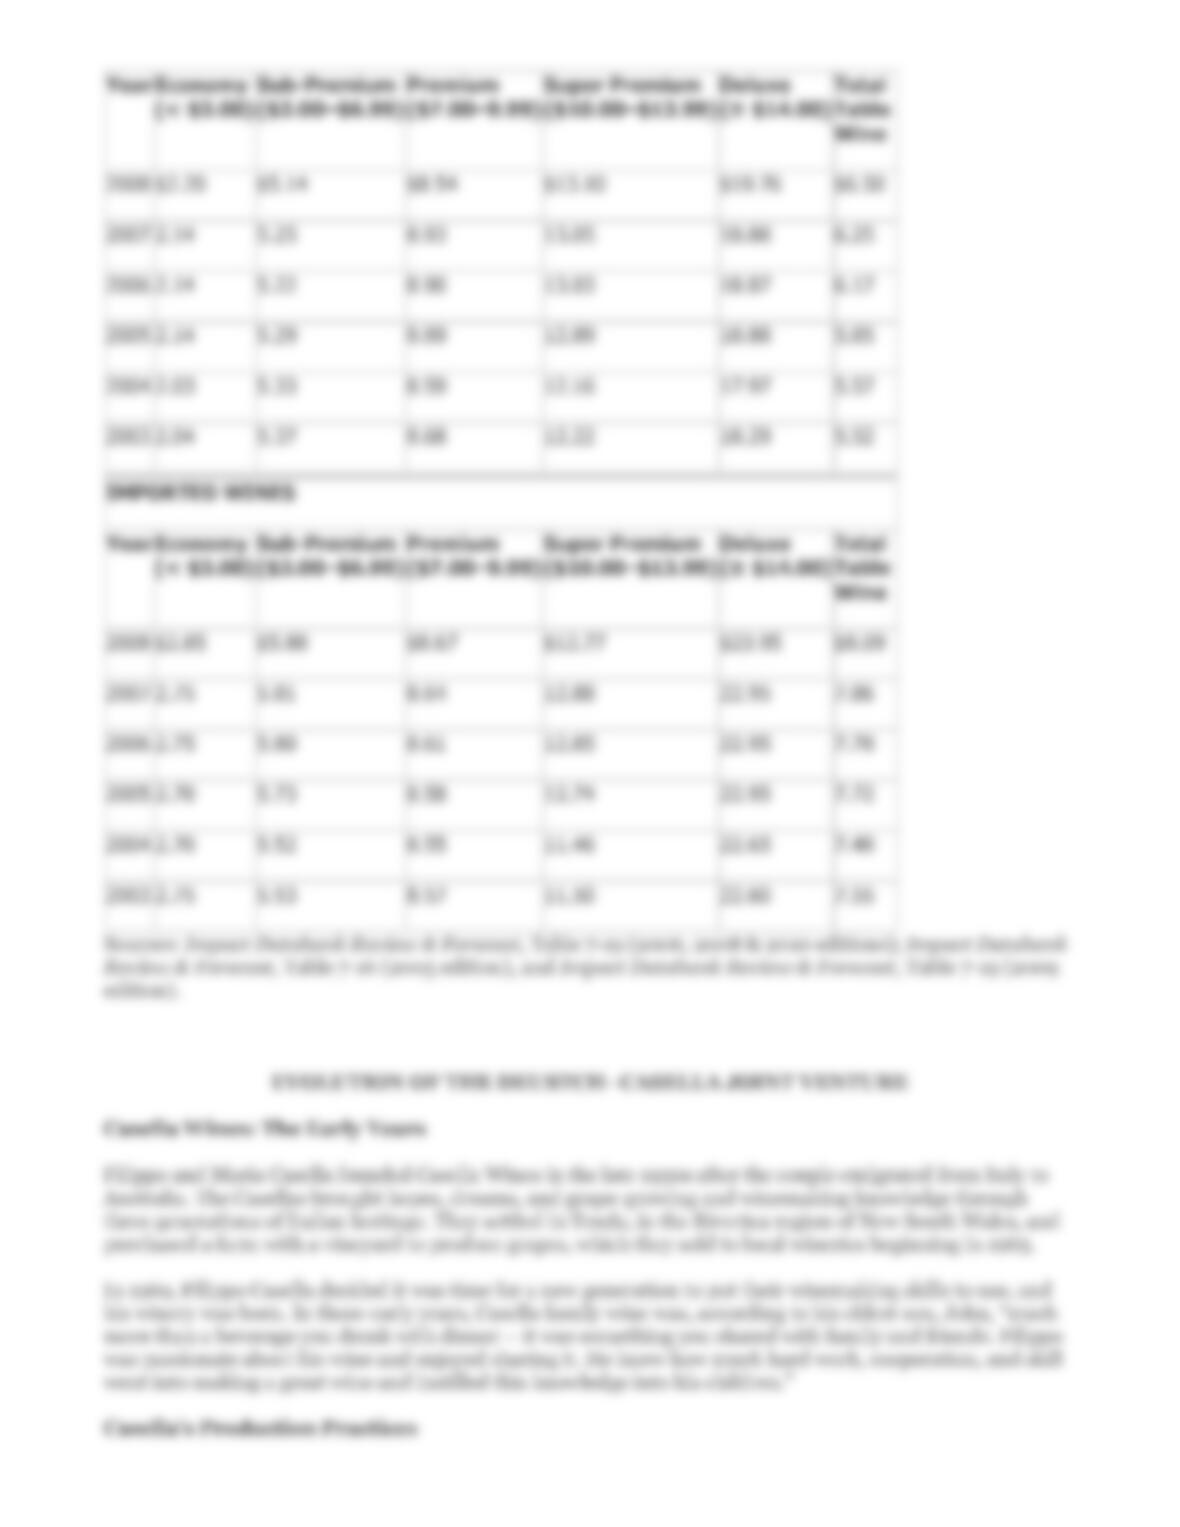
Price segments. Regardless of where they were produced, table wines that retailed for less than $3.00
per 750ml bottle were deemed to be in the generic, economy, or “jug” wine category, while those wines
selling for more than $3.00 per bottle were considered to be in the premium wine category. Most
bottled wines in the premium category showed a vintage date on their labels—the product was made
with at least 95 % of grapes harvested, crushed, and fermented in the calendar year shown on the label
and also used grapes from an appellation of origin (i.e., Napa Valley, Central Coast, Willamette Valley).
Consumer segments. In 2008, the age group comprising 25-54 year-olds constituted the largest
component of US “core” wine drinkers. In the last two decades of the previous century, the US wine
industry had almost entirely relied on the Baby-Boomer generation (in 2009 comprising a 45-63 year-
old age group) to stimulate demand growth in the short term, and began turning its attention to the