4/7/2020 Worksheet #11 (Chapter 11)
https://xlitemprod.pearsoncmg.com/api/v1/print/math 1/18
1.
2.
Student: _____________________
Date: _____________________
Instructor: Jeremy Mandelkern
Course: MyLab Statistic for Basic
Business Statistics, 14th Edition
Assignment: Worksheet #11 (Chapter
11)
Consider an experiment with groups, with values in each.eight two
a. How many degrees of freedom are there in determining the among-group variation?
b. How many degrees of freedom are there in determining the within-group variation?
c. How many degrees of freedom are there in determining the total variation?
a. There is/are degree(s) of freedom in determining the among-group variation.
(Simplify your answer.)
b. There is/are degree(s) of freedom in determining the within-group variation.
(Simplify your answer.)
c. There is/are degree(s) of freedom in determining the total variation.
(Simplify your answer.)
Consider an experiment with
groups, with values
in each. For the ANOVA
summary table shown to the
right, fill in all the missing
results.
three seven Source
Degrees of
Freedom
Sum of
Squares
Mean Square
(Variance) F
Among
groups ?c − 1 = SSA ?= MSA = 115 ?FSTAT =
Within
groups ?n − c = SSW = 414 MSW ?=
Total ?n − 1 = SST ?=
Complete the ANOVA summary table below.
Source Degrees of Freedom Sum of Squares
Mean Square
(Variance) F
Among groups c − 1 = SSA = MSA = 115 FSTAT =
Within groups n c− = SSW = 414 MSW =
Total n − 1 = SST =
(Simplify your answers.)
4/7/2020 Worksheet #11 (Chapter 11)
https://xlitemprod.pearsoncmg.com/api/v1/print/math 2/18
3.
1: Brand Valuation Results
A research assistant compared brand values for three sectors in a study of 100 global brands: the financial institution
sector, the technology sector, and the telecom sector. The research assistant findings are in the accompanying table.
Complete parts (a) through (c) below.
Click here to view the results of the study.1
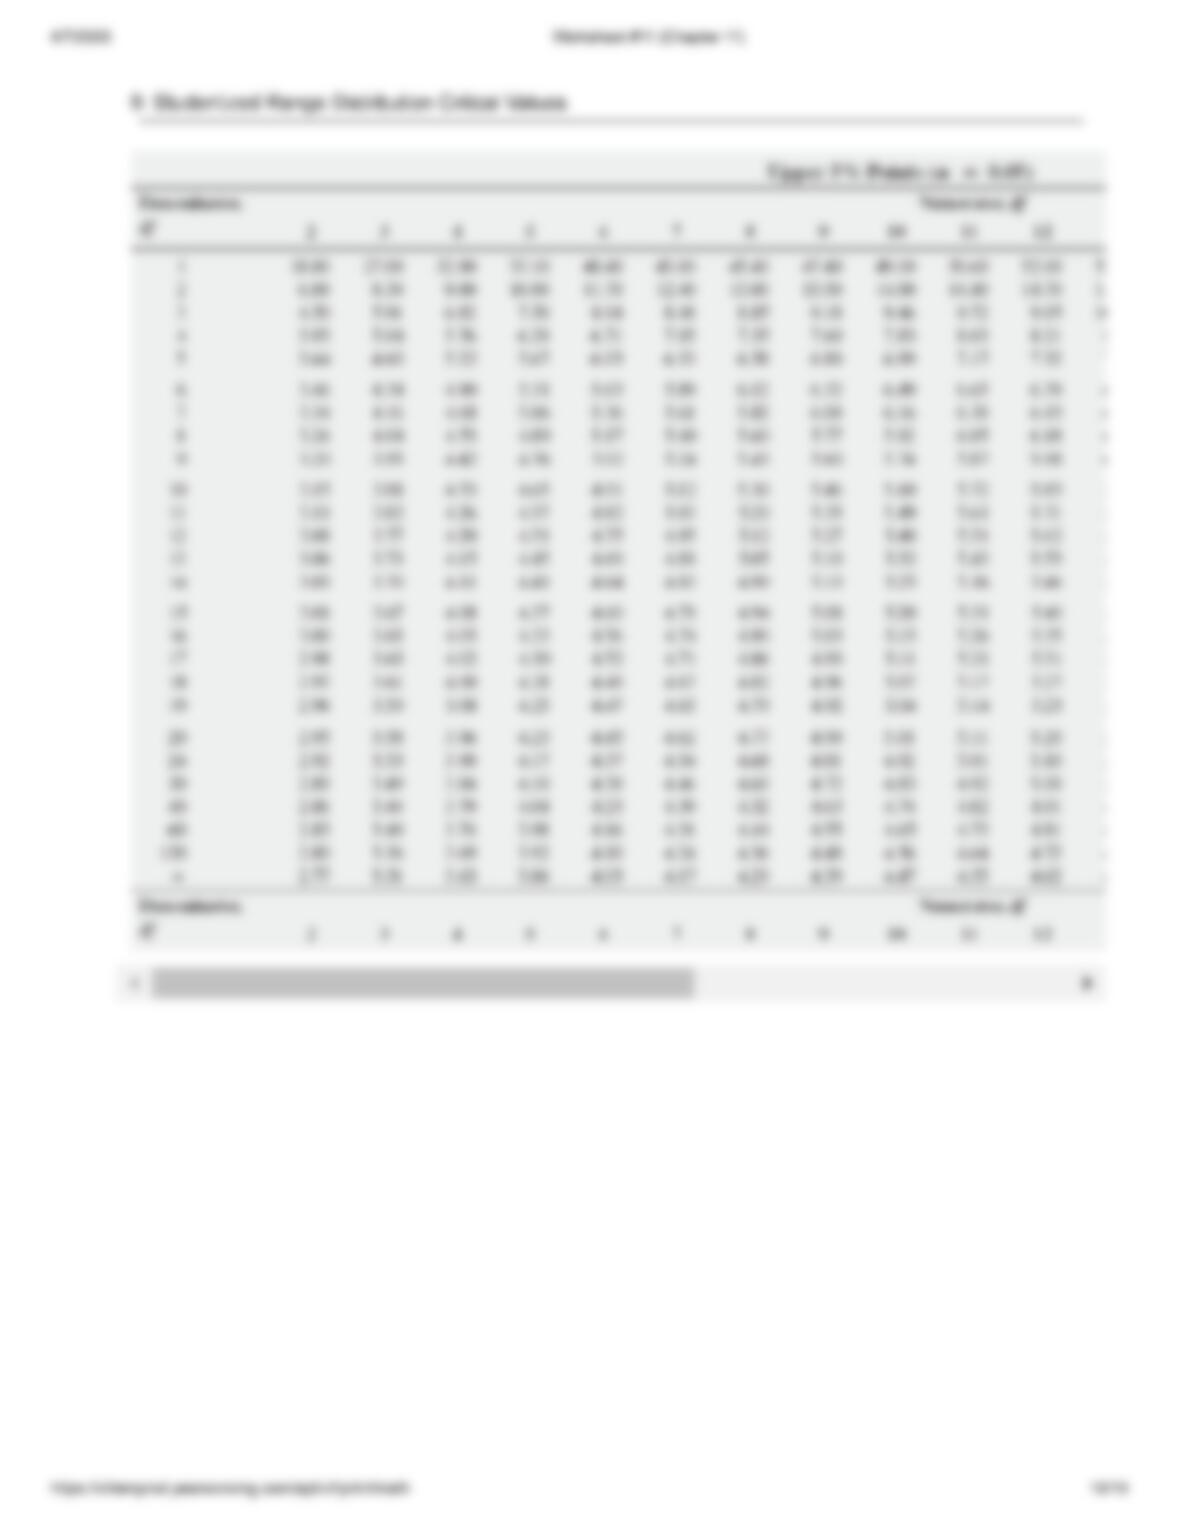
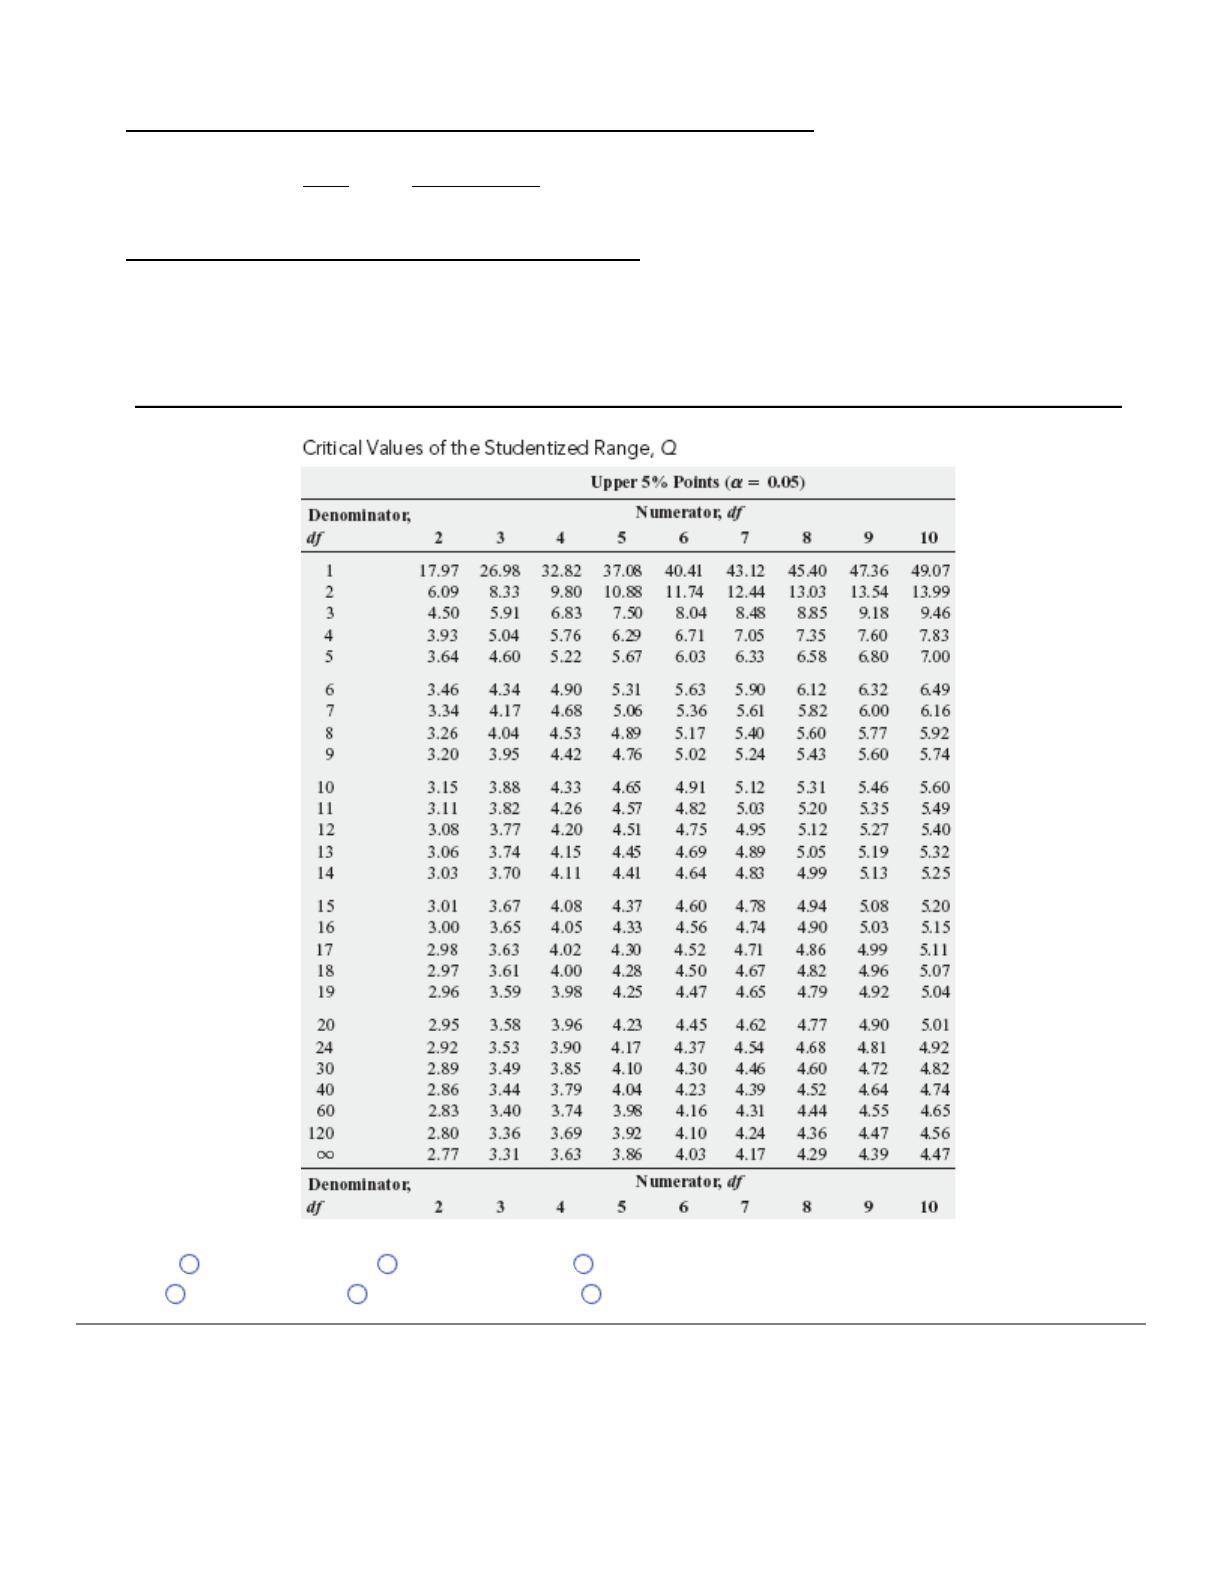
Click here to view a partial table of critical values of the Studentized Range, Q.2
a. Complete the ANOVA summary table.
Source
Degrees of
Freedom Sum of Squares Mean Squares F
Among groups 2 927,116.40
Within groups 46 10,251,767.92
Total 48 11,178,884.32
(Type integers or decimals rounded to two decimal places as needed.)
b. At the level of significance, is there evidence of a difference in mean brand value among the sectors?0.05
Determine the hypotheses. Choose the correct answer below.
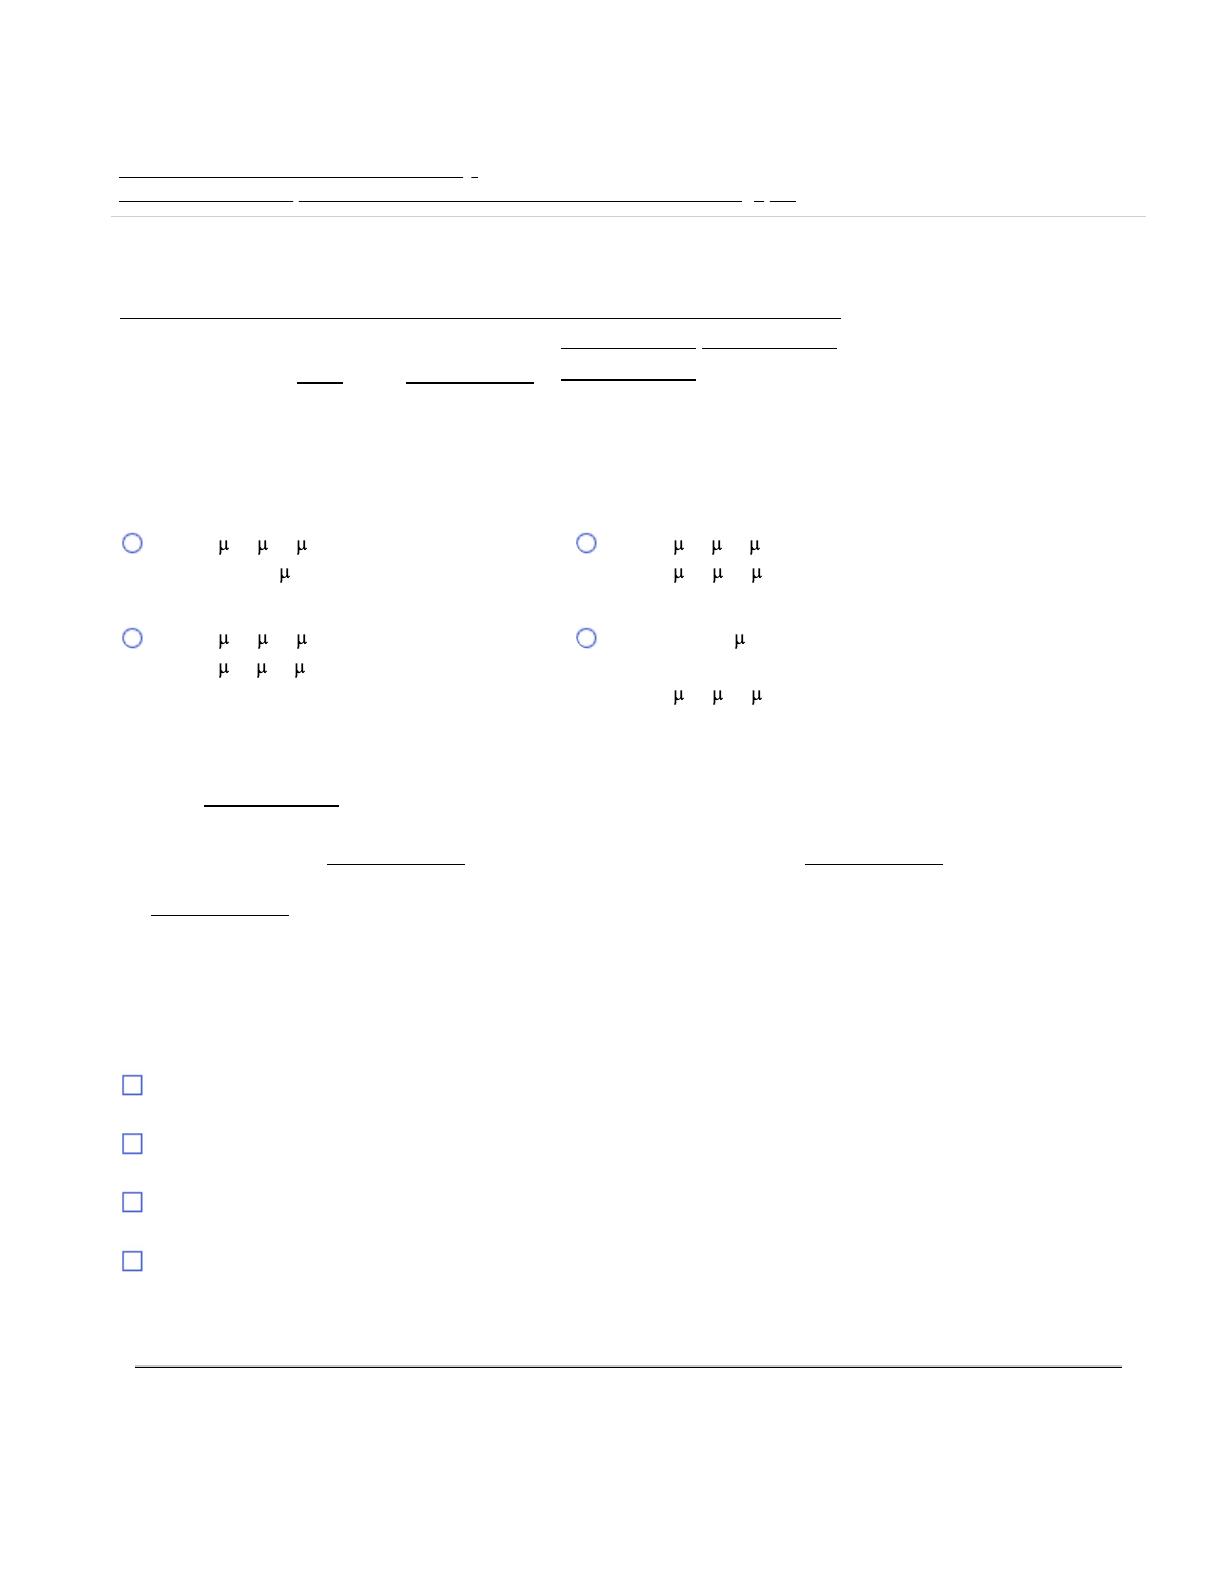
A. H0: 123
= =
H1: Not all are equal
j
(where j 1,2,3)=
B. H0: 123
≠ ≠
H1: 1 2 3
= =
C. H0: 123
= =
H1: 123
≠ ≠
D. H0: Not all are equal
j
(where j 1,2,3)=
H1: 1 2 3
= =
Determine the p-value.
p-value (Round to three decimal places as needed.)=
Since the p-value is (1) than the level of significance, (2) . There is
(3) evidence to conclude that there is a difference in mean brand value among the sectors.
0.05 H0
c. If the results in (b) indicate that it is appropriate, use the Tukey-Kramer procedure to determine which sectors differ
in mean rating. Discuss your findings.
At the level of significance, for which sectors is there enough evidence to conclude that the mean ratings differ?
Select all that apply.
0.05
A. There is a significant difference in mean brand value between technology brands and telecom
brands.
B. There is a significant difference in mean brand value between financial institutions and telecom
brands.
C. There is a significant difference in mean brand value between financial institutions and
technology brands.
D. Because there is no significant difference among the groups, the Tukey-Kramer procedure is
not appropriate.
4/7/2020 Worksheet #11 (Chapter 11)
https://xlitemprod.pearsoncmg.com/api/v1/print/math 3/18
2: Critical values of the Studentized Range, Q
(1) less
greater
(2) reject
do not reject
(3) insufficient
sufficient
Source
Degrees of
Freedom Sum of Squares
Mean
Squares F
Among groups 2 927,116.40
Within groups 46 10,251,767.92
Total 48 11,178,884.32
Group N Mean
Financial Institution 22 24,368.77
Technology 16 61,045.34
Telecom 11 37,477.73

4/7/2020 Worksheet #11 (Chapter 11)
https://xlitemprod.pearsoncmg.com/api/v1/print/math 4/18
4.
A pet food company conducted an experiment to compare different cat foods. A sample of cats from the
population at a local animal shelter was selected. Six cats were randomly assigned to each of the five products. Each
was then presented with 3 ounces of the selected food in a dish at feeding time. The researchers defined the variable
to be measured as the number of ounces of food that the cat consumed within a 10-minute time interval. The results
for this experiment are summarized in the accompanying table. Complete (a) through (d) below.
five 30
Click on the icon to view the results.
3
Click on the icon to view a partial table of critical values of F.
4
Click on the icon to view a partial table of critical values of the Studentized Range, Q.
5
a. At the level of significance, is there evidence of a difference in the mean amount of food eaten among the
various products?
0.05
Determine the hypotheses. Choose the correct answer below.
A. H0: 1 2
= = • • • = 6
H1: Not all are equal
j
(where j 1,2, …, )= 6
B. H0: 1 2
= = • • • = 5
H1: Not all are equal
j
(where j 1,2, …, )= 5
C. H0: 1 2
= = • • • = 5
H1: 1 2
≠ ≠ • • • ≠ 5
D. H0: 1 2
= = • • • = 6
H1: 1 2
≠ ≠ • • • ≠ 6
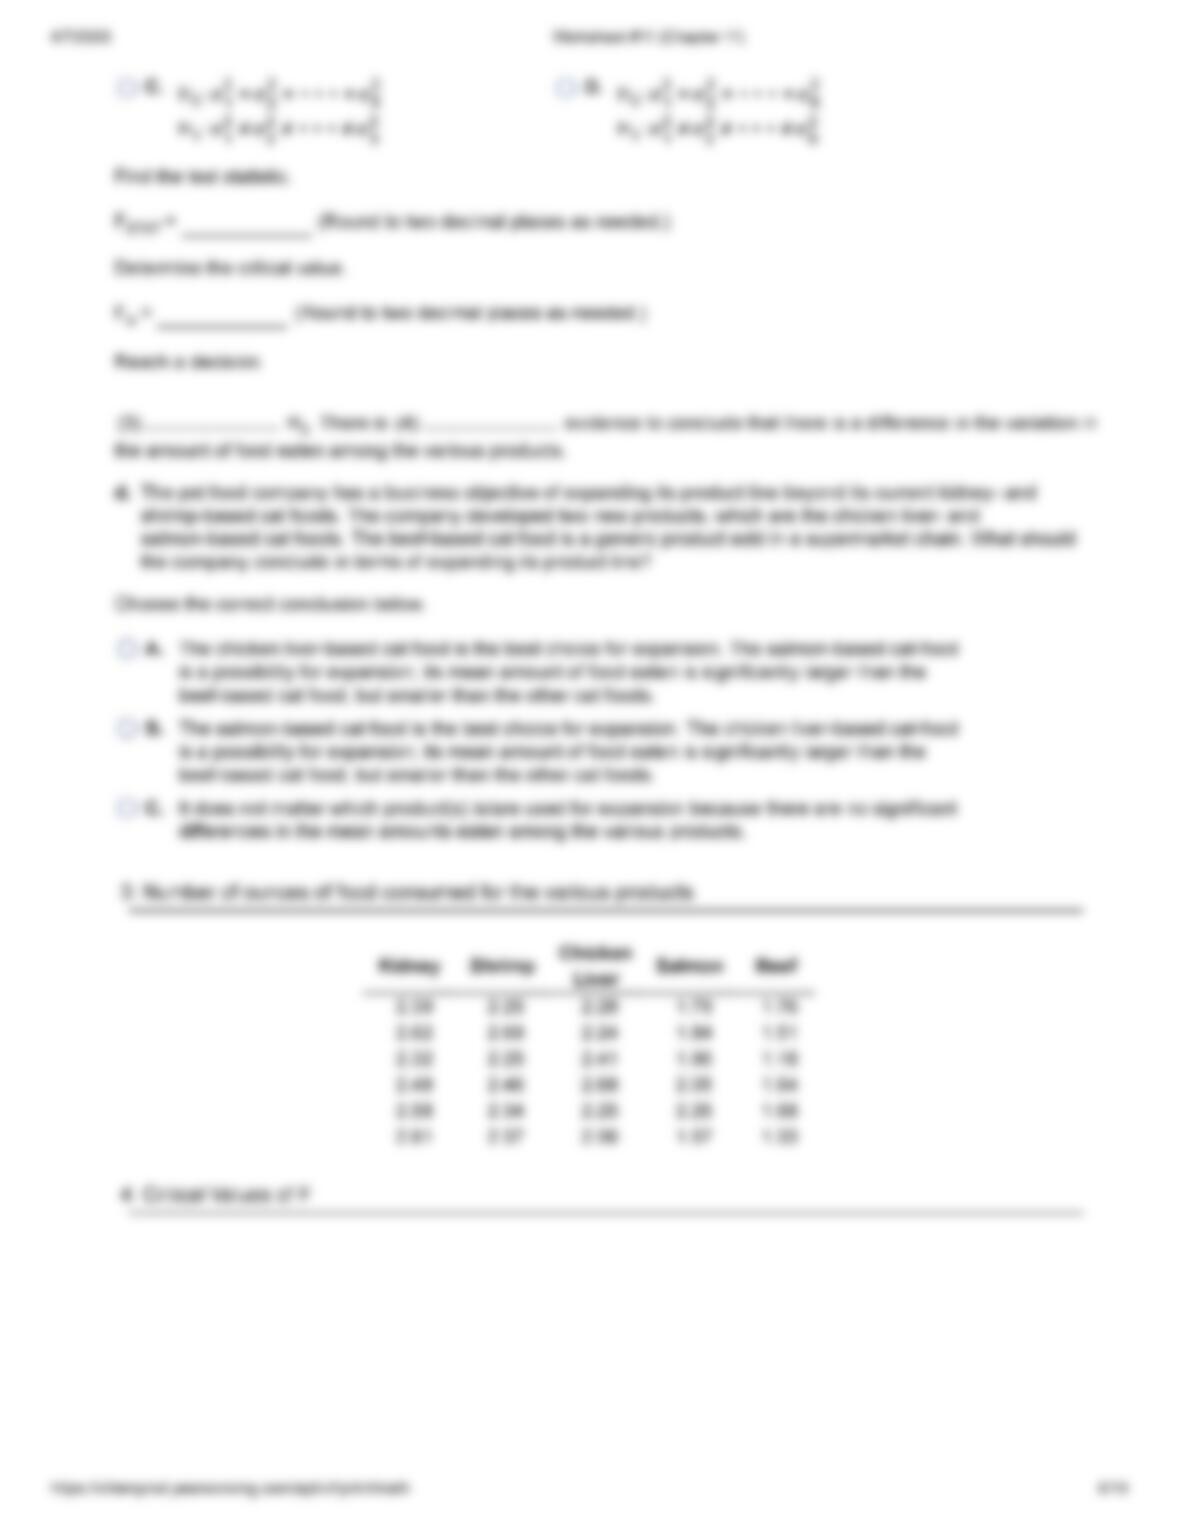
Find the test statistic.
FSTAT (Round to two decimal places as needed.)=
Determine the critical value.
F (Round to two decimal places as needed.)=
Reach a decision.
(1) H0. There is (2) evidence of a difference in the mean amount of food eaten
among the various products.
b. If appropriate, determine which products differ in the mean amount of food eaten.
Let the kidney-based cat food be group 1, the shrimp-based cat food be group 2, the chicken liver-based cat food be
group 3, the salmon-based cat food be group 4, and the beef-based cat food be group 5.
Is there significant evidence that group 1 and group 2 differ in the mean amount of food eaten?
A. No
B. Yes
C. It is not appropriate to test which products differ in the mean amount of food eaten.
Is there significant evidence that group 1 and group 3 differ in the mean amount of food eaten?
A. No
B. Yes
C. It is not appropriate to test which products differ in the mean amount of food eaten.
Is there significant evidence that group 1 and group 4 differ in the mean amount of food eaten?
A. Yes
B. No
C. It is not appropriate to test which products differ in the mean amount of food eaten.
4/7/2020 Worksheet #11 (Chapter 11)
Is there significant evidence that group 1 and group 5 differ in the mean amount of food eaten?
A. No
B. Yes
C. It is not appropriate to test which products differ in the mean amount of food eaten.
Is there significant evidence that group 2 and group 3 differ in the mean amount of food eaten?
A. No
B. Yes
C. It is not appropriate to test which products differ in the mean amount of food eaten.
Is there significant evidence that group 2 and group 4 differ in the mean amount of food eaten?
A. No
B. Yes
C. It is not appropriate to test which products differ in the mean amount of food eaten.
Is there significant evidence that group 2 and group 5 differ in the mean amount of food eaten?
A. Yes
B. No
C. It is not appropriate to test which products differ in the mean amount of food eaten.
Is there significant evidence that group 3 and group 4 differ in the mean amount of food eaten?
A. No