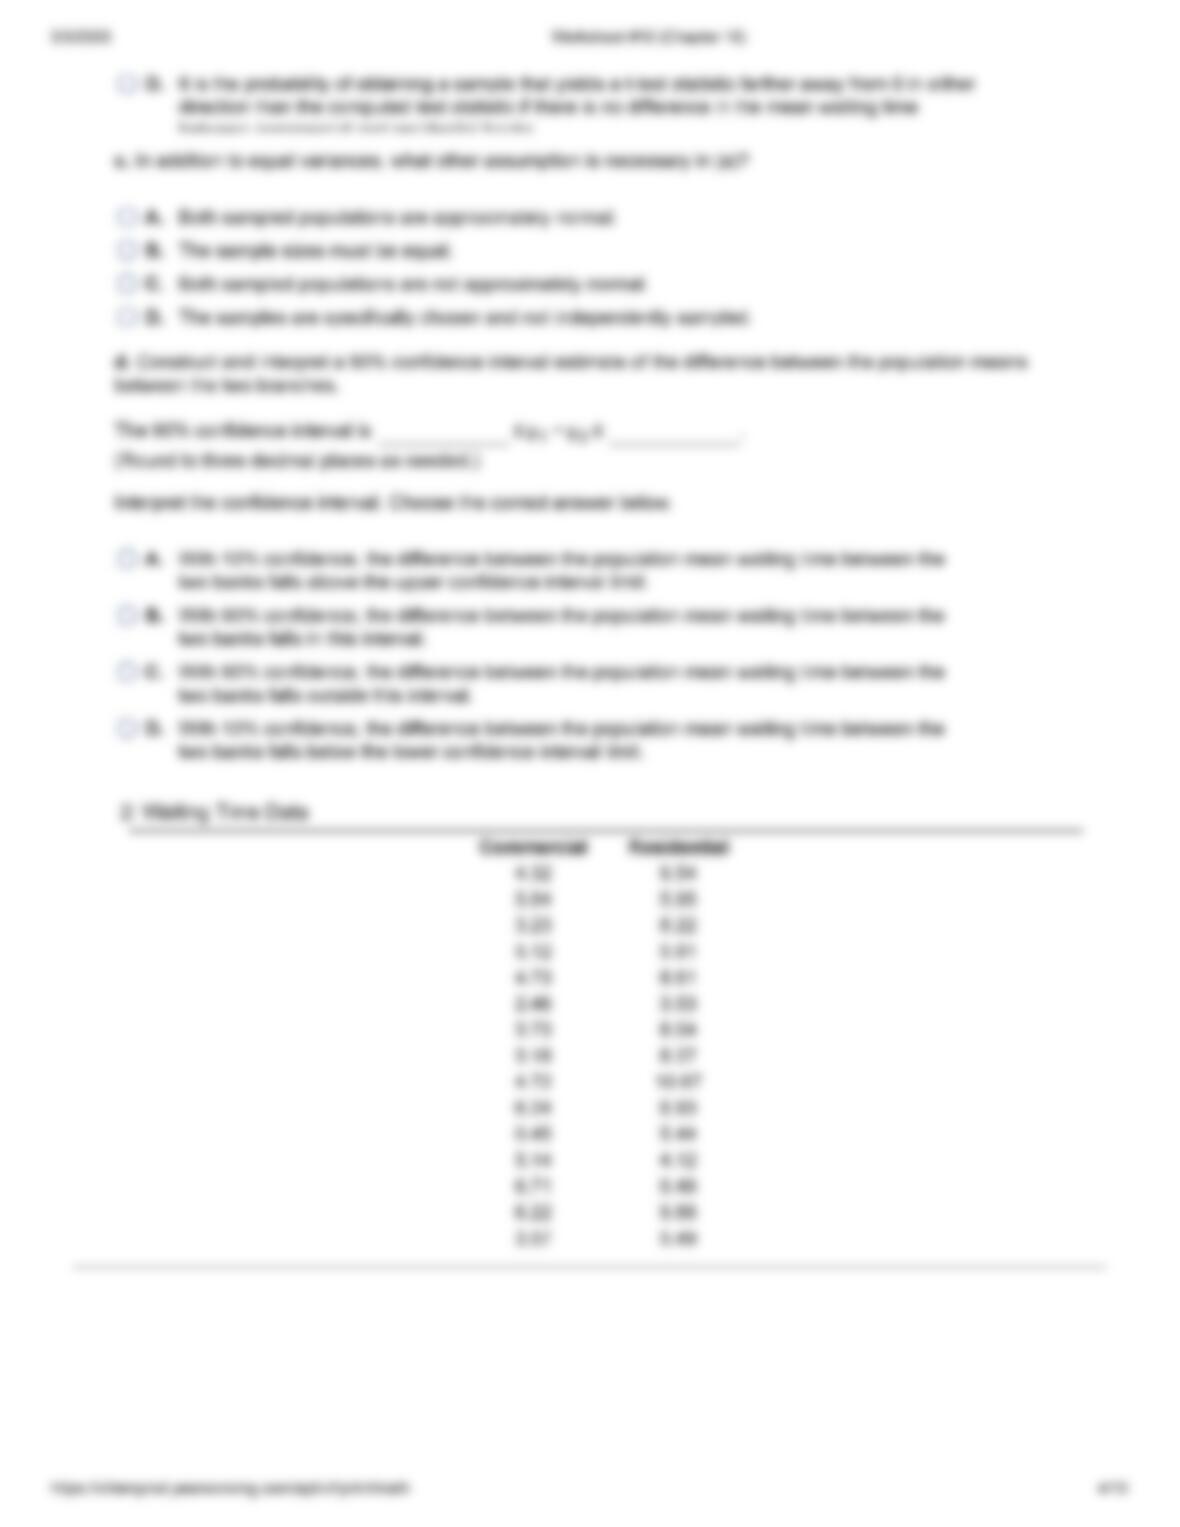
3/3/2020 Worksheet #10 (Chapter 10)
https://xlitemprod.pearsoncmg.com/api/v1/print/math 1/10
1.
Student: _____________________
Date: _____________________
Instructor: Jeremy Mandelkern
Course: MyLab Statistic for Basic
Business Statistics, 14th Edition
Assignment: Worksheet #10 (Chapter
10)
To assess the effectiveness of a cola video ad for cola B, a random sample of 35 individuals from a target audience
was selected to participate in a copy test. Participants viewed two ads, one of which was the ad being tested (cola B).
Participants then answered a series of questions about how much they liked the ads. An adindex measure was
created and shown in the accompanying table; the higher the adindex value, the more likeable the ad. State your
findings and conclusions. Assume 0.05.=
Click the icon to view the data table of the adindex ratings.
1
Compute the descriptive statistics. Find the mean of the adindex ratings for cola A.
(Round to two decimal places as needed.)
Find the mean of the adindex ratings for cola B.
Mean after workshops (Round to two decimal places as needed.)=
Find the mean of the difference of the adindex ratings for cola A and cola B. (Assume the difference to be the cola A
data value minus the cola B data value)
Mean of the difference (Round to two decimal places as needed.)=
Find the variance of the cola A adindex ratings.
(Round to two decimal places as needed.)
Find the variance of the cola B adindex ratings.
(Round to two decimal places as needed.)
Find the variance of the difference of the adindex ratings for cola A and cola B.
(Round to two decimal places as needed.)
Perform a paired t test. Let be the population mean adindex rating for cola A and let be the population mean
adindex rating for cola B. What are the null and alternative hypotheses?
1 2
A. : 0 H0 D = where D=1−2
: 0H1 D ≠
B. : 0 H0 D ≥ where D=1−2
: 0H1 D <
C. : 0 H0 D ≤ where D=1−2
: 0H1 D >
D. : 0 H0 D ≠ where D=1−2
: 0H1 D =
Determine the test statistic, .tSTAT
(Round to two decimal places as needed.)tSTAT =
Find the p-value for the test statistic.
The p-value is .
(Round to three decimal places as needed.)
State your conclusion.

3/3/2020 Worksheet #10 (Chapter 10)
https://xlitemprod.pearsoncmg.com/api/v1/print/math 2/10
2.
1: Data table of the adindex ratings
(1) Reject
Do not reject
(2) is
is insufficient
(1) . There (2) sufficient evidence to conclude that the mean adindex ratings are
higher for cola B than for cola A.
H0
Cola A Cola B Cola A Cola B
88 82 71 81
67 94 65 90
65 71 87 87
89 90 63 67
64 78 67 74
89 73 82 87
81 71 86 66
75 77 72 67
63 63 60 85
88 63 83 94
62 91 59 84
65 84 75 75
82 90 73 80
65 87 76 78
69 84 76 75
67 82 80 81
78 78 69 73
83 89
Assume there is a sample of , with the sample mean and a sample standard deviation of , and
there is an independent sample of from another population with a sample mean of and a sample
standard deviation . In performing the pooled-variance t test, how many degrees of freedom are there?
n = 4
1= 44X1S = 2
1
n = 6
2= 35X2
S = 5
2
There are degrees of freedom.
(Simplify your answer.)
3/3/2020 Worksheet #10 (Chapter 10)
3.
A bank with branches located in a commercial district of a city and in a residential area has the business objective of developing
an improved process for serving customers during the noon-to-1 P.M. lunch period. Management decides to first study the
waiting time in the current process. The waiting time is defined as the number of minutes that elapses from when the customer
enters the line until he or she reaches the teller window. Data are collected from a random sample of 15 customers at each
branch. Complete parts (a) through (d) below.
Click the icon to view the bank branch data.
2
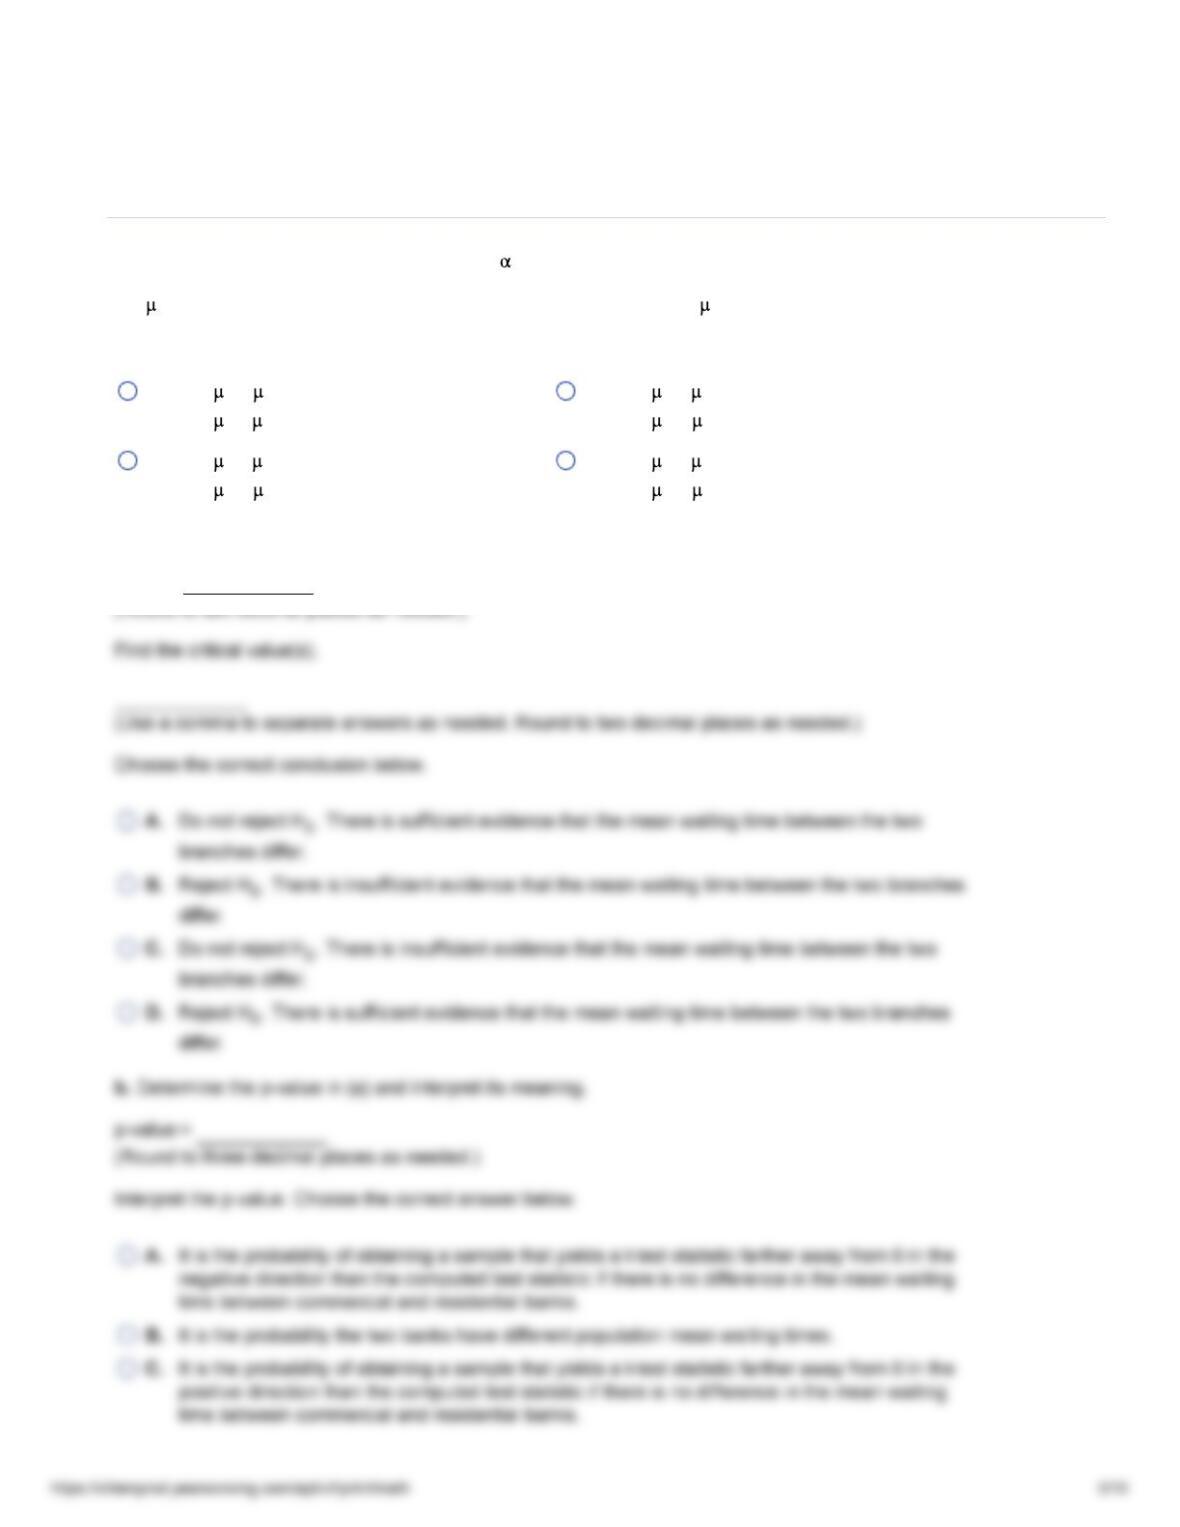
a. Assuming that the population variances from both banks are equal, is there evidence of a difference in the mean
waiting time between the two branches? (Use )= 0.1.
Let be the mean waiting time of the commercial district branch and be the mean waiting time of the residential
area branch. Determine the hypotheses. Choose the correct answer below.
1 2
A. : H0=
1 2
: H1≠
1 2
B. : H0≠
1 2
: H1=
1 2
C. : H0≥
1 2
: H1<
1 2
D. : H0≤
1 2
: H1>
1 2
Find the test statistic.
tSTAT =