
158
blo7716x_ch06_157-190.indd 158 09/18/15 07:32 PM
6
The rapid growth of business firms in the last two decades has challenged the inge–
nuity of financial managers to provide adequate financing. Rapidly expanding sales
may cause intense pressure for inventory and receivables buildup—draining the
cash resources of the firm. As indicated in Chapter 4, “Financial Forecasting,” a large
sales increase creates an expansion of current assets, especially accounts receivable
and inventory. Some of the increased current assets can be financed through the firm’s
retained earnings, but in most cases internal funds will not provide enough financing and
some external sources of funds must be found. In fact, the faster the growth in sales,
the more likely it is that an increasing percentage of financing will be external to the firm.
These funds could come from the sale of common stock, preferred stock, long-term
bonds, short-term securities, and bank loans, or from a combination of short- and long-
term sources of funds.
There is also the problem of seasonal sales that affects many industries such as soft
drinks, toys, retail sales, and textbook publishing. Seasonal demand for products makes
forecasting cash flows and receivables and inventory management difficult. The Internet
and cloud computing are beginning to alleviate some of these problems and help manage-
ment make better plans.
If you have had a marketing course, you have heard about supply chain manage–
ment. Well, financial executives are also interested in the supply chain as an area where
the Internet can help control working capital through online software. McDonald’s
Corporation of Big Mac fame formed eMac Digital to explore opportunities in business-to-
business (B2B) online ventures. One of the first things on the agenda was to have eMac
Digital help McDonald’s reduce costs. McDonald’s wanted to create an online market–
place where restaurants can buy supplies online from food companies. McDonald’s, like
Walmart, Harley-Davidson, and Ericsson, has embraced supply chain management using
web-based procedures. The goal is to squeeze out inefficiencies in the supply chain and
thereby lower costs. One of the big benefits is a reduction in inventory through online
Working
Capital and
the Financing
Decision
LO 6-1 Working capital management involves
financing and controlling the current
assets of the firm.
LO 6-2 Management must distinguish between
current assets that are easily converted to
cash and those that are more permanent.
LO 6-3 The financing of an asset should be tied
to how long the asset is likely to be on the
balance sheet.
LO 6-4 Long-term financing is usually more expensive
than short-term financing based on the theory
of the term structure of interest rates.
LO 6-5 Risk, as well as profitability, determines
the financing plan for current assets.
LO 6-6 Expected value analysis may sometimes be
employed in working capital management.
LEARNING OBJECTIVES
Final PDF to printer

Chapter 6 Working Capital and the Financing Decision 159
blo7716x_ch06_157-190.indd 159 09/18/15 07:32 PM
communications between the buyer and supplier, which speeds up the ordering and
delivery process and reduces the amount of inventory needed on hand. These systems
may also be able to attract a large number of suppliers to bid on the company’s business
at more competitive prices.
Retailers like Walmart require suppliers to ship their goods with radio frequency iden-
tification chips (RFID) embedded in their shipments. These chips eliminate processing
delays, reduce theft, and result in better inventory management. From the financial man-
ager’s viewpoint, anything that can reduce inventory levels without creating out-of-stock
situations will reduce the amount of money needed to finance inventory. You can read
more about Walmart and RFID chips in the nearby Finance in Action box.
Working capital management involves the financing and management of the current
assets of the firm. The financial executive probably devotes more time to working capital
management than to any other activity. Current assets, by their very nature, are changing
daily, if not hourly, and managerial decisions must be made. “How much inventory is to
be carried, and how do we get the funds to pay for it?” Unlike long-term decisions, there
can be no deferral of action. While long-term decisions involving plant and equipment or
market strategy may well determine the eventual success of the firm, short-term decisions
on working capital determine whether the firm gets to the long term.
In this chapter, we examine the nature of asset growth, the process of matching sales
and production, financial aspects of working capital management, and the factors that go
into development of an optimum policy.
Any company that produces and sells a product, whether the product is consumer or
manufacturer oriented, will have current assets and fixed assets. If a firm grows, those
assets are likely to increase over time. The key to current asset planning is the ability
of management to forecast sales accurately and then to match the production sched-
ules with the sales forecast. Whenever actual sales are different from forecast sales,
unexpected buildups or reductions in inventory will occur that will eventually affect
receivables and cash flow.
In the simplest case, all of the firm’s current assets will be self-liquidating assets
(sold at the end of a specified time period). Assume that at the start of the summer
you buy 100 tires to be disposed of by September. It is your intention that all tires will
be sold, receivables collected, and bills paid over this time period. In this case, your
working capital (current asset) needs are truly short term.
Now let us begin to expand the business. In stage two, you add radios, seat cov-
ers, and batteries to your operation. Some of your inventory will again be completely
liquidated, while other items will form the basic stock for your operation. To stay
in business, you must maintain floor displays and multiple items for selection. Fur-
thermore, not all items will sell. As you eventually grow to more than one store, this
“permanent” aggregate stock of current assets will continue to increase. Problems of
inadequate financing arrangements are often the result of the businessperson’s failure
to realize the firm is carrying not only self-liquidating inventory, but also the anomaly
of “permanent” current assets.
The Nature of Asset Growth
Final PDF to printer

160
blo7716x_ch06_157-190.indd 160 10/05/15 07:27 PM
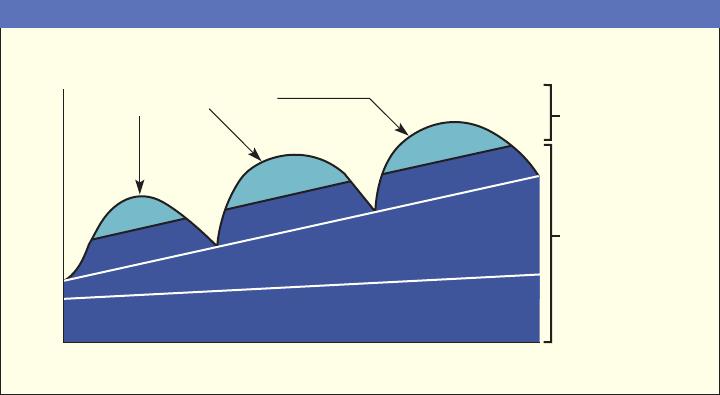
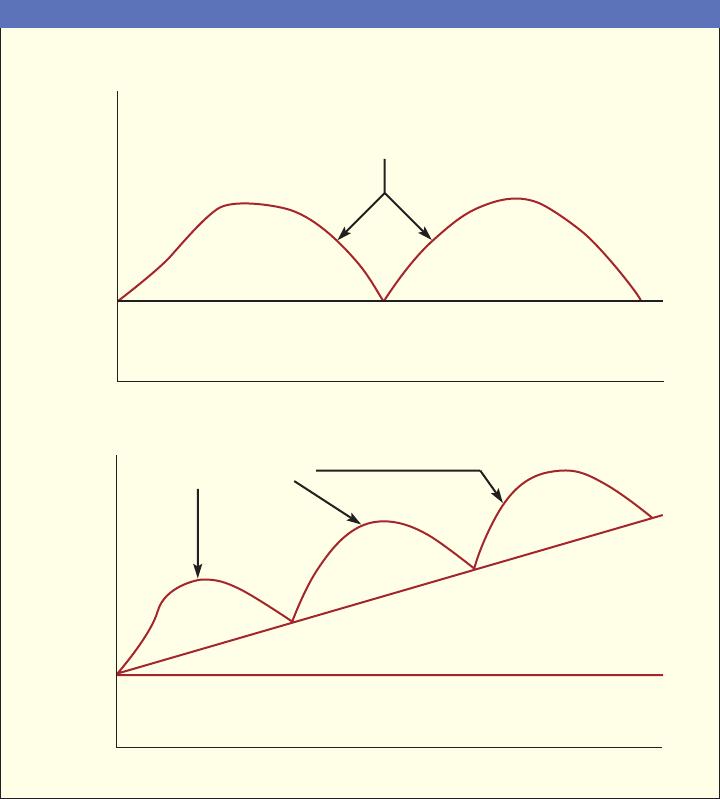
The movement from stage one to stage two of growth for a typical business is
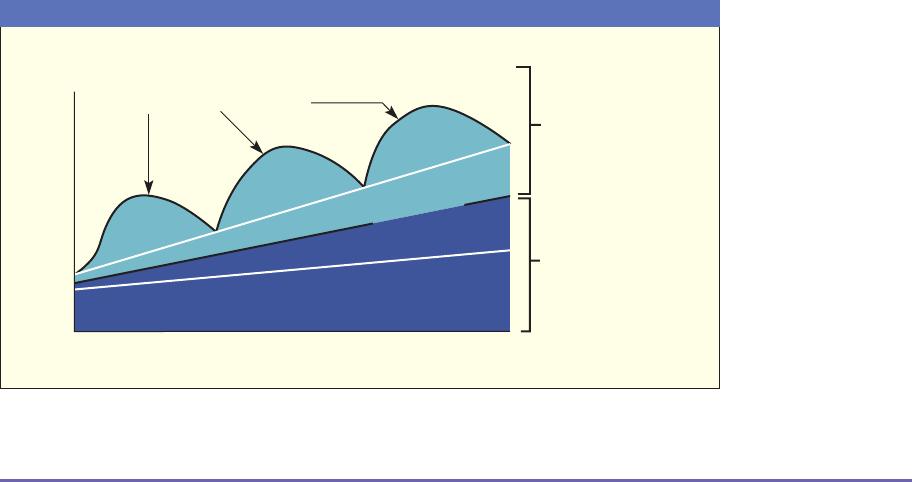
depicted in Figure6-1. In panel A, the buildup in current assets is temporary—while
in panel B, part of the growth in current assets is temporary and part is permanent.
(Fixed assets are included in the illustrations, but they are not directly related to the
present discussion.)
RFID (radio frequency identification technol–
ogy), a system that has been around since
World War II and was used by the military
to keep track of airplanes, continues to gain
traction in inventory/supply chain manage–
ment. RFID chips have been used in trains,
ships, and trucks to track shipment contain–
ers. They are also used in automatic toll sys–
tems that allow drivers to pass through tolling
areas without stopping. The state of Michigan
has used these chips to track livestock; mara–
thon officials have used them to track a run–
ner’s time; and the Defense Department has
used them to track the shelf life of their food
rations. Additionally, they are now being used
to make sure that shipping containers entering
U.S. ports have not been tampered with after
inspection.
Hewlett-Packard, in a business briefing
paper, indicates that there may be as much
as $45 billion of excess inventory in the retail
supply chain that is unaccounted for at any
given time. In short, RFID chips can help a
company track goods and make sure that the
right goods get to the right places on time.
More sophisticated chips can be reused and
can even record a sale. For example, if an
expensive piece of jewelry is sold with a chip
attached, when the chip is decommissioned,
the sale automatically shows up in the store’s
computer system.
In 2005, Walmart mandated that by the
end of 2007, its 300 largest suppliers must
have RFID chips in each pallet of goods
shipped to its distribution centers. Procter
& Gamble was one of the first companies to
comply and found the system beneficial in
managing its own inventory, reducing out-of-
stock inventory levels, and preventing inven–
tory theft or theft of goods in transit. For
manufacturers of expensive products such
as pharmaceuticals, theft reduction can be
a significant cost saving. P&G noted that
when comparing bar codes to RFID chips, it
took 20 seconds to manually tally bar-code
data on a pallet versus five seconds to read
RFID technology. P&G states that it earned a
return on its RFID investment in the millions
of dollars.
According to the RFID Journal’s January 7,
2013, issue, 19 of the top 30 U.S. retailers are
involved at some level with RFID chips, but full
utilization of these chips has a long way to go
before they are used throughout their stores
for all products. Many specialty retailers are
beginning to use RFID technology; American
Apparel has adopted RFID technology at all
280 of its stores.
A rather unique use of these chips is for
high-value poker chips at casinos. In 2010,
a robber came into the Bellagio in Las Vegas
and left with $1.5 million in poker chips. Little
did he know that the chips had embedded
RFID chips, and as soon as he walked out of
the casino, the chips became worthless and
unable to be used anywhere.
A Great Inventory Tracking System
May Be Helping You
Finance in
ACTION
Technology
In most firms, fixed assets grow slowly as productive capacity is increased and old
equipment is replaced, but current assets fluctuate in the short run, depending on the
level of production versus the level of sales. When the firm produces more than it
sells, inventory rises. When sales rise faster than production, inventory declines and
receivables rise.
Controlling Assets—Matching Sales and Production
Final PDF to printer
Chapter 6 Working Capital and the Financing Decision 161
blo7716x_ch06_157-190.indd 161 09/18/15 07:32 PM
As discussed in the treatment of the cash budgeting process in Chapter 4, some
firms employ level production methods to smooth production schedules and use man–
power and equipment efficiently at a lower cost. One consequence of level production
is that current assets go up and down when sales and production are not equal. Other
firms may try to match sales and production as closely as possible in the short run.
This allows current assets to increase or decrease with the level of sales and eliminates
the large seasonal bulges or sharp reductions in current assets that occur under level
production.
Seasonal industries can be found in manufacturing, retailing, electricity, and natural
gas. Demand is uneven in these industries, and many exhibit a seasonal demand. For
example, electricity producers have more demand in the summer for air condition-
ing while natural gas companies have more demand in the winter for heating. One
small manufacturing company that exhibits this type of seasonal demand is Briggs and
Stratton Corporation from Wauwatosa, Wisconsin.
Fixed assets
Time period
B. Stage II: Growth
Dollars
A. Stage I: Limited or no growth
Dollars
Temporary current assets
Temporary current assets
Permanent
current assets
Fixed assets
Time period
Figure 6-1 The nature of asset growth
Final PDF to printer
162 Part 3 Working Capital Management
blo7716x_ch06_157-190.indd 162 09/18/15 07:32 PM
Briggs and Stratton is the largest maker of 3.5 to 25 horsepower air-cooled gas–
oline engines. Chances are if you’ve ever mowed a lawn, your lawnmower had a
Briggs and Stratton engine. Their motors can be found in pressure washers, compres–
sors and pumps, garden tillers, generators, small tractors, lawnmowers, and outboard
marine engines, and about 30 percent of the company’s overall sales are in the inter–
national market.
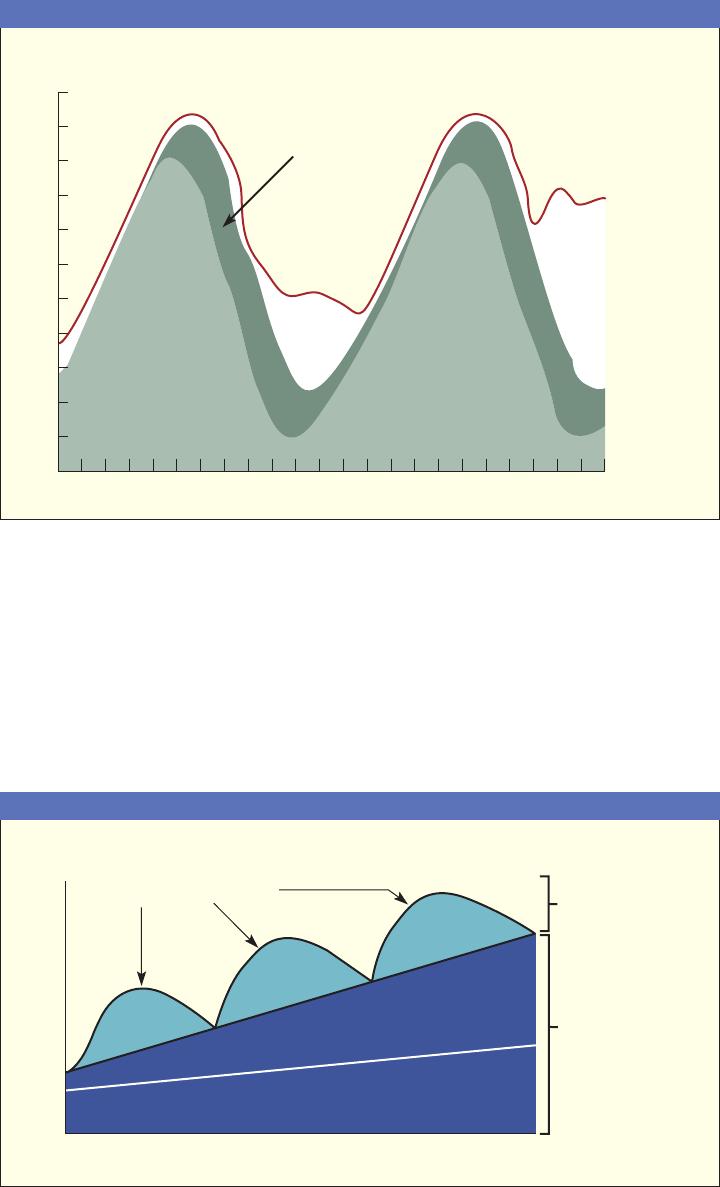
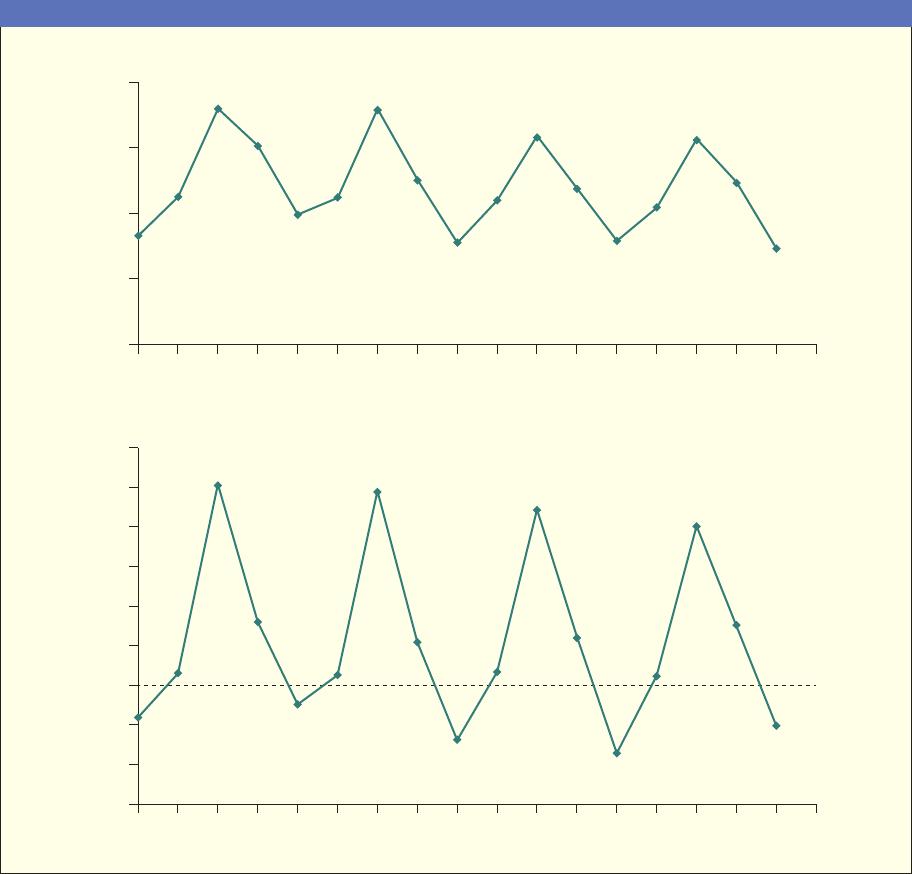
Briggs and Stratton’s fiscal year ends in June, and Figure 6-2 demonstrates both the
seasonality of sales and the leverage impact on earnings per share that we discussed in
Chapter 5. Because Briggs sells most of its products to other manufacturers who use
the engines as part of their finished products, a large percentage of sales must occur
–0.4
–0.6
–0.2
0.2
0.0
0.6
0.4
0.8
1.0
1.2
0
200
400
600
800
123412341234123412
2011 2012 2013 2014 2015
123412341234123412
2011 2012 2013 2014 2015
Sales in millions $
Earnings per share
Figure 6-2 Quarterly sales and earnings per share for Briggs and Stratton
Final PDF to printer
Chapter 6 Working Capital and the Financing Decision 163
blo7716x_ch06_157-190.indd 163 09/18/15 07:32 PM
early in the year in order to produce the garden equipment that would be in demand
in spring and summer. We can see from Figure 6-2 that sales are lowest in the July to
September quarter, followed by the September–December quarter. Peak sales are in
the third quarter, beginning in January and ending in March. There are carryover sales
in the April to June quarter, which is the second best period for Briggs and Stratton.
Notice that the first quarter of the year always generates negative earnings per
share as the costs of production outweigh the revenue produced. This is most likely
caused by the costs of building inventory. Earnings in the second and fourth quarter
are small, with most of the earnings coming in the peak sales period of the third quar–
ter. For example in 2013, Briggs and Stratton earned $0.90 billion for the year with
$0.89 billion coming in the third quarter; in 2014 the firm earned $0.82 billion with
$0.81 billion coming in the third quarter. The seasonal nature of the company’s sales
can be exacerbated by inventory buildup at the end user and a fall in orders for the next
season. The company has made acquisitions in recent years to diversify its product line
and to smooth out sales and earnings. The future will tell if these acquisitions succeed.
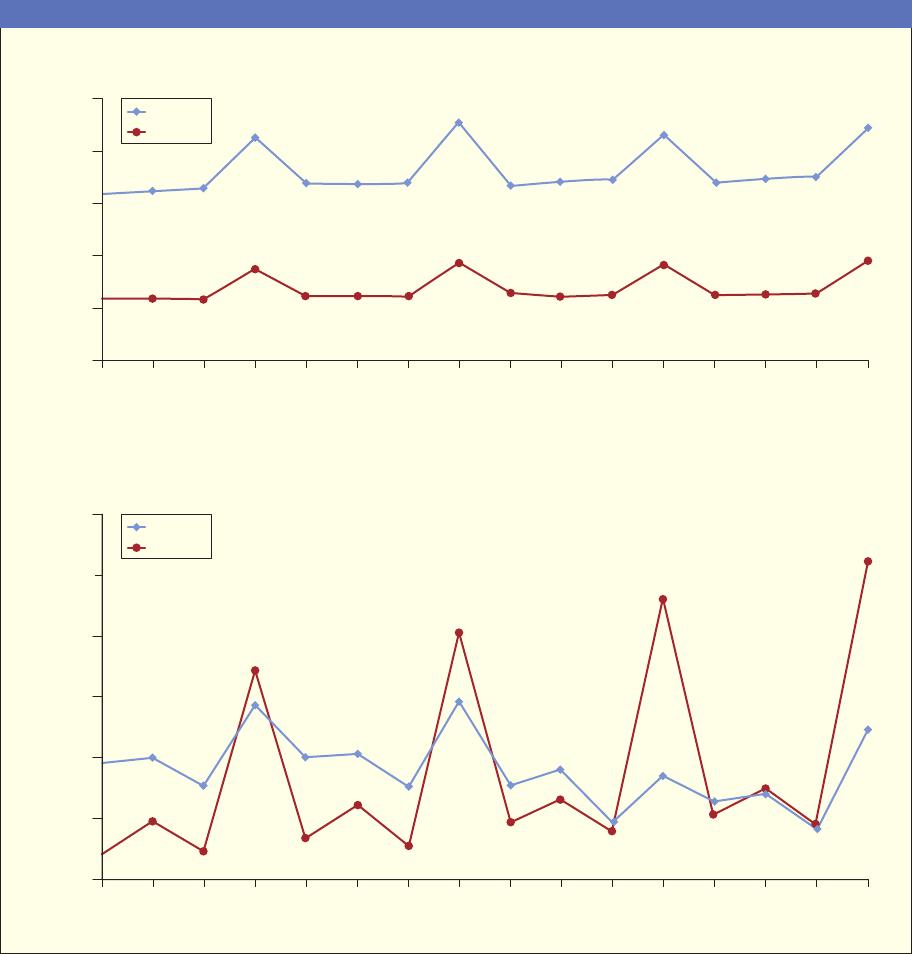
Retail firms such as Target and Macy’s also have seasonal sales patterns. Figure6-3
on the next page shows the quarterly sales and earnings per share of these two compa–
nies, with the quarters ending in April, July, October, and January. These retail compa–
nies do not stock a year or more of inventory at one time. They are selling products that
are either manufactured for them by others or manufactured by their subsidiaries. Most
retail stores are not involved in deciding on level versus seasonal production but rather
in matching sales and inventory. Their suppliers must make the decision to produce on
either a level or a seasonal basis. Since the selling seasons are very much affected by
the weather and holiday periods, the suppliers and retailers cannot avoid inventory risk.
The fourth quarter for retailers, which begins in November and ends in January, is their
biggest quarter and accounts for as much as half of their earnings. You can be sure that
inventory not sold during the Christmas season will be put on sale during January.
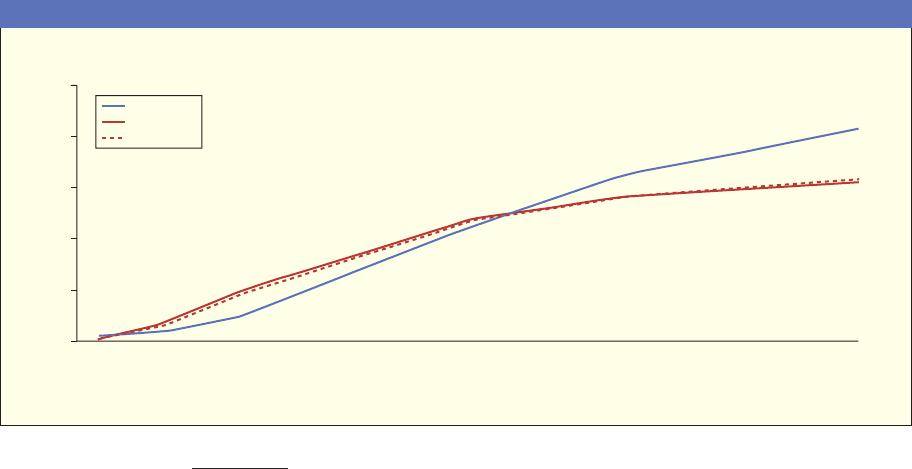
Both Target and Macy’s show seasonal peaks and troughs in sales that will also
be reflected in their cash balances, accounts receivable, and inventory. Notice in
Figure6-3 that Target is growing slightly faster than Macy’s, which has a rather flat
trendline. Even so, Macy’s peak earnings per share are higher than Target’s earnings
per share when the fourth quarter sales peak out. Both companies illustrate the impact
of leverage on earnings as discussed in Chapter 5, but we can tell that Macy’s has
higher leverage because its EPS rises and falls with sales more than Target’s EPS (bot-
tom of Figure6-3). We shall see as we go through the chapter that seasonal sales can
cause asset management problems. A financial manager must be aware of these prob-
lems to avoid getting caught short of cash or unprepared to borrow when necessary.
Many retail-oriented firms have been more successful in matching sales and orders
in recent years because of new, computerized inventory control systems linked to
online point-of-sales terminals. These point-of-sales terminals allow either digital
input or use of optical scanners to record the inventory code numbers and the amount
of each item sold. At the end of the day, managers can examine sales and inventory
levels item by item and, if need be, adjust orders or production schedules. The predict-
ability of the market will influence the speed with which the manager reacts to this
information, while the length and complexity of the production process will dictate
how fast production levels can be changed.
Final PDF to printer
164 Part 3 Working Capital Management
blo7716x_ch06_157-190.indd 164 09/18/15 07:32 PM
Temporary Assets under Level Production—An Example
To get a better understanding of how current assets fluctuate, let us use the example of
the Yawakuzi Motorcycle Company, which manufactures and sells in the snowy U.S.
Midwest. Not too many people will be buying motorcycles during October through
March, but sales will pick up in early spring and summer and will again trail off during
the fall. Because of the fixed assets and the skilled labor involved in the production
process, Yawakuzi decides that level production is the least expensive and the most
2134123412341234
2011 2012 2013 2014
0
5,000
10,000
15,000
20,000
25,000
Sales in millions $
1234123412341234
2011 2012 2013 2014
Earnings per share
0.0
0.5
1.0
1.5
2.0
2.5
3.0 Target
Macy’s
Target
Macy’s
Figure 6-3 Quarterly sales and earnings per share, Target and Macy’s
Final PDF to printer

Chapter 6 Working Capital and the Financing Decision 165
1st Quarter 2nd Quarter 3rd Quarter 4th Quarter
October …………… 300 January ……………. 0 April ………………… 1,000 July …………………. 2,000
November ………… 150 February ………….. 0 May …………………. 2,000 August …………….. 1,000
December ………… 50 March ……………… 600 June ………………… 2,000 September ……….. 500
Total sales of 9,600 units at $3,000 each5$28,800,000 in sales.
Table 6-1 Yawakuzi sales forecast (in units)
Production
Inventory
(at Cost of
Table 6-2 Yawakuzi’s production schedule and inventory
efficient production method. The marketing department provides a 12-month sales
forecast for October through September (Table6-1).
After reviewing the sales forecast, Yawakuzi decides to produce 800 motorcycles
per month, or one year’s production of 9,600 divided by 12. A look at Table6-2 shows
how level production and seasonal sales combine to create fluctuating inventory.
Assume that October’s beginning inventory is one month’s production of 800 units.
The ending inventory level is computed for each month and then multiplied by the
production cost per unit of $2,000.
Final PDF to printer