Waterborne Freight
Transportation
Waterborne Freight
Transportation
June 2013
Bottom Line ReportBottom Line Report
Title Page


e
Table of Contents
Foreword …………………………………………………………………………….i
Acknowledgements ……………………………………………………………………ii
Executive Summary ………………………………………………………………….. iii
1.0 Water Shaped the Nation ……………………………………………………………1-1
1.1 Waterborne Freight in the Age of Sail ………………………………………………..1-1
1.2 Waterborne Freight in the Age of Rail ……………………………………………….1-3
1.3 Waterborne Freight in the Age of Trucking and Intermodalism ……………………………1-4
1.4 The Next Era of Waterborne Freight …………………………………………………1-5
2.0 MTS Assets ………………………………………………………………………2-1
2.1 Definition of the Marine Transportation System ……………………………………….2-1
2.2 MTS Ports and Terminals …………………………………………………………2-2
2.3 MTS Waterways ………………………………………………………………..2-6
2.4 MTS Surface Transportation Connectors ……………………………………………..2-8
2.5 The MTS and Global Vessel Routings ……………………………………………….2-10
3.0 MTS Performance …………………………………………………………………3-1
3.1 MTS Volume and Value ………………………………………………………….3-1
3.2 MTS Commodities and Trades …………………………………………………….3-1
3.3 Historic Trends. . . . . . . . . . . . . . . . . . . . . . . . . . . . . . . . . . . . . . . . . . . . . . . . . . . . . . . . . . . . . . . . . . . . . . . . . . .3-9
3.4 Future Forecasts ……………………………………………………………….3-12
4.0 MTS Benefits …………………………………………………………………….4-1
4.1 Overview ……………………………………………………………………..4-1
4.2 Trade in Critical Commodities …………………………………………………….4-1
4.3 Economic Benefit ……………………………………………………………….4-3
4.4 Reduced Highway and Rail System Congestion ……………………………………….4-5
4.5 Avoided Environmental Impacts …………………………………………………..4-9
4.6 Other MTS Benefits …………………………………………………………….4-10
5.0 MTS Planning and Funding …………………………………………………………5-1
5.1 Stakeholders and Roles …………………………………………………………..5-1
5.2 Federal Roles ………………………………………………………………….5-2
5.3 State and Regional Roles …………………………………………………………5-9

f
Waterborne Freight Transportation: Meeting the Challenges
5.4 Ports ………………………………………………………………………..5-10
5.5 Carriers ……………………………………………………………………..5-11
5.6 System Users …………………………………………………………………5-12
6.0 MTS Challenges ………………………………………………………………….6-1
6.1 Overview ……………………………………………………………………..6-1
6.2 Inadequate Maintenance of Commercial Waterways. . . . . . . . . . . . . . . . . . . . . . . . . . . . . . . . . . . . . . . . . . .6-1
6.3 Inefficient Navigation Project Delivery ………………………………………………6-4
6.4 Uncertain Federal Funding ……………………………………………………….6-8
6.5 Inattention to National Needs and Benefits …………………………………………..6-11
6.6 Lack of Stewardship ……………………………………………………………6-23
7.0 Action Alternatives ………………………………………………………………..7-1
Appendix Materials ………………………………………………………………….A-1

g
List of Tables
ES-1. MTS Volume and Value ……………………………………………………………iv
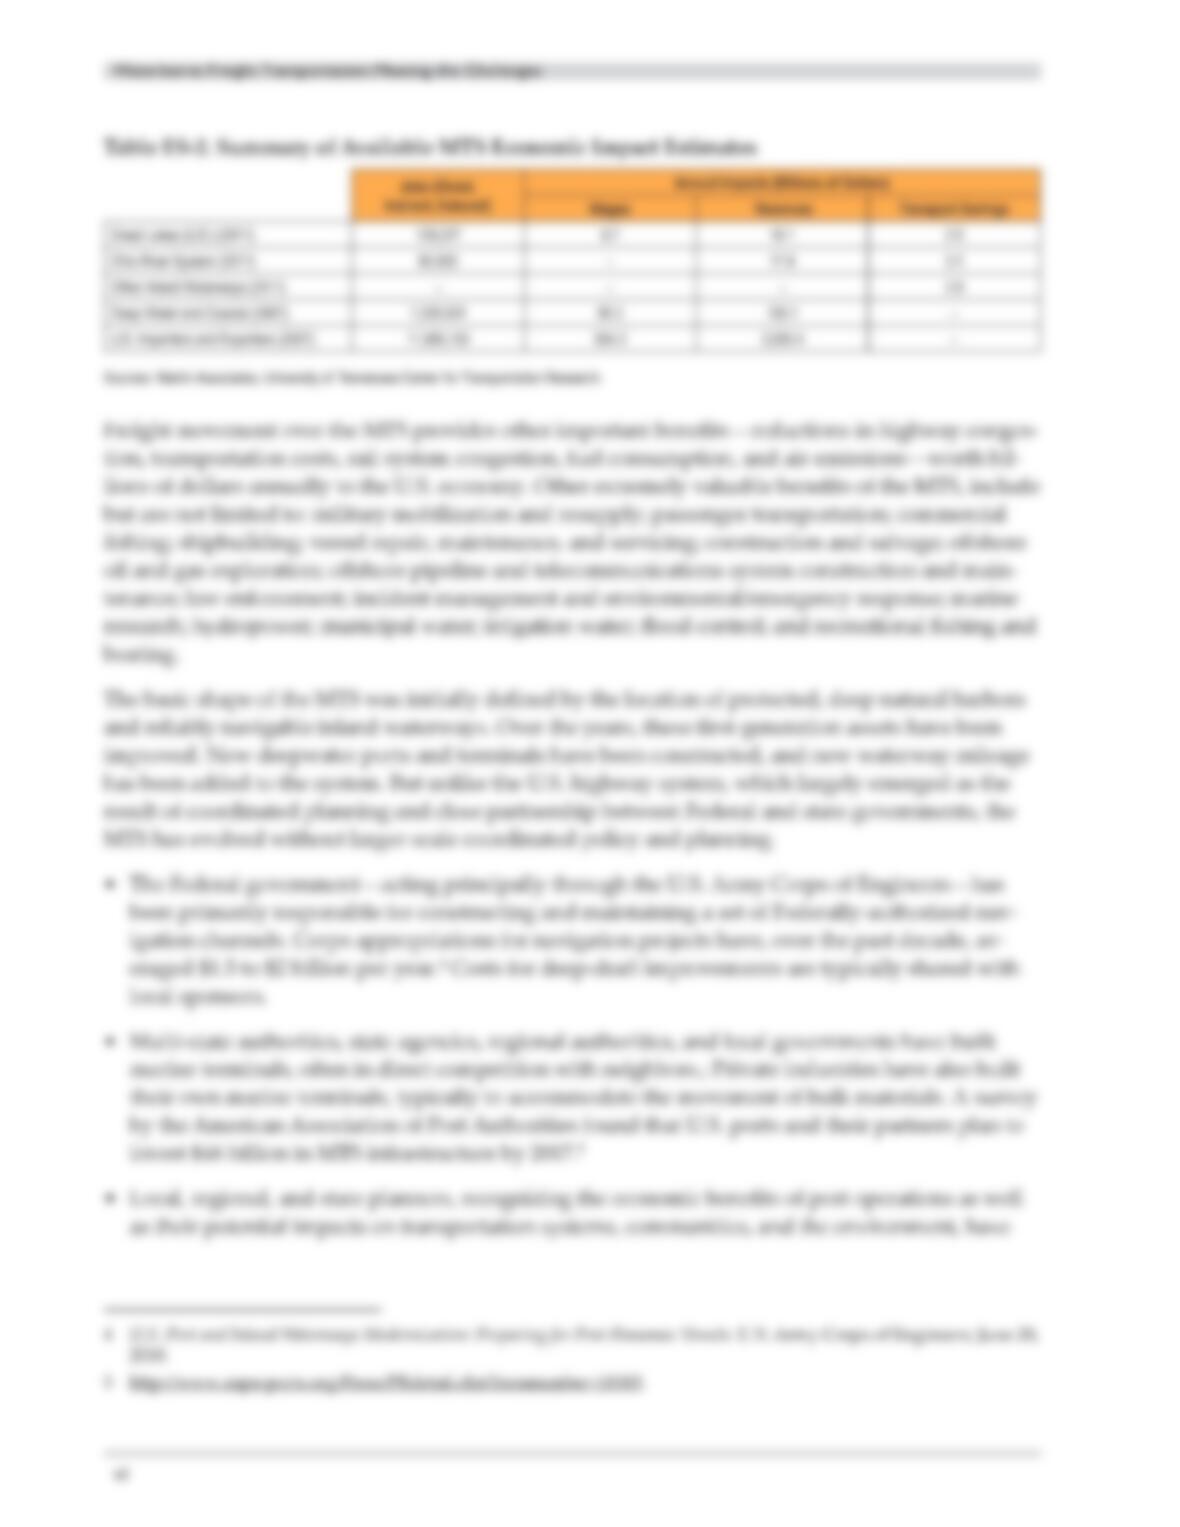
ES-2. Summary of Available MTS Economic Impact Estimates …………………………………..vi
ES-3. Summary of Recommendations ………………………………………………………xi
2-1. Geographic Distribution of MTS Cargo-Handling Docks …………………………………..2-2
2-2. Leading U.S. Ports by Tonnage ………………………………………………………2-3
2-3. Vessel/Terminal Types, Transfer Methods, and Commodities ……………………………….2-4
2-4. Leading U.S. Ports by Total TEUs (Loads + Empties) ………………………………………2-6
2-5. Typology of MTS Waterways ………………………………………………………..2-8
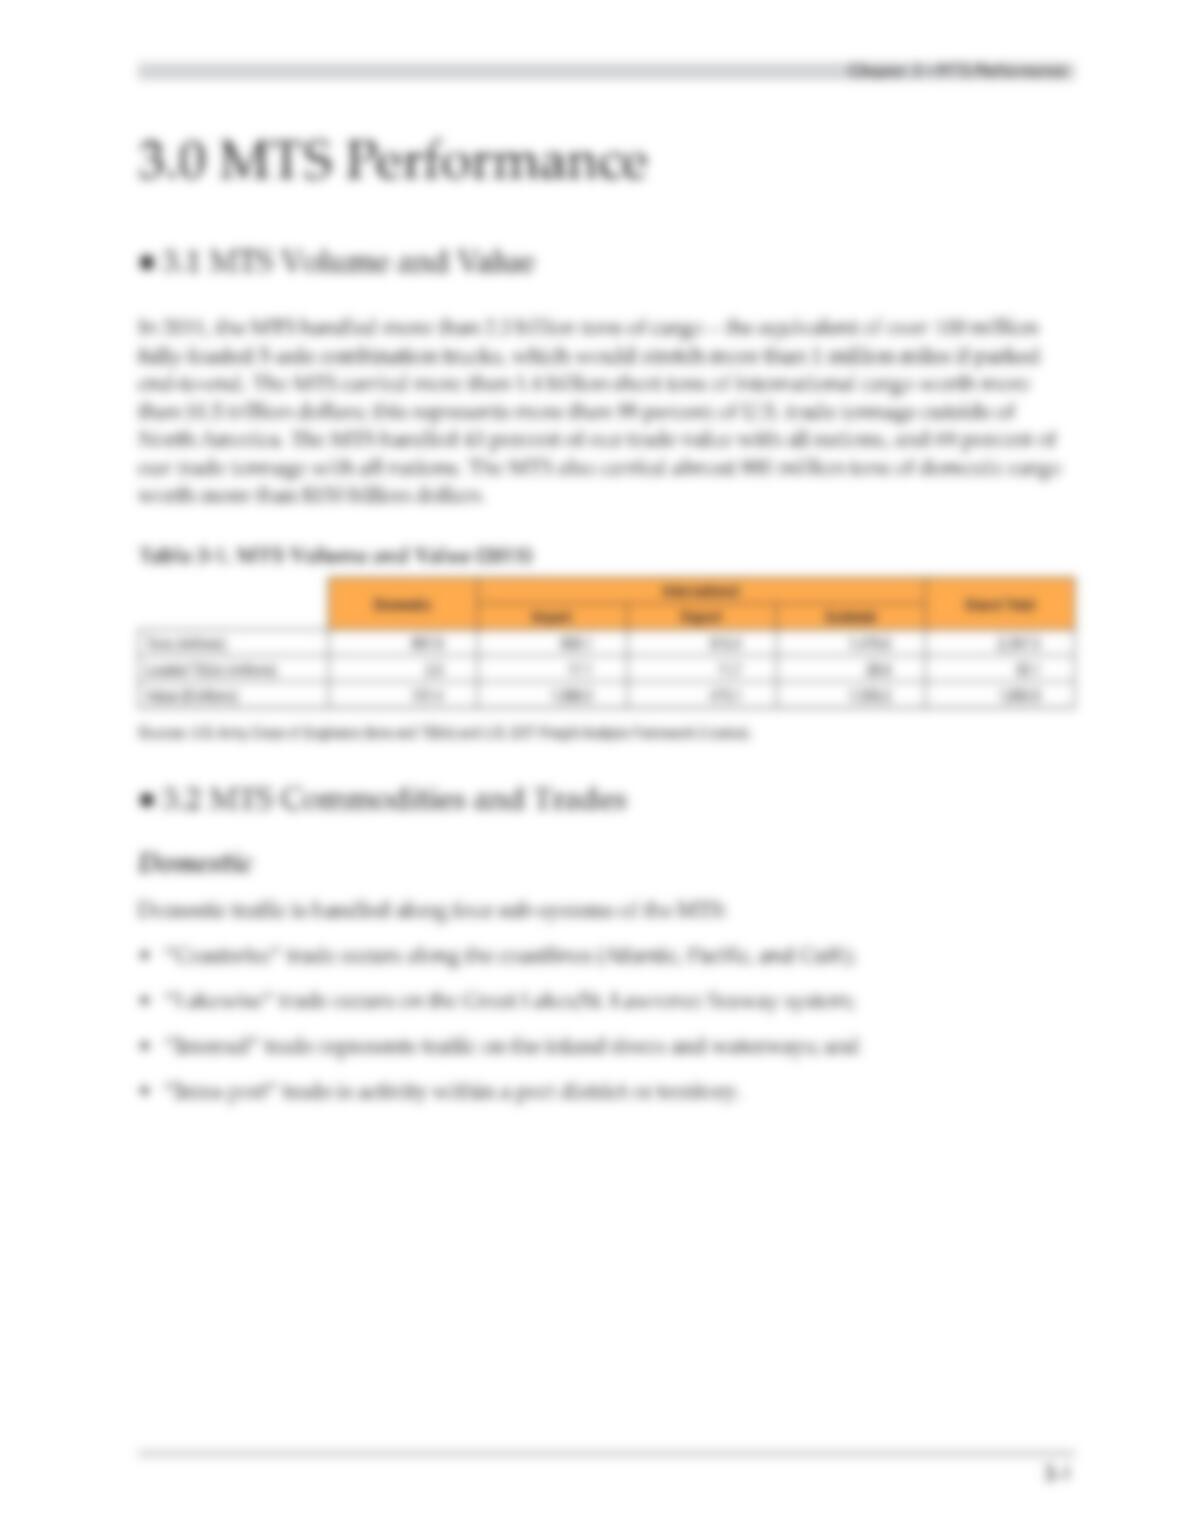
3-1. MTS Volume and Value …………………………………………………………….3-1
3-2. MTS Domestic Freight Tonnage by Commodity ………………………………………….3-2
4-1. MTS Share of U.S. Export Tons and Value ………………………………………………4-2
4-2. MTS Share of U.S. Export Tons and Value ………………………………………………4-3
4-3. Summary of Available MTS Economic Impact Estimates ……………………………………4-5
4-4. Fuel Consumption and Emissions Factors ………………………………………………4-9
4-5. Environmental Impacts of Moving MTS Ton-Mileage via Other Modes ……………………….4-10
5-1. Construction Project Planning and Implementation Process …………………………………5-5
5-2. Army Corps of Engineers FY 2012 Funding Sources ………………………………………5-6
5-3. Recent TIGER Awards for MTS Projects ………………………………………………..5-8
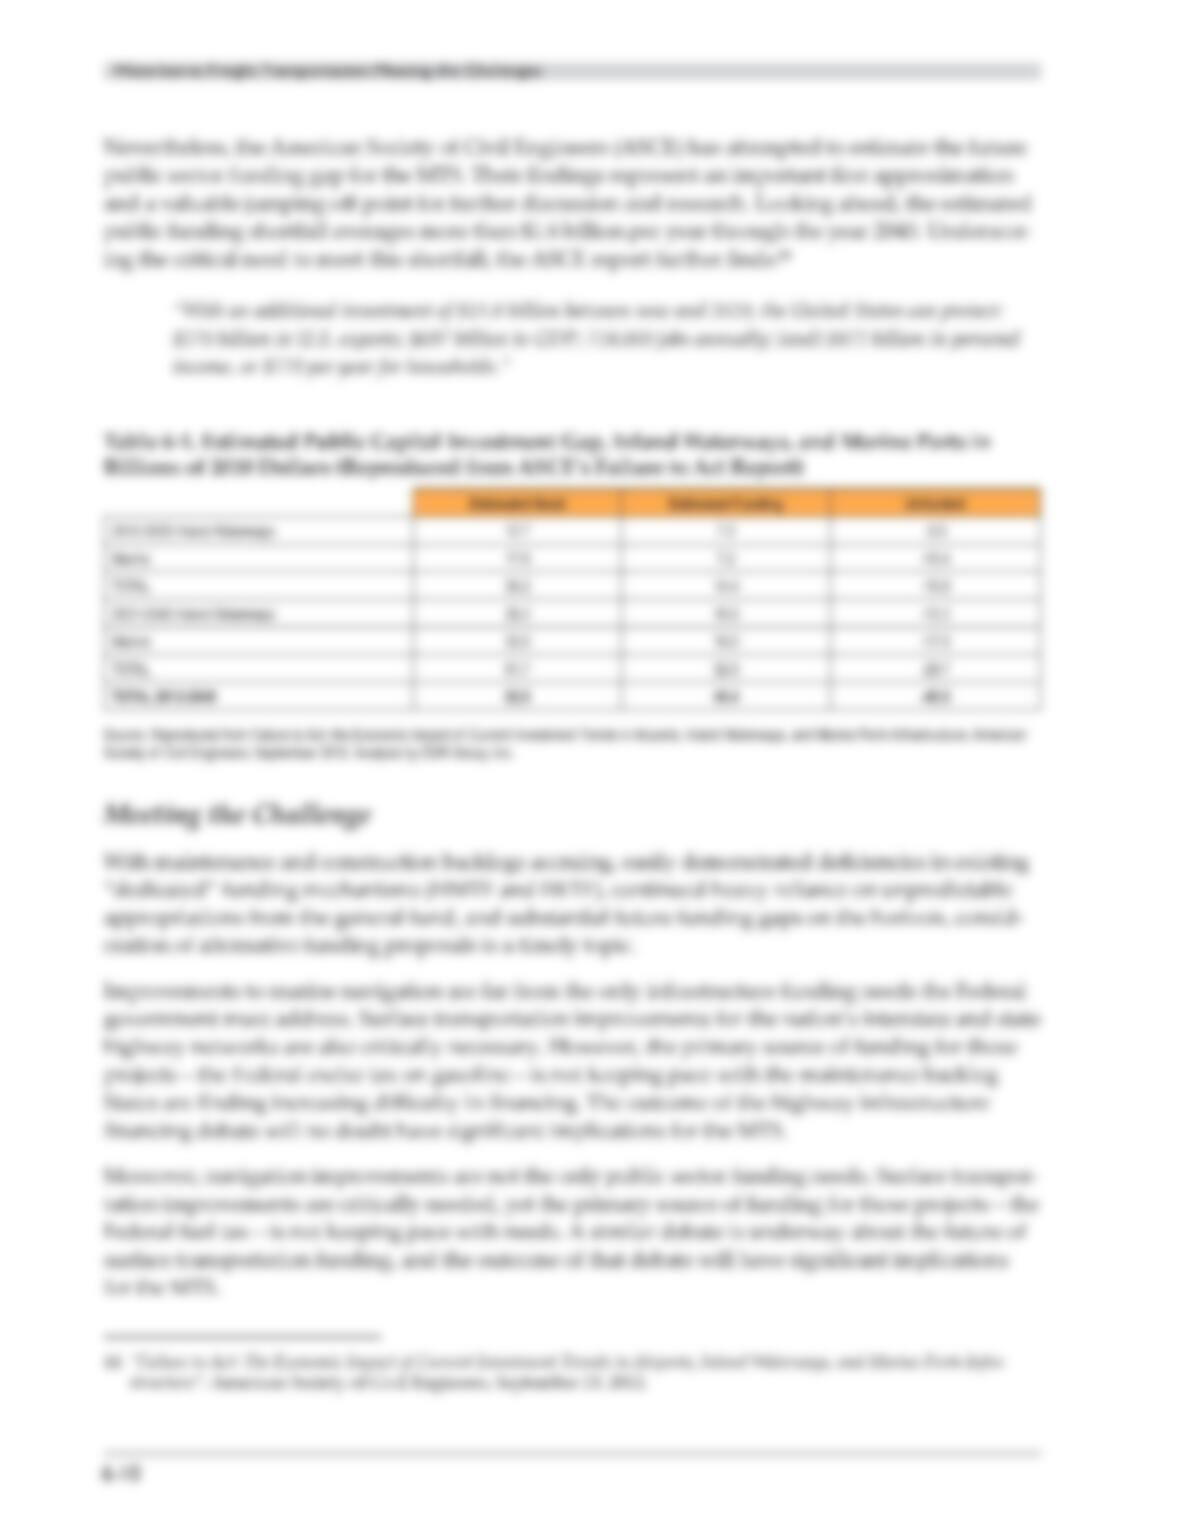
6-1. Estimated Public Capital Investment Gap, Inland Waterways and Marine Ports ………………..6-10
7-1. Summary of Recommendations ………………………………………………………7-3

h
Waterborne Freight Transportation: Meeting the Challenges
List of Figures
1-1. Top 20 U.S. Cities by Population Rank …………………………………………………1-2
1-2. Tonnage Entered through U.S. Ports …………………………………………………..1-3
1-3. Top 20 U.S. Cities by Population Rank in the Rail Era ……………………………………..1-4
1-4. Top 20 U.S. Cities by Population Rank in the 2010 Census ………………………………….1-5
2-1. MTSNAC/CMTS Definition of the MTS ………………………………………………..2-1
2-2. Commercial MTS Cargo Facilities …………………………………………………….2-3
2-3. Examples of Different Marine Cargo Handling Types and Terminals ………………………….2-5
2-4. Location and Draft of MTS Waterways …………………………………………………2-7
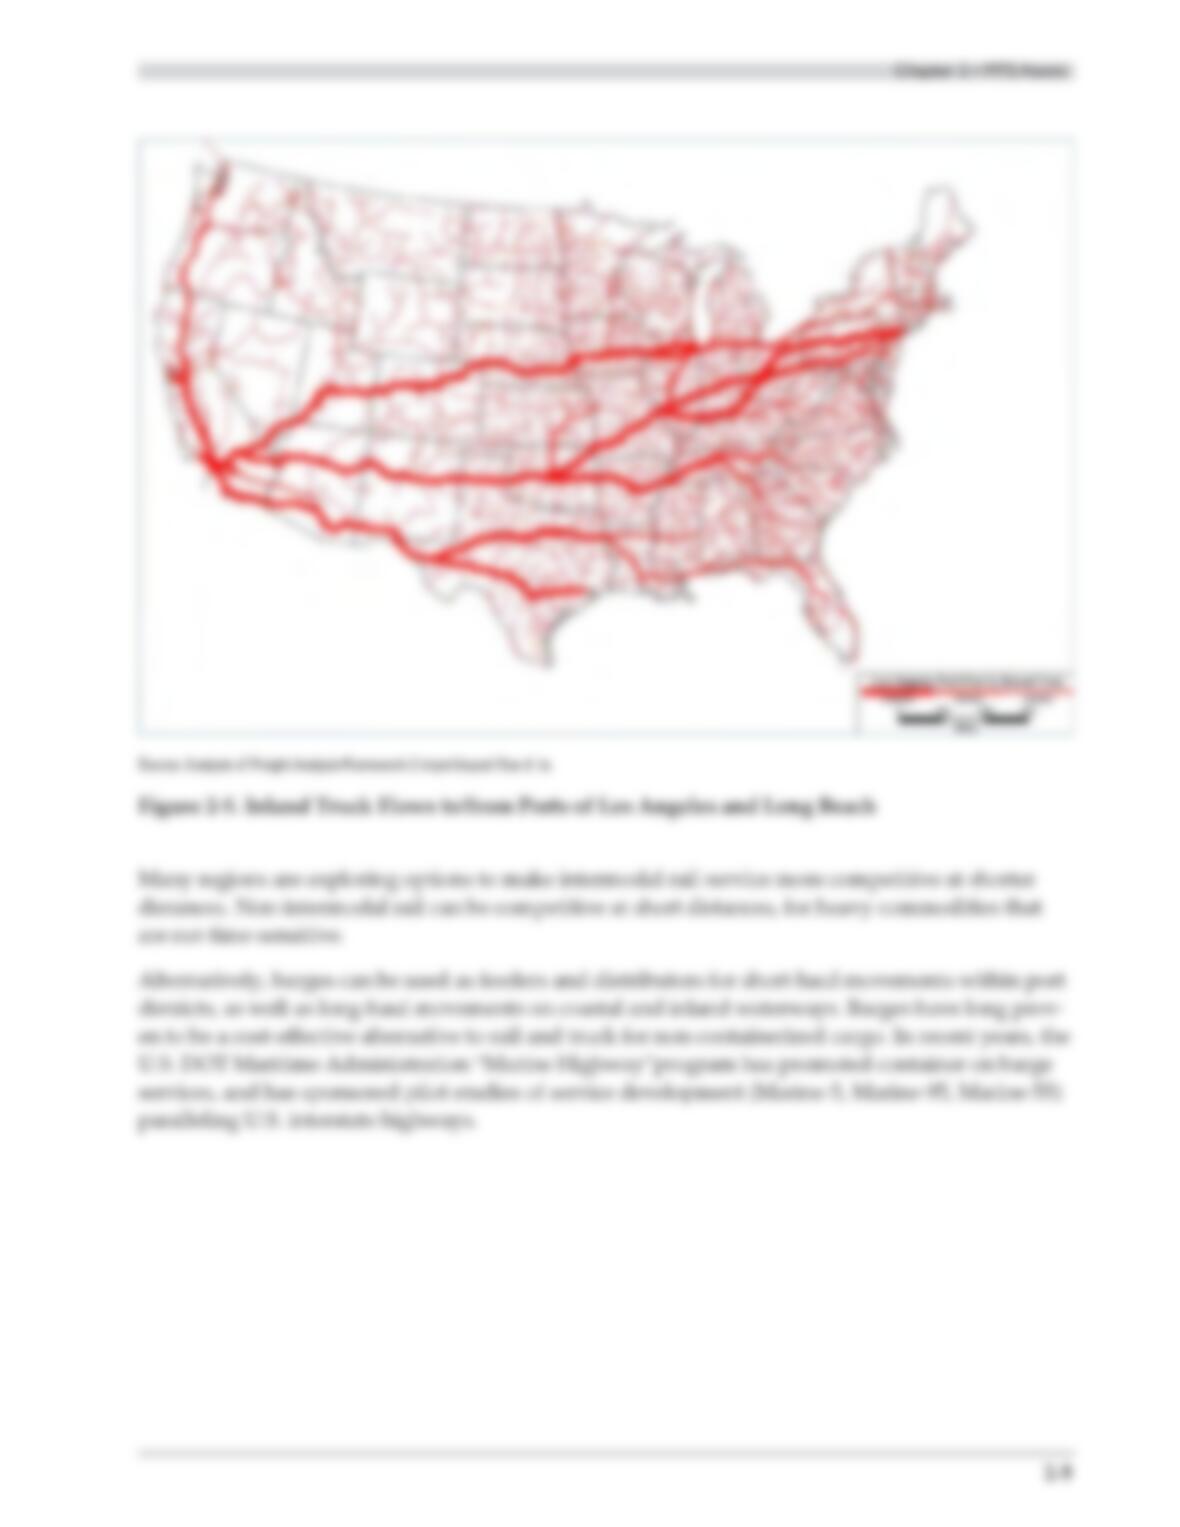
2-5. Inland Truck Flows to/from Ports of Los Angeles and Long Beach ……………………………2-9
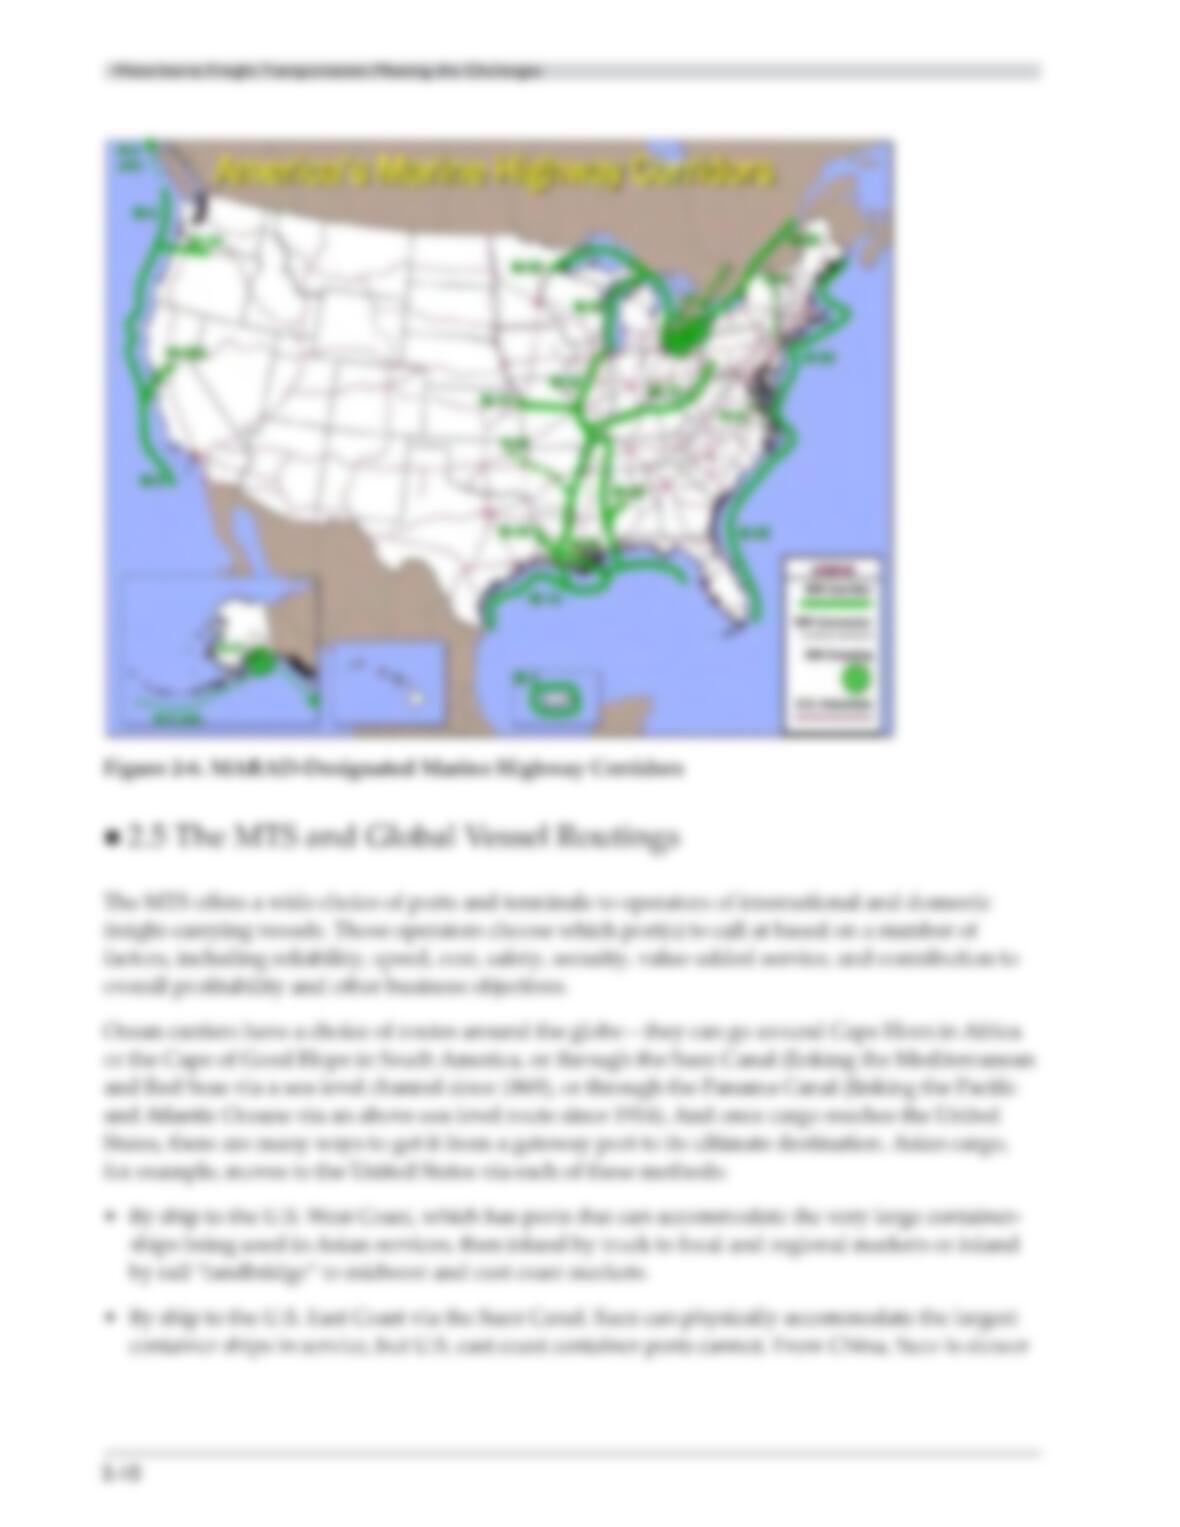
2-6. MARAD-Designated Marine Highway Corridors ……………………………………….2-10
3-1. MTS Domestic Freight Tonnage by Sub-System ………………………………………….3-2
3-2. MTS Domestic Freight Value by Commodity …………………………………………….3-3
3-3. MTS Domestic Freight Tonnage by State ……………………………………………….3-4
3-4. MTS Import Freight Tonnage by Commodity ……………………………………………3-5
3-5. MTS Export Freight Tonnage by Commodity ……………………………………………3-5
3-6. Net MTS Import and Export Tonnage by Commodity ……………………………………..3-6
3-7. MTS International Freight Value by Commodity …………………………………………3-6
3-8. MTS International Freight Tonnage by State …………………………………………….3-7
3-9. MTS Export Tons and Value by Trade Region ……………………………………………3-8
3-10. MTS Import Tons and Value by Trade Region …………………………………………..3-9
3-11. MTS Tonnage ………………………………………………………………….3-10
3-12. U.S. Container Traffic …………………………………………………………….3-11
3-13. TEU Trade for Selected Countries …………………………………………………..3-12
3-14 MTS Tonnage Projections Through 2040 ………………………………………………3-13
3-15. MTS Import and Export TEU Projections Through 2037 ………………………………….3-14
4-1. Vessel Capacity Equivalents …………………………………………………………4-6
4-2. Projected Truck Network Congestion ………………………………………………….4-7
4-3. Projected Freight Rail Network Congestion ……………………………………………..4-8
5-1. Organizational Structure of the CMTS …………………………………………………5-3
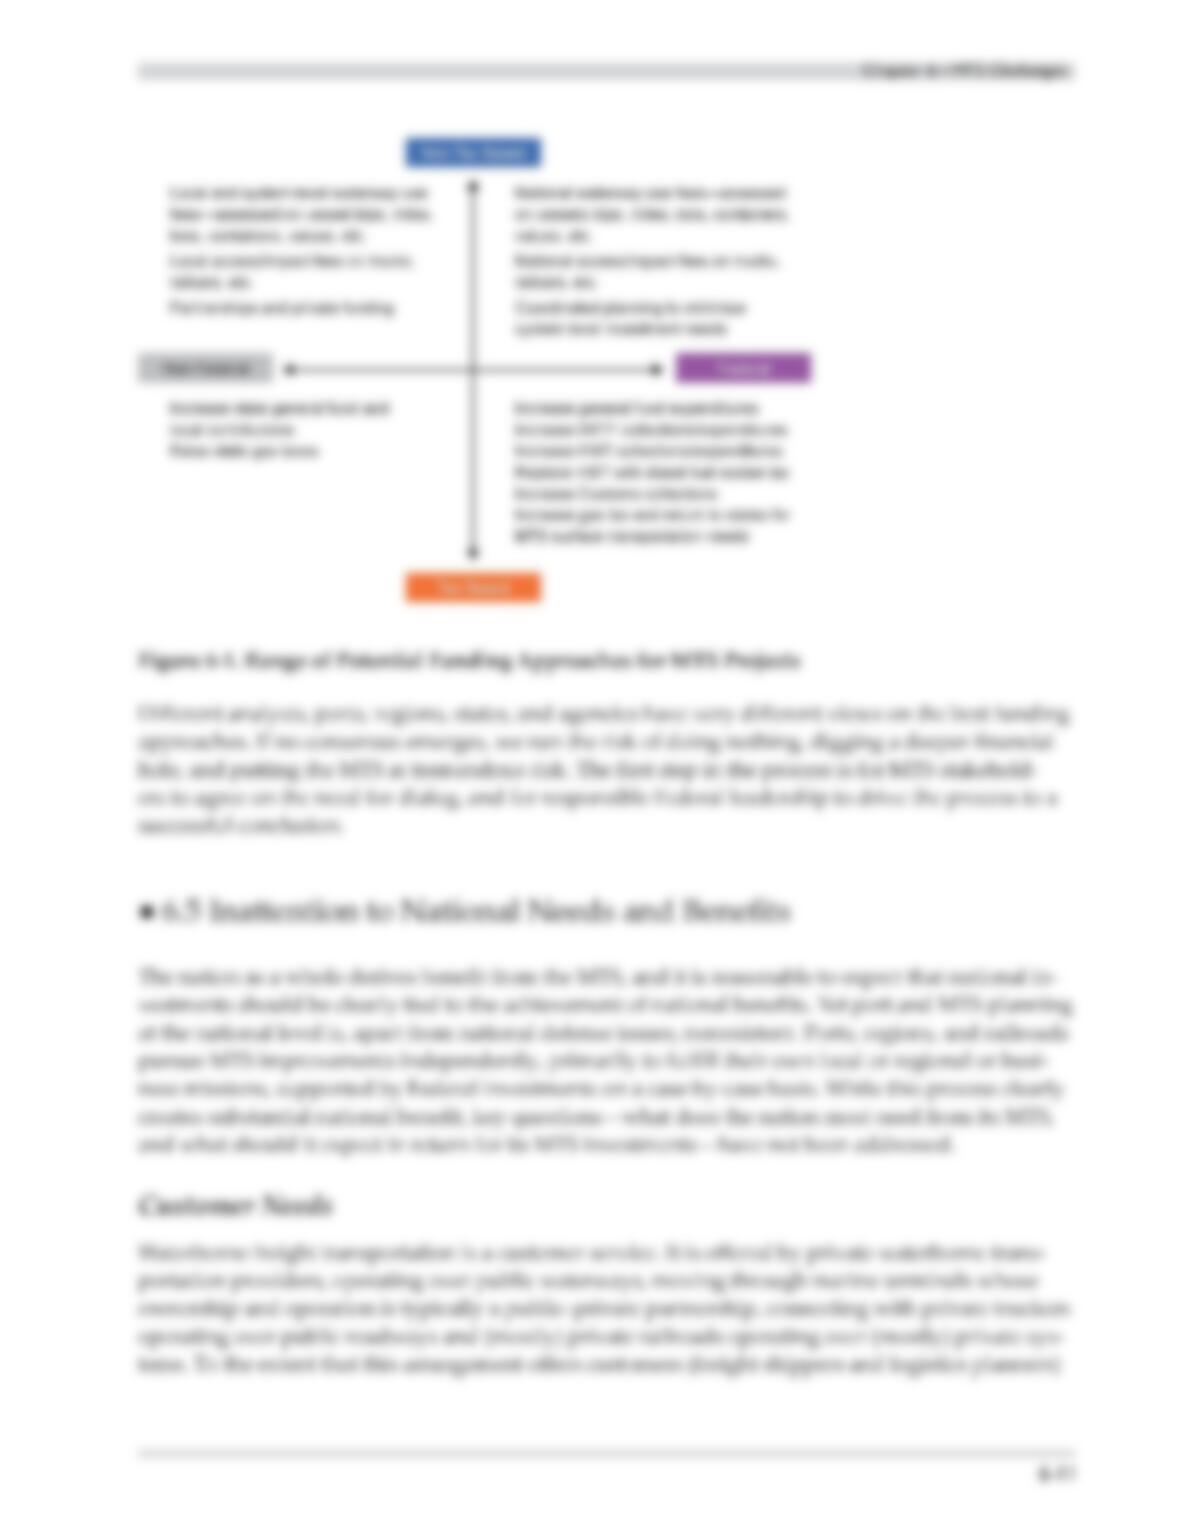
6-1. Range of Potential Funding Approaches for MTS Projects …………………………………6-11
6-2. Evolution of the Containership ……………………………………………………..6-14

i
Foreword
The AASHTO Waterborne Freight Transportation Bottom Line Report presents a comprehensive
overview of the United States marine transportation system. It documents the importance of the
MTS—ports on three coasts, the Great Lakes, and the inland waterways—to the strength and
competitiveness of the nation’s economy. The report details the challenges the system faces; and, it
offers options to increase investment and better manage the MTS.
The Report attempts to answer the following questions:
• What is the marine transportation system?
• Why is the marine transportation system important?
• What are the threats to the continued performance of the marine transportation system?
• What are the alternatives to address these challenges?
AASHTO commissioned the Waterborne Freight Transportation Bottom Line Report because the
navigable waterways in 38 of the 50 states provide substantial economic benefits to the entire Unit-
ed States. State Departments of Transportation recognize the significant role the nation’s marine
transportation assets play in terms of freight mobility as well as recognize that adverse effects for
highways should waterborne freight be diverted.
As important as it is to understand how the marine transportation system works, it is equally neces-
sary to understand the consequences of a marine transportation system that does not work.
Decisions made by the private sector, the Federal Government, and AASHTO members will deter-
mine how the national marine transportation system can reach its optimal potential as a premier
mode of freight transportation in the coming decades. The time for action is now.
Along with highways, freight railroad networks and airborne cargo, the marine transportation sys-
tem is a part of an overall national freight transportation system that must work together to ensure
the United States remains a global economic leader.
AASHTO is pleased to offer this report for the use of those who are committed to ensuring the Unit-
ed States has the best transportation system in the world.
Sean T. Connaughton
Secretary of Transportation
Commonwealth of Virginia
Chair, AASHTO Standing
Committee on Water Transportation
Bud Wright
Executive Director
AASHTO

ii
Waterborne Freight Transportation: Meeting the Challenges
Acknowledgements
This report is the result of the efforts of many people. It was initiated by the
AASHTO Standing Committee on Water Transportation (SCOWT), which is
chaired by Sean T. Connaughton, Secretary of Transportation for the Com-
monwealth of Virginia. Secretary Connaughton provided the leadership and
determination that made the report possible and guaranteed its quality. At
critical junctures, SCOWT’s Vice-Chair Sharon Balfour, Marine and Rail Ad-
ministrator for the Louisiana Department of Transportation and Development,
contributed her energy, enthusiasm, and wide experience to the process.
In addition, many other SCOWT members commented on drafts of the report
and provided material that is included. SCOWT member states demonstrated
their belief in the importance of this report through funding commitments that
provided necessary resources.
The report was prepared under a contract with Cambridge Systematics, Inc.,
by a consulting team led by Alan Meyers, Principal.
A number of knowledgeable professionals were consulted, including repre-
sentatives of the United States Army Corps of Engineers, United States De-
partment of Transportation and its Federal Highway, Rail and Maritime Ad-
ministrations, the American Association of Port Authorities, and the National
Waterways Conference, who provided valuable advice and input on the scope
and direction of the investigation. Their contributions are much appreciated
but they should not be held responsible for any of the report’s findings or ac-
tion alternatives.

iii
Executive Summary
From the initial settlement of North America, through colonization and expansion, and to the present day, where
and how we live has been determined in large part by waterborne transportation. Today, the United States relies
on its Marine Transportation System, or MTS, for access to global markets and global products, and for domestic
goods movement as an alternative to congested surface transportation.
The MTS includes facilities on three coasts, the Great Lakes, and the Inland Waterways; it serves every state, either
directly by water or indirectly via highway and rail connections; and it supports trillions of dollars in U.S. eco–
nomic activity annually. The MTS evolved as a decentralized system comprised of many different stakeholders and
responsible entities, with funding coming from a variety of public and private sources.
By many measures, the MTS is a great success; it has recovered from the recent recession and is handling near-re–
cord freight volumes. But looking forward, the MTS faces critical challenges: decades of insufficient system main–
tenance, which have left many parts of the MTS inoperable or on the brink of failure; excessive delays in navigation
project delivery; inadequate and unpredictable funding for critically needed MTS improvements; lack of a national
strategy to ensure the MTS provides the greatest benefit to the nation as a whole; and the fact that no locus of
responsibility for the well-being of the MTS, and its failure or success.
To promote discussion and action, the American Association of State Highway and Transportation Officials (AAS–
HTO) commissioned this Waterborne Freight Transportation report. The report describes the nature, extent, and
critical role of the MTS, and offers a number of findings and conclusions for consideration, and possibly adoption,
by AASHTO and others.
The main finding is this: with respect to waterborne freight, “business as usual” will lead to unacceptable further
declines in MTS condition and performance, and to significant lost opportunities for our nation’s economy. A
renewed national commitment to the MTS is urgently required, along with corresponding changes in how to plan
for and fund the MTS. Options for change include: 1) Federal legislation to achieve full state-of-good-repair for
MTS waterways, guarantee full utilization of funds collected for MTS improvements, and significantly improve
the cost, speed, and reliability of MTS project delivery; 2) a new Office of Multimodal Freight, under the Secretary
of Transportation, empowered and directed to eliminate the current balkanization of MTS planning, funding, and
project delivery responsibilities, and advance sound planning and project implementation; and 3) promotion of best
practices in MTS planning and investment at the state, regional, and local levels.
Water has been, and remains, a fundamental driving force in shaping the physical and economic
development of the United States. Inland rivers and coastal routes were the continent’s primary
transportation corridors, long before there were roads. Later, improved harbors and canals were the
nation’s first improved freight corridors. Settlement patterns and industrial development naturally
followed the coasts and waterways, because they provided access to marine resources and offered
the only economically viable means of moving goods. Our first cities were port cities.
With advancing industry and technology and the rise of transcontinental railroads, the critical role
of waterways did not diminish: rather, it took on a different and enhanced importance. Railroads
built new connections between coastal and inland waterways, promoting the growth of interior
cities and fueling America’s industrial revolution. Later as the U.S. highway network developed,
iv
Waterborne Freight Transportation: Meeting the Challenges
population and production centers moved off the waterways but did not lose their need for water-
borne transportation. Truck-only local services, combined rail-truck long-haul services, and ad-
vanced logistics practices evolved to ensure these growing inland markets remained connected to
the water.
Today, America’s “Marine Transportation System” (MTS) remains a critical element of our domestic
transportation infrastructure and our primary gateway for global trade. The MTS includes naviga-
ble waterways and public and private ports on three coasts (Atlantic, Pacific, and Gulf), the Great
Lakes, and inland waterways. It also includes, by extension, the use of inland highway and rail
connections that connect ports with inland markets, ensuring access to the water for shippers and
receivers in all 50 states. The MTS includes 8,197 cargo-handling docks, 179 ports handling more
than 250,000 tons annually, and 52 ports handling containers.
Table ES-1. MTS Volume and Value, 2011
• Great Lakes. “Great Lakes–St. Lawrence Seaway shipping is one of the key drivers of the U.S.
and Canadian economies. The industry creates 227,000 jobs in the two countries, and produces
business revenues of $35 billion… It also supports the economic health of North America’s in–
dustrial heartland and a consumer market of more than 100 million people. To keep their busi-
nesses running, U.S. and Canadian electric utilities, steel mills, construction companies, mining
companies, manufacturers, and farmers all depend on the 164 million metric tons of cargo deliv-
ered by Great Lakes vessels every year. These cargoes become the automobiles North Americans
drive, the office buildings they work in, the energy that heats their homes, the salt that keeps
roads safe, and the food they put on the dinner table. Marine transportation on the Great Lakes–
Seaway System provides $3.6 billion (U.S.D) in annual transportation cost savings compared to
the next least expensive all-land transportation alternative. This enhances the global competitive-
ness of North American products and industries and keeps the cost of consumer goods down.”1
• Inland Waterways. “In 2006, Ohio River Basin commercial navigation users saved $3.1 billion by
using the Ohio River System (ORS) waterway to ship coal, steel, chemicals and other commodi-
ties by barge. For the entire U.S. inland river system, using an estimated $10–$12 per ton shipper
savings, national transportation shipper savings would be in the neighborhood of $7.0 billion…