RESEARCH ARTICLE
Race, Neighborhood Economic Status,
Income Inequality and Mortality
Nicolle A Mode*, Michele K Evans, Alan B Zonderman
National Institute on Aging, National Institutes of Health, Department of Health and Human Services,
Baltimore, Maryland, United States of America
*nicolle.mode@nih.gov
Abstract
Mortality rates in the United States vary based on race, individual economic status and
neighborhood. Correlations among these variables in most urban areas have limited what
conclusions can be drawn from existing research. Our study employs a unique factorial
design of race, sex, age and individual poverty status, measuring time to death as an objec-
tive measure of health, and including both neighborhood economic status and income
inequality for a sample of middle-aged urban-dwelling adults (N = 3675). At enrollment, Afri-
can American and White participants lived in 46 unique census tracts in Baltimore, Mary-
land, which varied in neighborhood economic status and degree of income inequality. A
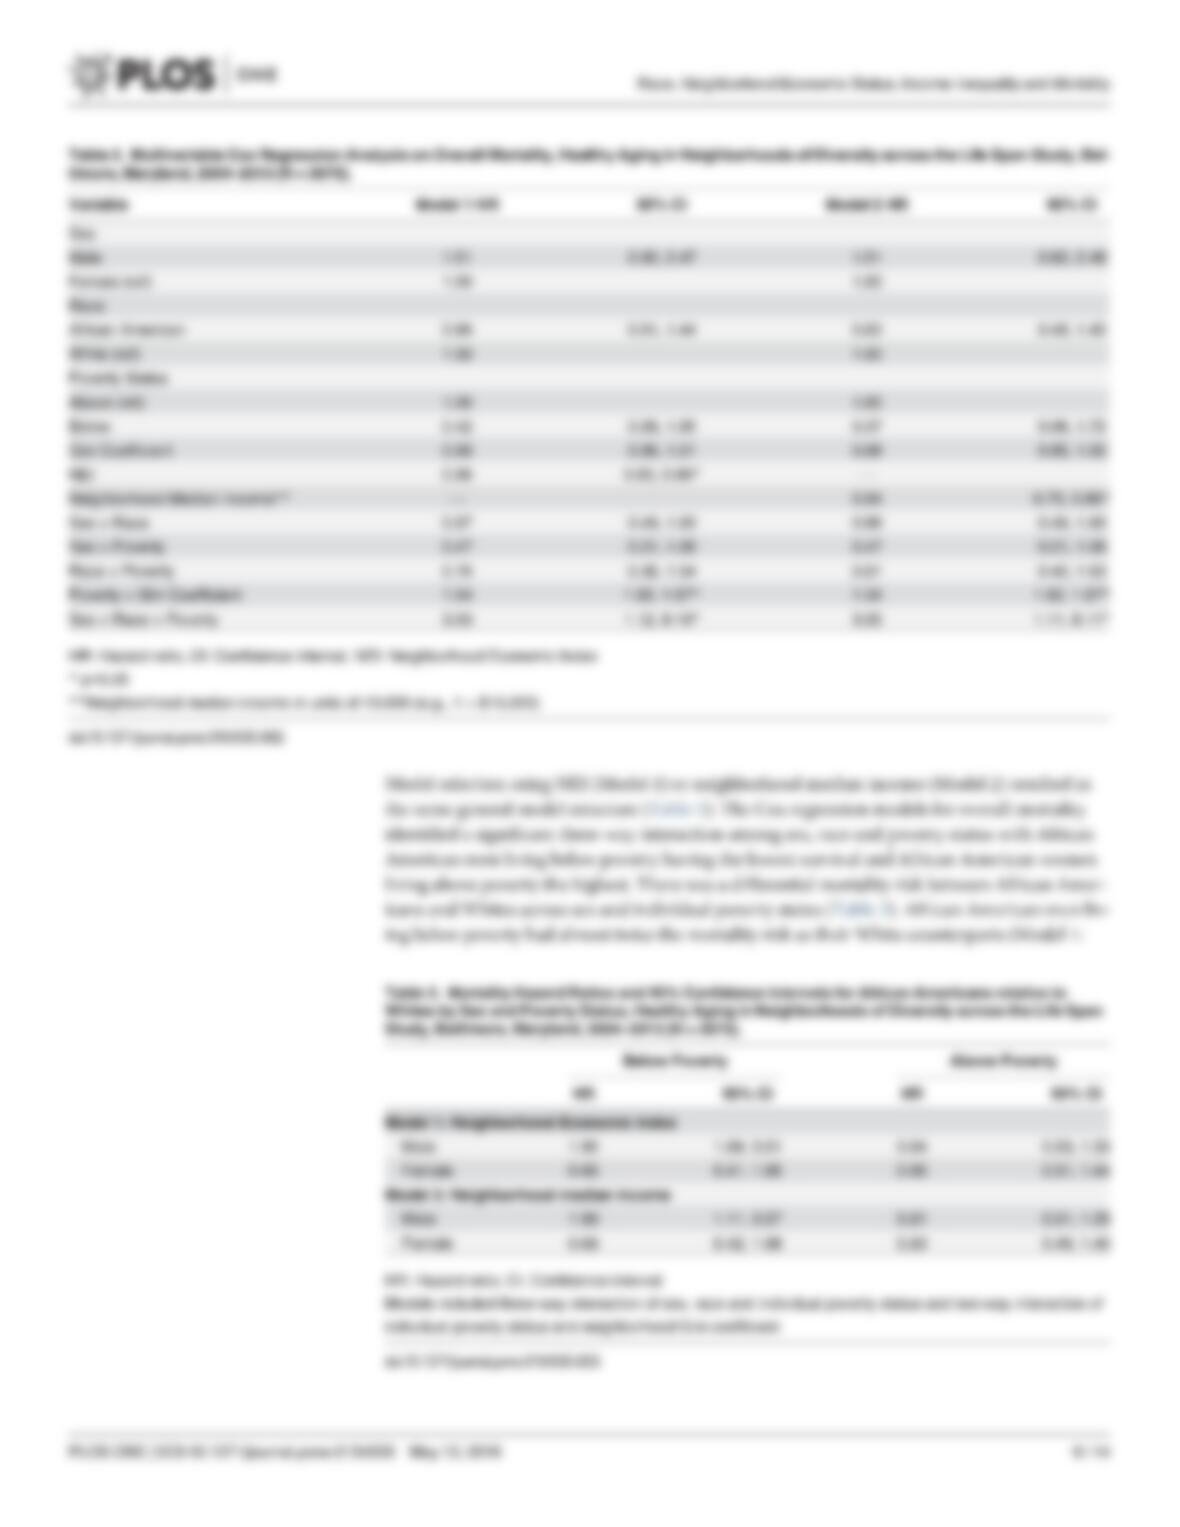
Cox regression model for 9-year mortality identified a three-way interaction among sex,
race and individual poverty status (p = 0.03), with African American men living below pov-
erty having the highest mortality. Neighborhood economic status, whether measured by a
composite index or simply median household income, was negatively associated with over-
all mortality (p<0.001). Neighborhood income inequality was associated with mortality
through an interaction with individual poverty status (p = 0.04). While racial and economic
disparities in mortality are well known, this study suggests that several social conditions
associated with health may unequally affect African American men in poverty in the United
States. Beyond these individual factors are the influences of neighborhood economic status
and income inequality, which may be affected by a history of residential segregation. The
significant association of neighborhood economic status and income inequality with mortal-
ity beyond the synergistic combination of sex, race and individual poverty status suggests
the long-term importance of small area influence on overall mortality.
Introduction
Mortality disparities across racial and economic groups in the United States (US) are well
established [1]. In 1995, African Americans had a 1.6 times greater overall mortality risk than
Whites; unchanged from the mortality disparity observed in 1950 [2]. Low socioeconomic sta-
tus (SES) is also associated with an increased mortality risk for the US population. For adults
over age 50, those in the lowest quartile of SES had 2.8 times the mortality risk as those in the
highest quartile of SES [3], and this disparity remained significant after controlling for major
risk factors (1.6 times). The influence of race and SES on mortality are difficult to parse because
PLOS ONE | DOI:10.1371/journal.pone.0154535 May 12, 2016 1/14
a11111
OPEN ACCESS
Citation: Mode NA, Evans MK, Zonderman AB
(2016) Race, Neighborhood Economic Status,
Income Inequality and Mortality. PLoS ONE 11(5):
e0154535. doi:10.1371/journal.pone.0154535
Editor: Donald R. Olson, New York City Department
of Health and Mental Hygiene, UNITED STATES
Received: October 2, 2015
Accepted: April 14, 2016
Published: May 12, 2016
Copyright: This is an open access article, free of all
copyright, and may be freely reproduced, distributed,
transmitted, modified, built upon, or otherwise used
by anyone for any lawful purpose. The work is made
available under the Creative Commons CC0 public
domain dedication.
Data Availability Statement: Data are available
upon request to researchers with valid proposals who
agree to the confidentiality agreement as required by
our Institutional Review Board. We publicize our
policies on our website https://handls.nih.gov.
Requests for data access may be sent to Alan
Zonderman (co-author) or the study manager,
Jennifer Norbeck at norbeckje@mail.nih.gov.
Funding: The Healthy Aging in Neighborhoods of
Diversity across the Life Span study is supported by
the Intramural Research Program (Z01-AG000513) of
the National Institute on Aging, National Institutes of
Health (MKE, ABZ). Support was also provided by
the National Institute on Minority Health and Health

African Americans bear a disproportionate burden of US poverty and low education. The pov-
erty rate for African Americans in the US is 26%, but it is only 10% for non-Hispanic Whites
[4]. Similarly, 15% of African Americans have less than a high school education, while 8% of
non-Hispanic Whites fall in this category [5].
The influence of economic status on overall health and mortality extends beyond the indi-
vidual to the neighborhood [6]. Place of residence in the US follows patterns of race and eco-
nomic position, often due to residential segregation [7]. While racial segregation has decreased
over the last 40 years [8], income segregation, especially for African Americans, has increased
[9]. Low neighborhood economic status has been associated with an increased risk of overall
mortality [10], and mortality from cancer [11] and cardiovascular disease [12]. Residing in
neighborhoods with the lowest economic status (lowest 20 or 25th percentile) corresponded
with a 17–26% increased risk of overall mortality after controlling for individual SES and dis-
ease risk factors [13,14]. The influence of neighborhood can be direct, through walkability or
violent crime, or indirect, through social position or discrimination. Due to the complex ways
in which neighborhood can influence health, researchers have proposed composite indices
which include multiple aspects of the neighborhood milieu (e.g., [15,16]). However, research-
ers have found similar patterns between neighborhood economic status and health using only
a single measure of poverty or median household income [17,18]. Recently, Oka [19] demon-
strated that median household income alone accounted for the same neighborhood affluence-
deprivation continuum as composite measures for four large US cities at the census tract level.
In addition to average economic levels, neighborhood influences also include income dis-
parities within neighborhoods. A number of studies have linked high income inequality with
an increase in adverse health outcomes such as overall mortality [20,21]. This has led some
authors to posit that the criteria of causal association between income inequality and health
has been reached [21]. The relative income hypothesis asserts that chronic upward compari-
sons are stressful [22] and adverse health outcomes are the result of the physical effects of
chronic stress and social sensitivity [23]. Furthermore, research has identified an interaction
between neighborhood economic status and income inequality on health. Two studies from
California found that mortality risks for residents with low-incomes were highest in high SES
neighborhoods [24,25]. This association between income inequality and health is not univer-
sally supported [26]. Quality housing, access to healthy food, effective schools and a safe envi-
ronment available in a high economic status neighborhood should benefit low income
residents in the same area. These potential benefits have provided the foundation for projects
promoting the relocation of low-income families such as Moving to Opportunity, which was
conducted in five major cities across the US [27]. The project demonstrated limited success in
reducing mortality risk factors for low-income residents who moved to more affluent neigh-
borhoods [28].
Many studies of race, individual poverty and neighborhood economic status on mortality
are limited in their conclusions due to existing correlations among these primary factors [12,
13]. Our study adds to previous work by employing a unique factorial design of race, sex, age
and individual poverty status, measuring time to death as an objective measure of health, and
including both neighborhood economic status and income inequality for a population of mid-
dle-aged urban-dwelling adults. The purpose of the current study was to identify significant
individual and neighborhood components that correlate with mortality disparities. A second-
ary aim was to compare the explanatory power of neighborhood economic status by a compos-
ite index compared to median household income.
Race, Neighborhood Economic Status, Income Inequality and Mortality
PLOS ONE | DOI:10.1371/journal.pone.0154535 May 12, 2016 2/14
Disparities, National Institutes of Health (MKE). The
funders had no role in the study design, data
collection and analysis, or preparation of the
manuscript.
Competing Interests: The authors have declared
that no competing interests exist.

Methods
Study population
The Healthy Aging in Neighborhoods of Diversity across the Life Span (HANDLS) study is a
prospective longitudinal cohort study of 3720 socioeconomically diverse African American
and White adults initially 30–64 years old. Participants were selected using an area probability
sample from thirteen local communities in Baltimore, Maryland, during 2004–2009. The local
communities were chosen to span diverse levels of income and socioeconomic status and pro-
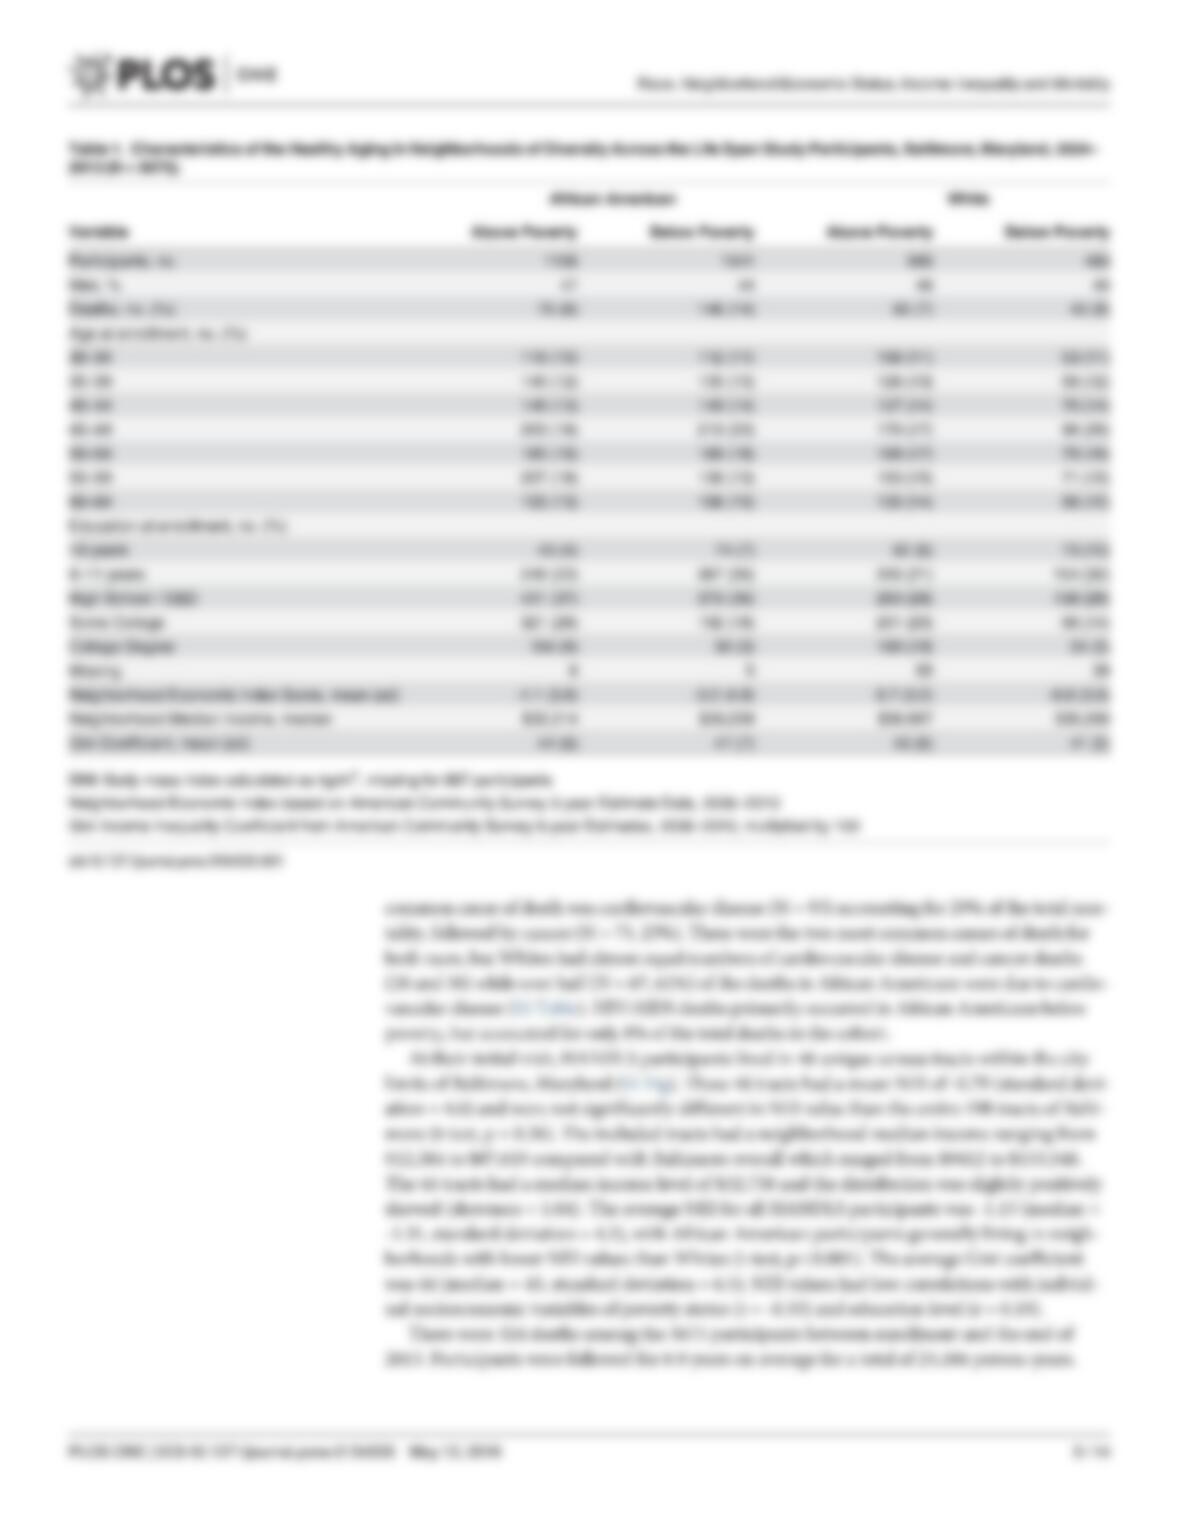
vide a representative distribution of Baltimore residents. Participants were 30–64 years old at
enrollment, and selected based on a factorial crossed design of sex, race, 5-year age group, and
poverty status (above/below 125% of the federal poverty guidelines based on household size).
The factorial design allows analysis of the separate and combined associations of sex, race, and
poverty status on health outcomes [29]. Participants were limited to those who self-identified
as either non-Hispanic Black/African American or non-Hispanic White/Caucasian. Enroll-
ment dates were similar for both races, with a median start date of August 2006 for African
American participants and December 2006 for White participants. For this study, 43 partici-
pants were excluded who provided addresses that could not be geocoded accurately as were
two participants who had permanent addresses just outside the Baltimore City limits, resulting
in a study sample of 3675 people. Detailed descriptions of the protocol and methods have been
previously published [30]. Approval for data collection was obtained from the National Insti-
tutes of Health, National Institute of Environmental Health Sciences Institutional Review
Board. All participants provided written informed consent.
Mortality information
Participants were followed prospectively via matching to National Death Index data (NDI;
National Center for Health Statistics, Centers for Disease Control and Prevention). Individual
data for matching included name, date and state of birth, sex, race, maiden name, and social
security number. Minimal loss of follow-up was expected because 94% of the participants pro-
vided a social security number, and participants were actively contacted for follow-up visits
throughout the study period. NDI data were available from the date of HANDLS enrollment
(August 2004–March 2009) through December 31, 2013, providing up to 9 years of follow-up
(mean and median of 6.9 years). Details included date of death and primary cause (Interna-
tional Classification of Disease 10th revision).
Neighborhood-level information
The entire city of Baltimore, Maryland was included with census tracts used as small areas fol-
lowing the 2010 Census definitions. Census tracts include 4000 residents on average and are
adequately sized for detecting spatial gradients and trends over time in overall mortality [17].
Data for each tract came from the American Community Survey (ACS) 5-year estimate files:
2006–2010 (referred to as 2010) and 2009–2013 (referred to as 2013). Nineteen variables previ-
ously identified as related to health outcomes were selected to cover seven domains of social
condition and relative socioeconomic disadvantage: education, employment, housing, occupa-
tion, poverty, residential stability and financial security. These variables formed the list for pos-
sible inclusion in a neighborhood index (S1 Table). The Gini coefficient [31] from the ACS
2010 file was used as the measure of income inequality for each census tract. For this study, the
percent Gini was used (Gini 100) and thus values range from 0 (equal incomes) to 100 (all
income held by one person). The percent Gini was used so model coefficients would describe
the result of a 1% increase in Gini value.
Race, Neighborhood Economic Status, Income Inequality and Mortality
PLOS ONE | DOI:10.1371/journal.pone.0154535 May 12, 2016 3/14
Index development: Neighborhood Economic Index (NEI)
The 19 selected neighborhood-level variables were included in a principal component analysis
(PCA) to select a set of variables for the index (see S1 Appendix). Retained standardized vari-
ables were summed to create the index value without individual weights for greater consistency
over time, with low values indicating low neighborhood economic level. Internal reliability was
assessed by Cronbach’s alpha with values greater than 0.90 indicating high reliability [32].
Polyserial correlations [33] of the neighborhood index with poverty status and education level
assess the level of redundancy between the index and individual socioeconomic indicators.
Statistical analyses
Cox proportional hazards models were used to estimate mortality hazard ratios (HR) and their
Wald 95% confidence intervals (CI). Exact age at entry and exit of the study were used as the
measurement of time for the models [34]. Enrollment in HANDLS was entry into the study and
exit was date of death or December 31, 2013, whichever occurred first. Backward variable selec-
tion was performed using likelihood ratio tests to identify significant interactions and build the
final model. Main effects of sex, race and poverty status were included aprioribased on the
design of the study and not removed during variable selection. Models were built separately
using the NEI (Model 1) and neighborhood median income (Model 2), and Akaike information
criterion (AIC) values were compared between the two resulting models. The assumption of pro-
portionality was assessed by inspection and testing of the Schoenfeld residuals [35].
All analyses were performed in the R program [36] version 3.1.3 except for estimated interac-
tion HRs which were calculated in SAS/STAT software version 13.2 (SAS Institute Inc., Cary
NC). All p-values are two-tailed and values less than 0.05 were considered statistically significant.
Race, Neighborhood Economic Status, Income Inequality and Mortality