FINM7403, Seminar 1
Financial Statement Analysis
Course Learning Objective(s) 1, 5
Necmi K Avkiran, PhD
Associate Professor in Banking and Finance
UQ Business School
n.avkiran@business.uq.edu.au
http://www.users.on.net/~necmi/financesite/profile.htm

The relevance of financial information
Financial statement analysis provides investors with tools necessary
for evaluating risk and expected return.
Over extended time periods, earnings figures can explain up to 60% of the
variation in share prices.
If you forecast earnings accurately and perform an appropriate valuation
based on those forecasts, portfolios formed using those valuations should
outperform the market.
In fact, researchers have found evidence of this potential outperformance.
Investors use financial statement analysis to assess growth,
profitability, efficiency, and the risk of financial distress through
comparison over time and with industry competitors.
2

Financial Statements
Financial statement analysis can be used to discover mispriced
securities.
Income Statement:
Profitability over time
Balance Sheet:
Financial condition at a point in time
Statement of Cash Flows:
Tracks the cash implications of transactions.
3

Income Statement
Presents revenue generated during the operating period
Expenses incurred during the same period
Reports company’s net earnings or profits
Expenses:
Cost of goods sold, directly attributable to what are produced
General and admin expenses, overhead expenses, salaries etc
Interest expense
Taxes
Common-size income statement, where each account is expressed as
a percentage of the value of sales
Financial accounting data are widely available; however, accounting
earnings and economic earnings are not always the same.
Economic earnings are sustainable cash flows that would not impair
productive capacity, whereas accounting earnings are affected by
conventions regarding valuation of assets
4
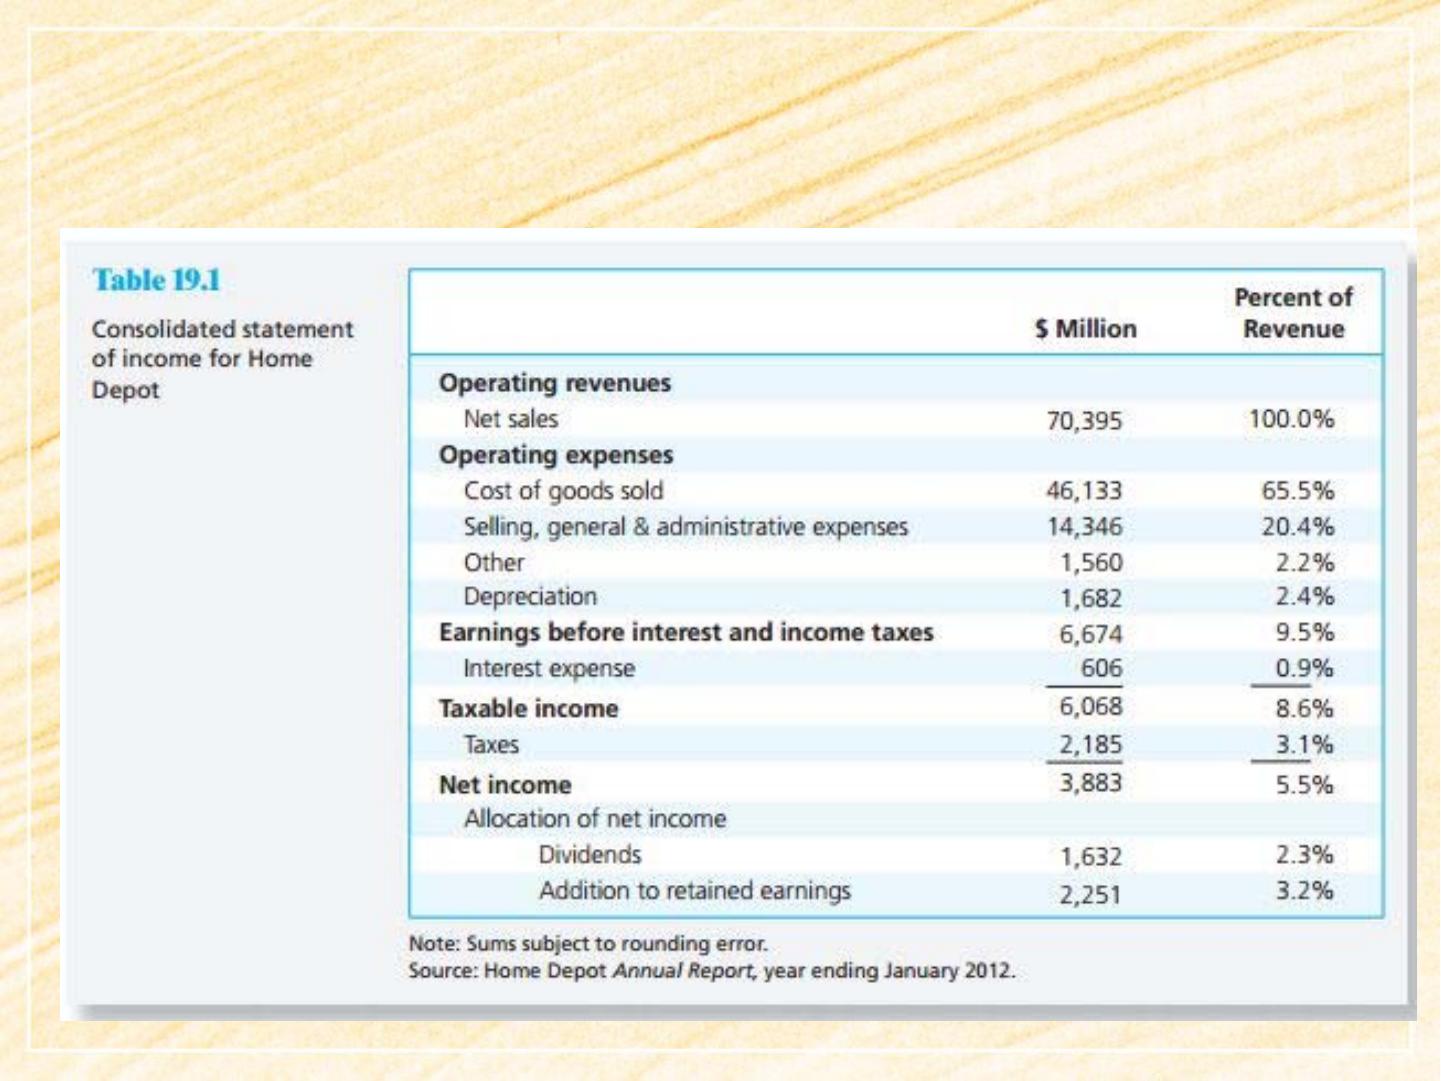
Table 19.1 Consolidated Statement of Income for
Home Depot, 2012
5

Balance Sheet
Snapshot of the financial condition of the firm
Lists assets and liabilities
Difference between assets and liabilities is the net worth of the firm, or
shareholder’s equity
Assets:
Current assets: cash, accounts receivable, items that can be converted into
cash within 1 year
Long-term assets or fixed assets
Tangible assets: buildings, plants, etc
Intangible assets: goodwill, etc
Liabilities:
Current liabilities: due within one year
Long-term debt and other liabilities: due over more than 1 year
6
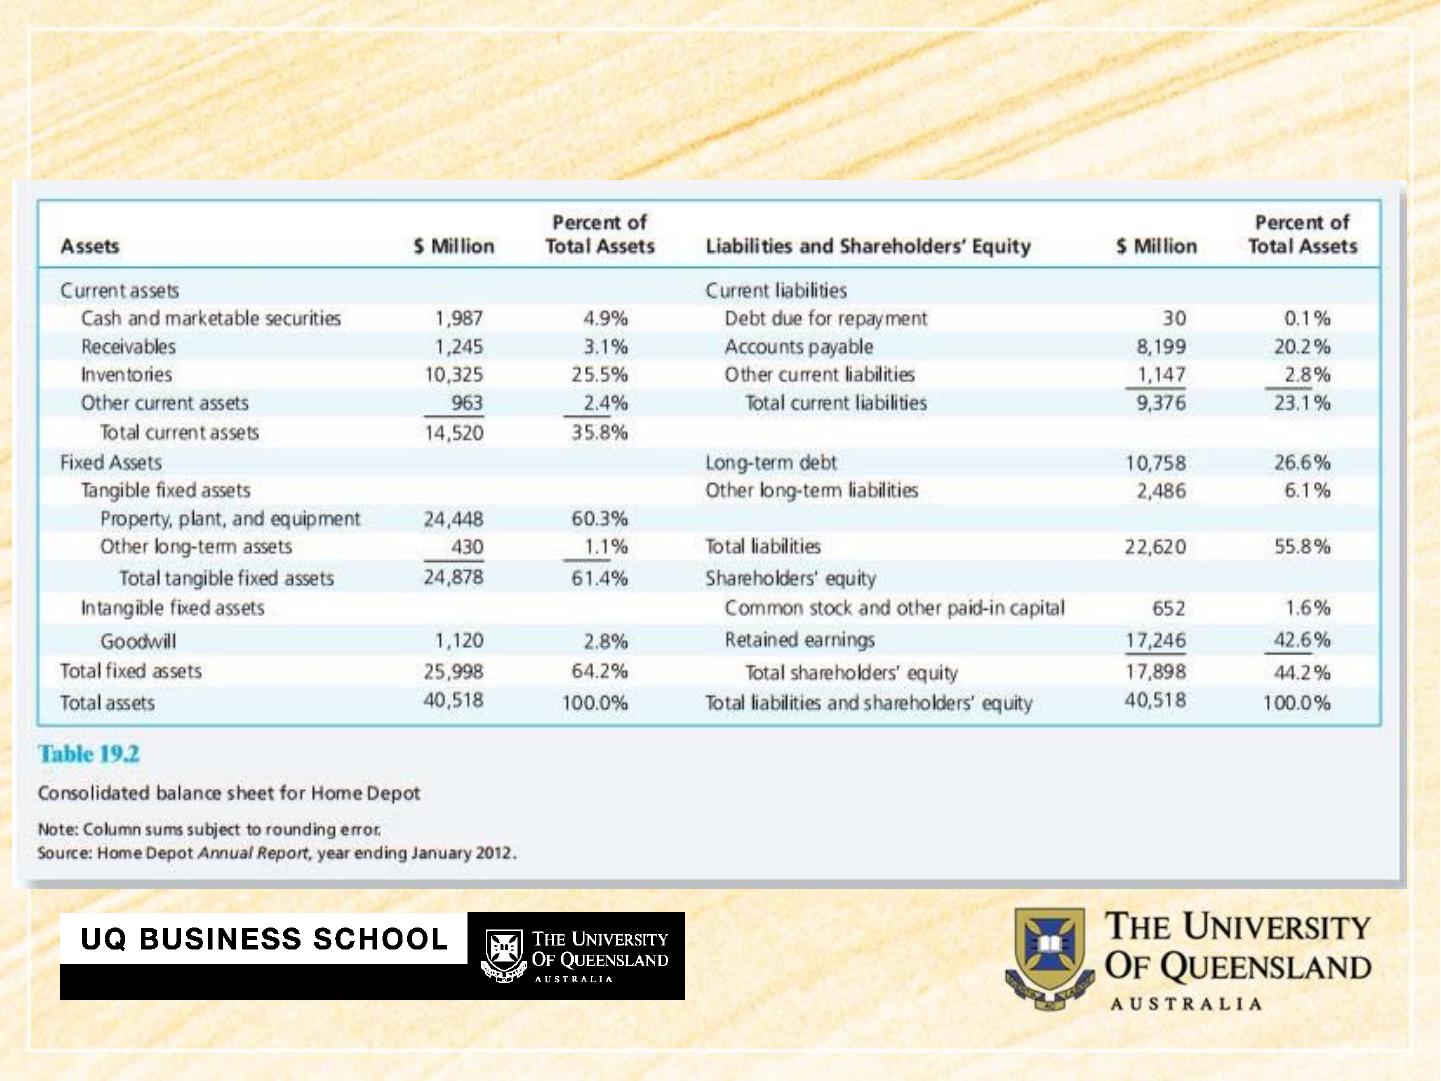
Table 19.2 Consolidated Balance Sheet for Home
Depot, 2012
7

Cash flow statement
Tracks the cash implications of transactions
Cash from operations, plus adjustments
Depreciation
Changes in working capital
Cash flows from investments
Cash flows from financing activities
Provides important evidence on the well-being of a firm
8
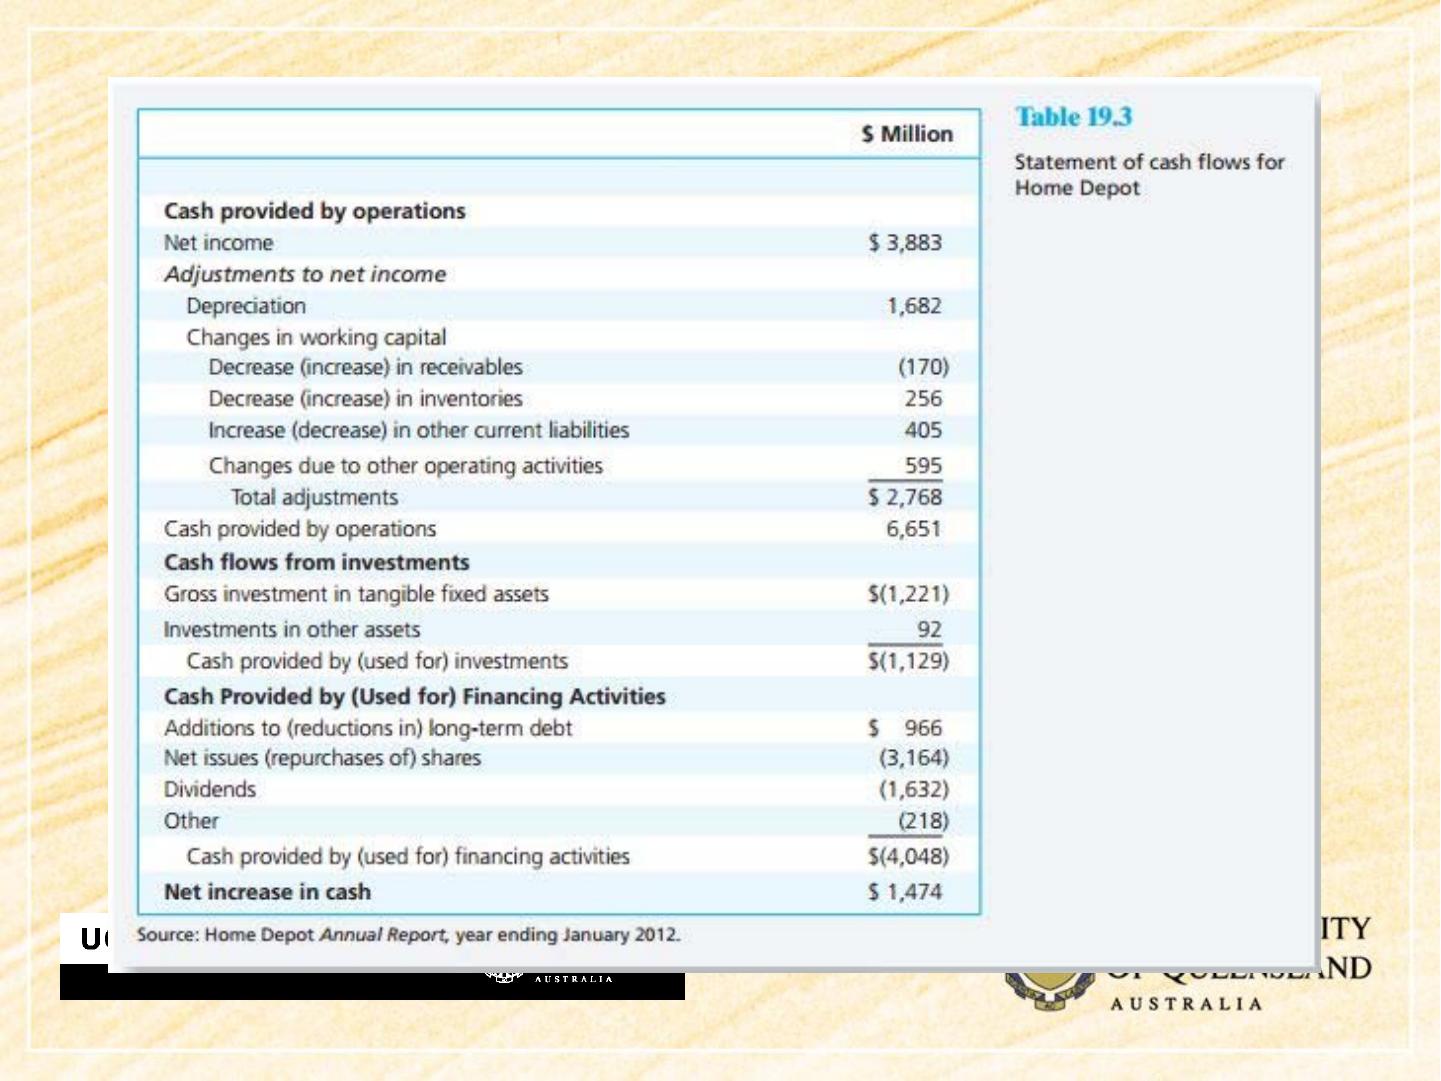
Table 19.3 Statement of Cash Flows for Home Depot, 2012
9
Summary: 3,883+2,768-1,129-4,048 = 1,474

Ratios
Ratios are a useful way of expressing relationships between financial
data.
Extensive academic research has examined the importance of ratios in
predicting stock returns or credit failures.
Practitioners routinely use ratios to derive and communicate the value of
companies and securities.
Example:
Firm A – net profit: $100,000 Firm B – net profit: $200,000
Both generate revenue of $1mil
Which firm is more profitable?
N
et income
Net profit margin Revenue
100,000 0.1
1,000,000
200,000 0.2
1,000,000
Firm A
Firm B
10

Ratios
Accounting numbers in isolation convey little meaning.
Please note when using ratios
What happened but not why it happened
Differences in accounting policies can distort ratios
Not all ratios are relevant
Computation alone is not enough, INTERPRETATION is essential
Only relative financial ratios are relevant. Compare the firm’s
performance to:
The aggregate economy;
Its industry;
Its major competitors within the industry; and
Its past performance (time-series analysis)
11
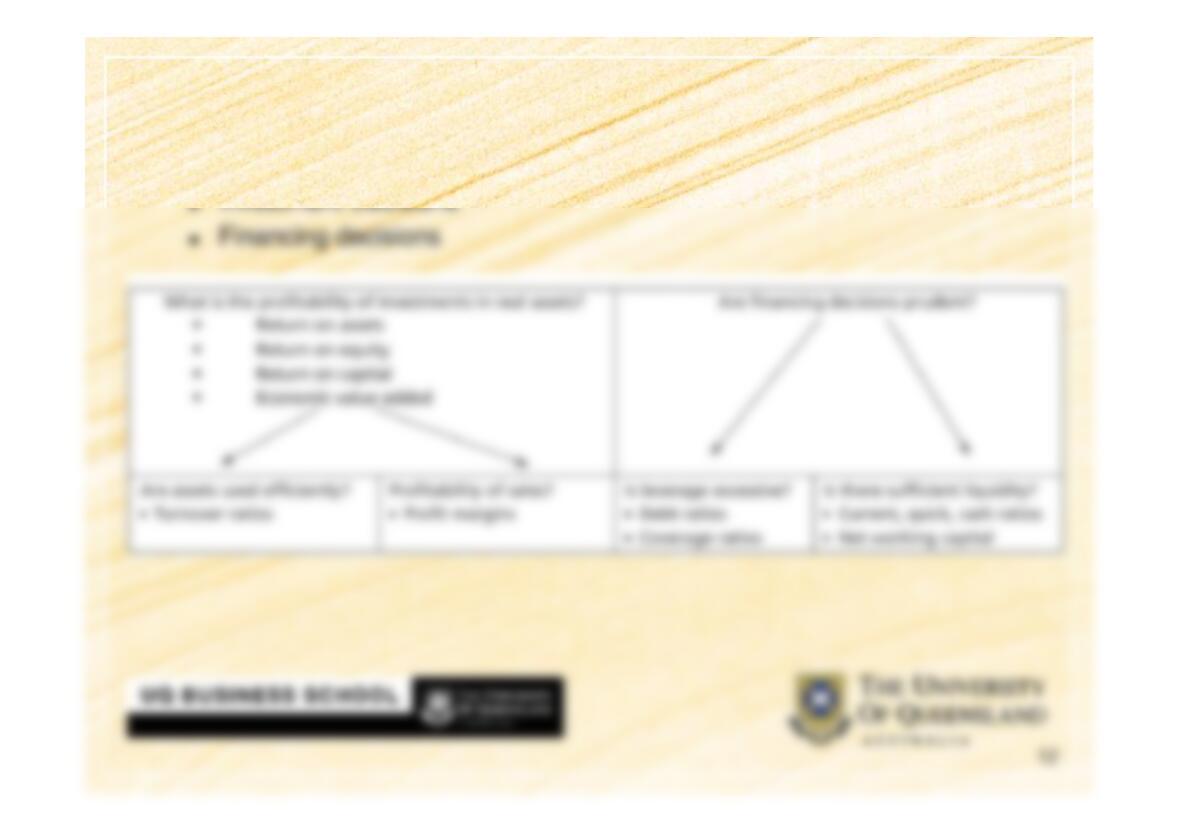
Ratios
Evaluate the firms based on two broad activities: