IFS2230 Management Information Systems Tutorial 1
KIMEP 1
BCB/OMIS
1
Tutorial 1
• Data tables
• Scenarios
Data Tables
Introduction
Data Tables are a tool used frequently in Excel models to track how small changes in inputs
affect the results of formulas in your model that are dependent on those inputs. For example, you
might be interested in knowing how changes in the price your firm charges for an item affect the
firm’s net income. An analysis of this sort is often termed a sensitivity analysis. Excel has two
varieties of Data Table: The One-Variable Data Table The Two-Variable Data Table Both
varieties work in a similar fashion. You identify one or two key input variables in your model
and describe the range of values you want those inputs to take on. Then you identify one or more
formulas in your model that are dependent on those inputs. When you execute the Data Table
command, Excel then iterates through a process of executing each formula you’ve identified,
substituting in each formula each one of the values you’ve identified for the key input variables,
and recording how the value changes change the results of the formulas. The One-Variable Data
Table allows identification of a single input variable but an unlimited number of formulas. The
Two-Variable Data Table allows identification of two input variables but only a single formula.
The layout of your Data Tables is important and must follow Excel’s rules for Data Tables.
Advantages to using a Data Table include:
• The ability to use an unlimited number of values as inputs to one or more key formulas in
your model.
• Having the Data Table generate outputs in a condensed matrix, making it easy to see all
the possibilities you want to view and compare.
• The option to select the most viable or interesting result values as inputs into Excel’s
Scenario Manager, if you want to focus on a handful of most interesting values and
scenarios.
Adjuncts and/or alternatives to using a Data Table:
• Entering inputs by hand one at a time and keeping manual track of the results or saving
the results on separate worksheets (tedious work perhaps resulting in hundreds of
worksheets).
• Using Excel’s Solver and its Sensitivity Report.
• The rest of this document discusses how to construct and execute Excel Data Tables.
To continue working on data tables the workbook Davis Blades_task.xls should be downloaded.
The One-Variable Data Table: Basics
The One-Variable Data Table allows you to identify a single decision variable in your model and
see how changing the values for that variable affect the values calculated by one or more
formulas in your model.
Notes on Creating a One-Variable Data Table
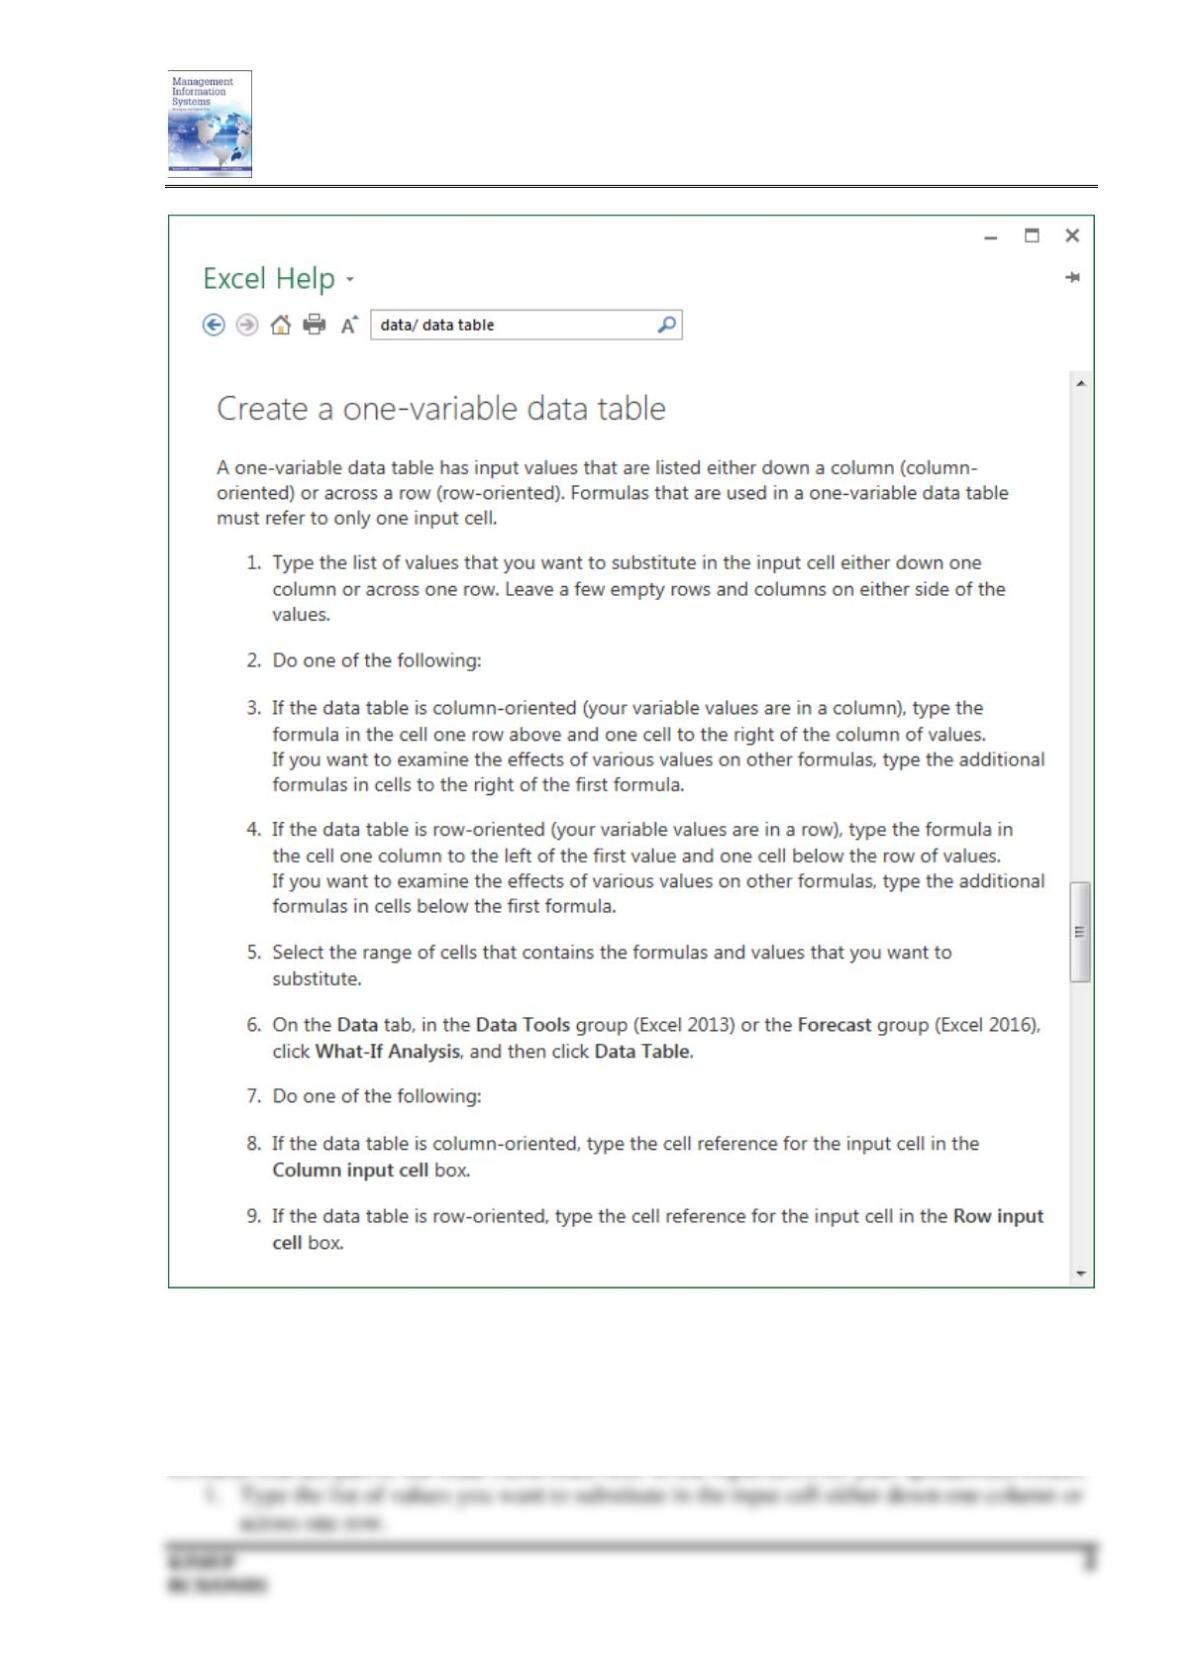
• Excel’s online help instructions for creation appear below.
• You’ll most often see a Data Table’s input values listed down the left-most column of the
Table (instead of across the top row).
• The layout of your data table must conform to Excel’s rules for data tables. Non–
conformance is the most common reason for having a problem generating a data table.
IFS2230 Management Information Systems Tutorial 1
How to Create a One-Variable Data Table
Design your one-variable Data Table so that input values are listed either down a column
(column-oriented; most common) or across a row (row-oriented). Formulas used in a one-
variable Data Table must refer to an input cell (A cell in which a list of input values from the
Data Table is substituted. Any cell on the worksheet can be designated as the input cell. The