International Journal of Economics, Business and Accounting Research (IJEBAR)
Peer Reviewed – International Journal
Vol-2, Issue-2, 2018 (IJEBAR)
ISSN: 2614-1280, http://www.jurnal.stie-aas/ijebar
International Journal of Economics, Business and Accounting Research (IJEBAR) Page 57
THE EFFECT OF FINANCIAL PERFORMANCE OF
COMPANIES ON SHARE RETURN IN MANUFACTURING
COMPANIES LISTED IN INDONESIA STOCK EXCHANGE
YEAR 2014 –2016
Paryanto1, and N. Dicky Sumarsono2
Tax Management Study Program, STIE-AAS, Central Java, Indonesia
paryanto.stieaas@gmail
Abstract :This study aims to determine the effect of parsiil and simultaneous price book
value, price earnings ratio, earnings per share and dividend pay out ratio to
stock returns on manufacturing companies listed in Indonesia Stock Exchange
2014–2016. The technique of determining the sample in this research is by using
purposive sampling. There are several criteria that must be met by companies
listed in Indonesia Stock Exchange to be a sample in this research. This research
method uses multiple regression analysis which is used to know the influence of
independent variable to dependent variable together and partially. The test t is
used to test the influence of each price book value variable, price earning ratio,
earnings per share and dividend pay out ratio) to stock return variables.
Statistical test F aims to examine the influence of price book value variable,
price earning ratio, earnings per share and dividend pay out ratio) together to
stock return variables. Test R2 (Coefficient of determination) is done to find out
how much influence the variable of price book value, price earning ratio,
earnings per share and dividend pay out ratio to stock return variable. From
result of t test known that price book value, earnings per share and dividend pay
out ratio partially significant effect to stock return. Variable Price Earning Ratio
partially no significant effect on stock return variables. From result of F test
known that Price Book Value, Price Earning Ratio, Earning Per Share and
Dividend Pay Out Ratio simultaneously have an effect on signifikan to variable
Return of Shares In Manufacturing Company Listed In Indonesia Stock
Exchange Year 2014 –2016.
Keywords : PBV, PER, EPS, DPR, Stock Return
I. INTRODUCTION
The purpose of the investor / company to invest
is to earn a profit or return (return) large shares.
The expected return of investors from an
investment can be realized in the form of capital
gains and dividends. Capital Gain is the amount
of stock that can provide benefits for investors.
Dividends represent a portion of the company’s
profits that the company distributes to its
shareholders based on the number of shares held.
Not all stock returns can be realized in the form
of dividends because in a public company there
is a policy called dividend policy.
In estimating the rate of return (rate of return)
that will be obtained, investors first need to
measure the company’s financial performance.
Financial performance will determine the high
stock prices in the stock market. If the company’s
financial performance indicates a good prospect,

International Journal of Economics, Business and Accounting Research (IJEBAR)
Peer Reviewed – International Journal
Vol-2, Issue-2, 2018 (IJEBAR)
ISSN: 2614-1280, http://www.jurnal.stie-aas/ijebar
International Journal of Economics, Business and Accounting Research (IJEBAR) Page 58
then its shares will attract investors and the price
increases. With rising stock prices of course
stock returns received by investors also
increased.
The analytical technique used to measure the
company’s financial performance in order to
make long-term stock investment decisions is a
fundamental analysis, which is an analytical
technique that focuses on financial ratios.
From the analysis of financial ratios can be used
to predict stock prices or returns in the capital
market, including the financial condition of the
company in the future.
According to Husnan (2009: 307) fundamental
analysis predicts stock prices in the future by
estimating the fundamental factors that affect
future stock prices and connecting variables so
that stock price estimates are known. Which in
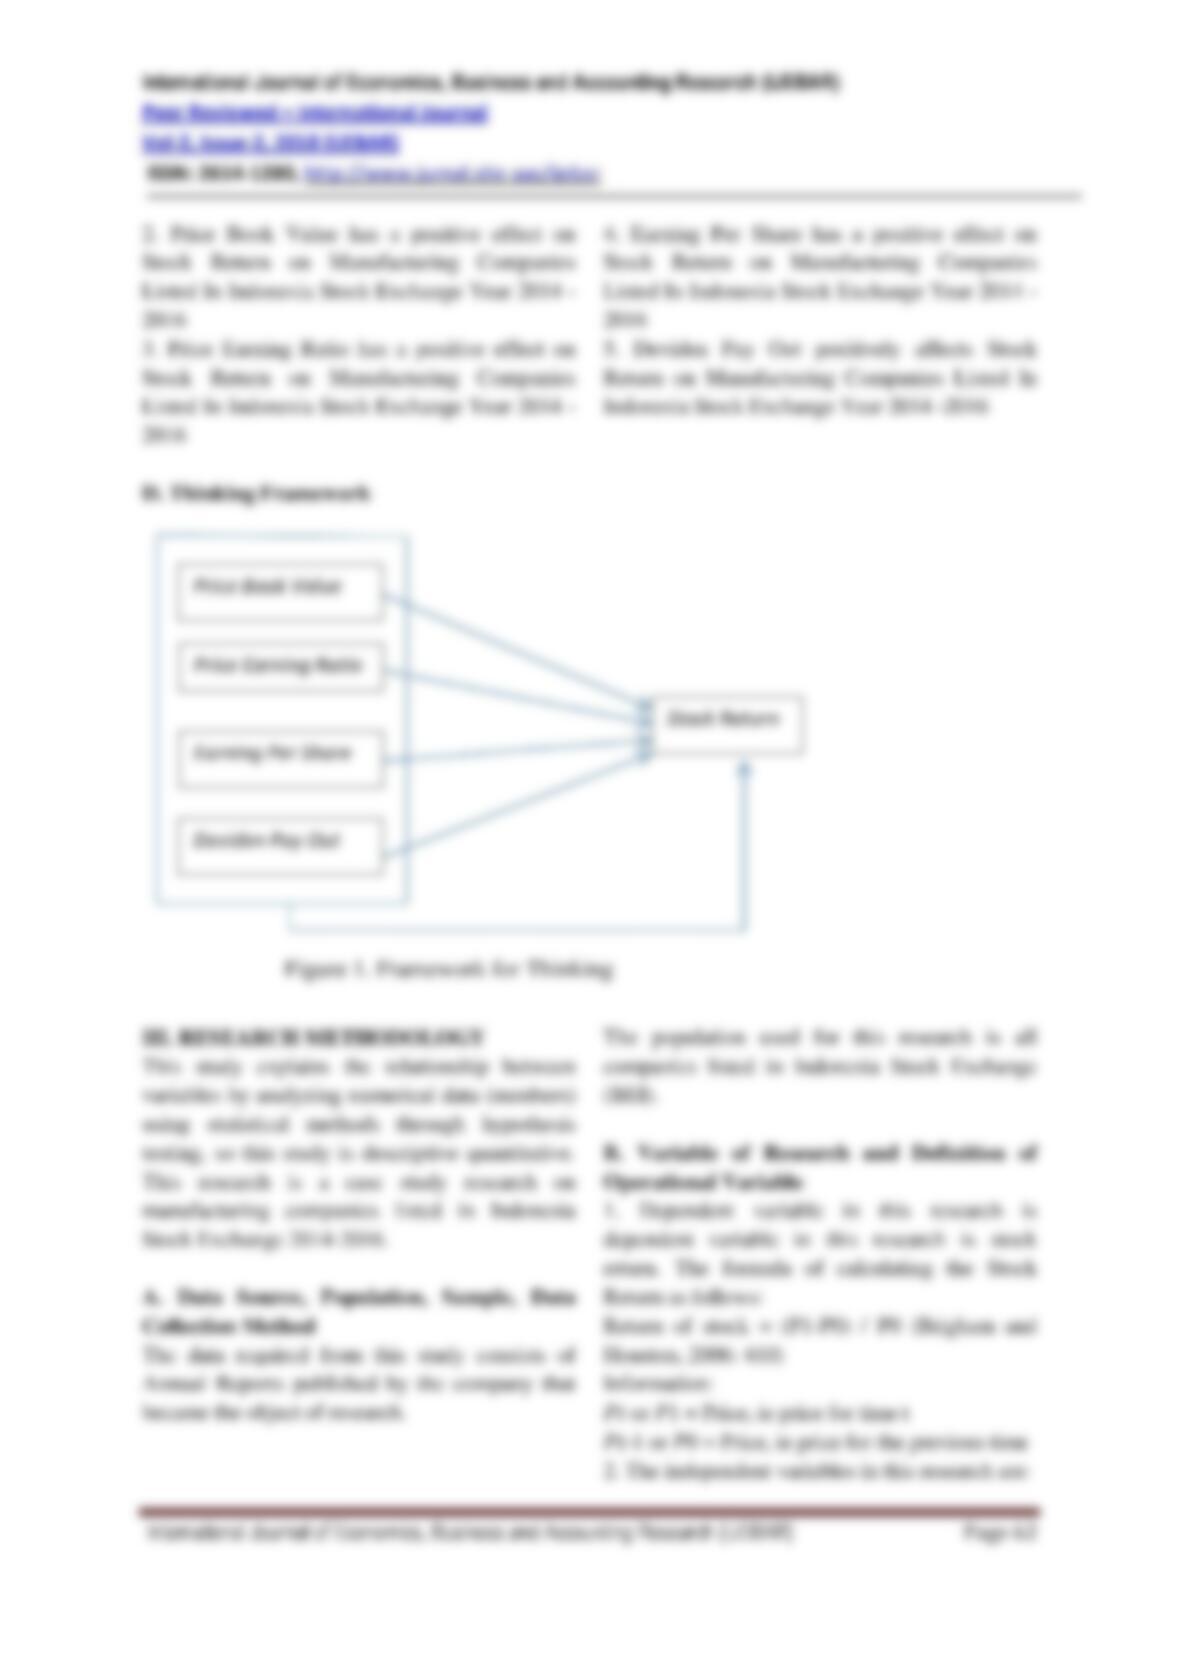
this study the author uses 5 variables, namely
Price Book Value, Price Earning Ratio, Earning
Per Share and Deviden Pay Out Ratio. These
variables are the financial ratios to measure the
company’s financial performance in order to
make long-term stock investment decisions.
Price to Book Value (PBV) is the ratio of stock
price and book value per share of a company.
This ratio illustrates how much the market
appreciates the value of a company’s stock book.
The higher this ratio will give an idea that the
higher stock price of the company, indicating the
better performance of the company, so it can
provide a better rate of return in the future. High
price to book value reflects the level of
prosperity of shareholders, where prosperity for
shareholders is the main objective of the
company.
Price Earning Ratio (PER) is the ratio used to
measure the amount of money paid by the
investor for each rupiah of corporate income.
The high Price Earning Ratio (PER) of the
company means the company’s stock can provide
a great return for investors, the greater the
investor’s confidence in the future of the
company for the return of investment. Price
Earning Ratio (PER) is used by investors to
predict the company’s ability to generate profit in
the future. Investors can consider this ratio to sort
out which stocks will benefit substantially in the
future. PER denotes the relationship between the
stock market price of the common stock and the
earnings per share. A high level of profit
signifies the growth of the company from the
future. Companies with a high growth rate
opportunity usually have a high PER, and vice
versa companies with low growth have a small or
low PER. PER is part of the market ratio where
the viewpoint of this ratio is more from the
investor’s point of view and is also a measure to
determine how the market assigns value or price
to a company’s stock.
Earning Per Share (EPS) represents the amount
of profit earned for each common share. High
EPS indicates that the company is able to provide
a better level of welfare to shareholders. Thus
EPS demonstrates the company’s ability to earn
profits and distribute profits to the shareholders.
Dividend payout ratio (DPR) is a comparison
between dividends paid with the profits available
to public shareholders (Hartono, 1998). Investors
tend to like companies that have high levels of
the House of Representatives because they are
considered able to provide better benefits with
better levels of certainty.
Given the company’s financial performance
analysis is needed in order to make investment
decisions in stocks and given the high stock
return of the company is very important of them
will increase investor confidence to invest in a
company hence the researcher interested to
examine various factors affecting stock return of
company with title: Effect of Financial
Performance on Stock Return on Manufacturing

International Journal of Economics, Business and Accounting Research (IJEBAR)
Peer Reviewed – International Journal
Vol-2, Issue-2, 2018 (IJEBAR)
ISSN: 2614-1280, http://www.jurnal.stie-aas/ijebar
International Journal of Economics, Business and Accounting Research (IJEBAR) Page 59
Companies Listed In Indonesia Stock Exchange
Year 2014 –2016.
II. LITERATURE REVIEW
A. Theoretical Basis
1. Stock Return
Stock return is one of the factors that encourage
investors to invest and is a reward for the
courage of investors to bear the risk of
investment.
There are two types of returns: return realization
(realized return) represents the return yng has
occurred. This return is calculated using
historical data. Return realization is important
because it is used as a measure of the company’s
financial performance. Return realization is also
useful in determining expected return and future
risk. Return realization is measured by using
total return, relative return, cumulative return and
adjusted return. Medium average of return can be
calculated based on arithmetic mean (mean
arithmetc mean) and geometric mean (geometric
mean). “The expected return is the expected
return expected by investors in the future”.
Return of expectation can be calculated based on
future expectation value, historical return value,
expected return model. Jogiyanto Hartono (2008:
195)
The component of stock return as proposed by
Tendelilin (2010: 48), states that the stock return
consists of:
a. Capital gain (loss)
Capital gain (loss) is an increase (decrease)
in the price of a stock that can provide profit
(loss) for investors. Capital gain is also the
result obtained from the difference between
the purchase price (buying rate) and the
selling price (the selling rate). This means
that if the buying rate is less than the selling
rate, the investor is said to get capital gain,
and vice versa if the buying rate is greater
than the selling rate, the investor will get
capital loss. Then capital gains can be written
as follows:
Capital Gain (Loss) = (Pt – Pt – 1) / (Pt – 1)
Jogianto (2010)
Information:
Pt = Share price of current period
Pt-1 = Stock price of previous period
b. Yield
Yield is a component of a return that reflects
the cash flow or income derived periodically
from a stock investment. Yield is also a
percentage of periodic cash receipts on the
investment price of a certain period of an
investment, and for ordinary shares where
periodic payments are Dt rupiah per share,
the yield can be written as follows (Jogianto,
2010)
Yield = Dt / (Pt-1)
Information:
Dt = cash dividends paid
Pt-1 = Stock price of previous period
2. Company Financial Statement Analysis
In general, there are many analytical techniques
in making investment judgments, but the most
widely used are fundamental analysis, technical
analysis, economic analysis, and financial ratio
analysis (Anoraga, 2008).
According to Hanafi and Halim (2009) basically
ratio analysis can be grouped into five kinds of
categories, namely:
a. Liquidity Ratio
Ratio that measures a company’s ability to meet
its term obligations
in short. The liquidity ratio consists of: Current
Ratio, Quick Ratio, and Net Working Capital.
b. Activity Ratio
This ratio indicates the company’s ability to
utilize its assets. The Activity Ratio consists of:
Total Asset Turnover, Fixed Asset Turnover,
Account Receivable Turnover, Inventory
Turnover, Average Collection Period, and Day’s
Sales in Inventory.
International Journal of Economics, Business and Accounting Research (IJEBAR)
Peer Reviewed – International Journal
Vol-2, Issue-2, 2018 (IJEBAR)
ISSN: 2614-1280, http://www.jurnal.stie-aas/ijebar
c. Solvency Ratio
This ratio shows the company’s ability to meet its
long-term obligations. The solvency ratio
consists of: Debt Ratio, Debt to Equity Ratio,
Long Term Debt to Equity Ratio, Long Term
Debt to Capitalization Ratio, Times Interest
Earned, Cash Flow Interest Coverage, Cash Flow
Interest Coverage, Cash Flow to Net Income, and
Cash Return on Sales.
d. Profitability Ratio
This ratio shows the ability of the company in
generating profit. Revenue ratio consists of:
Gross Profit Margin, Net Profit Margin, Return
on Assets, Return on Equity, and Operating
Ratio.
e. Market Ratio
This ratio indicates important company
information and is disclosed on a per share basis.
The market ratio consists of: Dividend Yield,
Dividend Per Share, Dividend Payout Ratio,
Price Earning Ratio, Earning Per Share, Book
Value Per Share, and Price to Book Value.
Of the five ratios, which are directly related to
Price earning ratio is useful to see how the
market appreciates the performance of a
company’s stock on the performance of the
company as reflected in earnings per share.
According to Brigham and Houston (2010: 150),
Price Earning Ratio is: The ratio of price per
share to earnings per share indicates the amount
that investors are willing to pay for each reported
profit dollar.
A high PER indicates that investors are willing
to pay a premium share price for the company.
Based on the above opinion, the definition of
PER referred to in this study is the ratio that
compares the price of shares per share of
common shares in circulation with earnings per
share.
c. Earning Per Share
According to Brigham and Houston (2010: 240),
earnings per share are
the amount of revenue earned in a given period
for each number of shares outstanding.
This ratio is used to measure the percentage of
earnings against stock prices. Earnings per share
are the sum of the profits earned for each