University of Miami
Mark E. Friedman
Cost – Volume – Profit Relationships
The axel division of Building Blocks of Accounting makes axels which are sold to other
companies at a price of $2.00. The costs of each unit are as follows:
2 wheels @ .06 each $0.12
1 rod (various sizes) @ .03 each 0.03
1 rubber band Size 18, purchased in 1 lb bags
Direct Labor per unit 0.10
Variable Factory Overhead 0.05
Total incremental cost of making one unit $0.30
Allocated fixed overhead per month $250.00
Fixed selling per month 50.00
Variable selling cost per unit (commission) .20
The materials are purchased from multiple sources and
are stored in the locked Raw Materials inventory room.
The factory supervisor fills out a requisition form each
morning for the direct materials that the factory will need.
The direct materials and a bunch of rubber bands are
removed from the locked Raw Materials inventory room
and moved into the factory which is also referred to as
the Work-in-Process Inventory room. There, the workers
assemble the axel. The units are moved to the Finished
Goods location when completed.
Cost of Goods Manufactured includes – Direct Material, Direct Labor, and Factory
Overhead.
1. Material purchased from outside vendors
a. Direct materials are traced to the finished product.
2 wheels @ .06 each $0.12
1 rod (various sizes) @ .03 each 0.03
b. Indirect materials are not traced to the finished product.
1 rubber band Size 18, purchased in 1 lb bags
2. Labor
a. Direct labor includes salaries and wages for employees who are directly
involved in the manufacturing process.
b. Indirect labor includes salaries and wages for employees who are not directly
involved in the manufacturing process.
3. Factory overhead includes all manufacturing costs other than direct materials and
direct labor.
Version R Cost Volume Profit Page 1

University of Miami
Mark E. Friedman
4. Cost-volume-profit analysis helps analyze the relationship between a business’s
costs, volume, and profit or loss.
A. A cost driver is any factor whose change makes a difference in a related total
cost. Volume (units produced or sold, or dollars) is the most prominent cost
driver.
B. Costs can be classified as variable, fixed, or mixed.
1. Variable costs change in total in direct proportion to changes in volume
(sales or production). Variable cost per unit does not change.
If an axel costs $.50 per unit then 200 axels cost $100.00, 400 axels cost
$200.00
2. Fixed costs do not change in total as volume changes. Fixed costs
decrease on a per unit basis as production increases.
If fixed costs are $300 and you produce 200 units, the fixed cost per unit
is $1.50. If, however, you produce 400 units, the fixed cost would drop to
$.75 ($300/400).
3. Mixed costs (semi-variable costs) have both fixed and variable
components.
C. A contribution margin income statement can be used in decision making
because it classifies expenses as either variable or fixed and highlights the
contribution margin.
1. Income will increase by the contribution margin of the additional number
of units sold.
2. Variables can be easily changed to assess the impact on the income
statement.
D. The relevant range is the range of volume in which a business expects to
operate and in which costs will behave as defined.
Version R Cost Volume Profit Page 2
University of Miami
Mark E. Friedman
Example
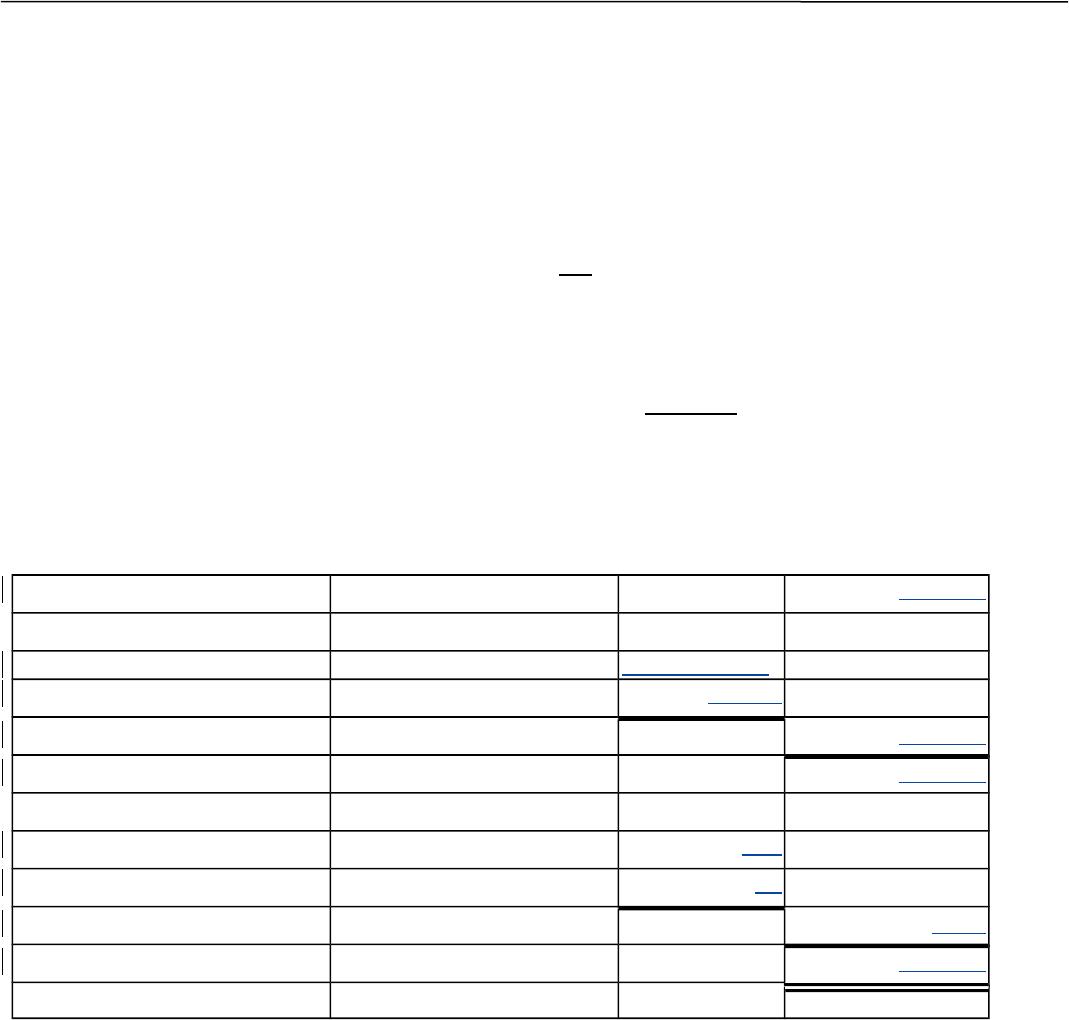
We sold 300 axels. Using the data provided, determine the profit.
Selling Price $2.00
Variable Costs
Cost of Goods Sold $.30
Commissions (10% of Sales) .20
Total Variable Cost $.50
Fixed Costs
Cost of Goods Sold $250.00
Salary 50.00
Total Fixed $300.00
Income Statement
Sales (300 @ 2.00) $600.00
Cost of Goods Sold
Variable (300 @ .30) $90.00
Fixed 250.00
Total $340.00
Gross Profit $260.00
Selling and Administrative
Variable (300 @ .20) $60
Fixed 50
Total $110
Net Income $150.00
Version R Cost Volume Profit Page 3
University of Miami
Mark E. Friedman
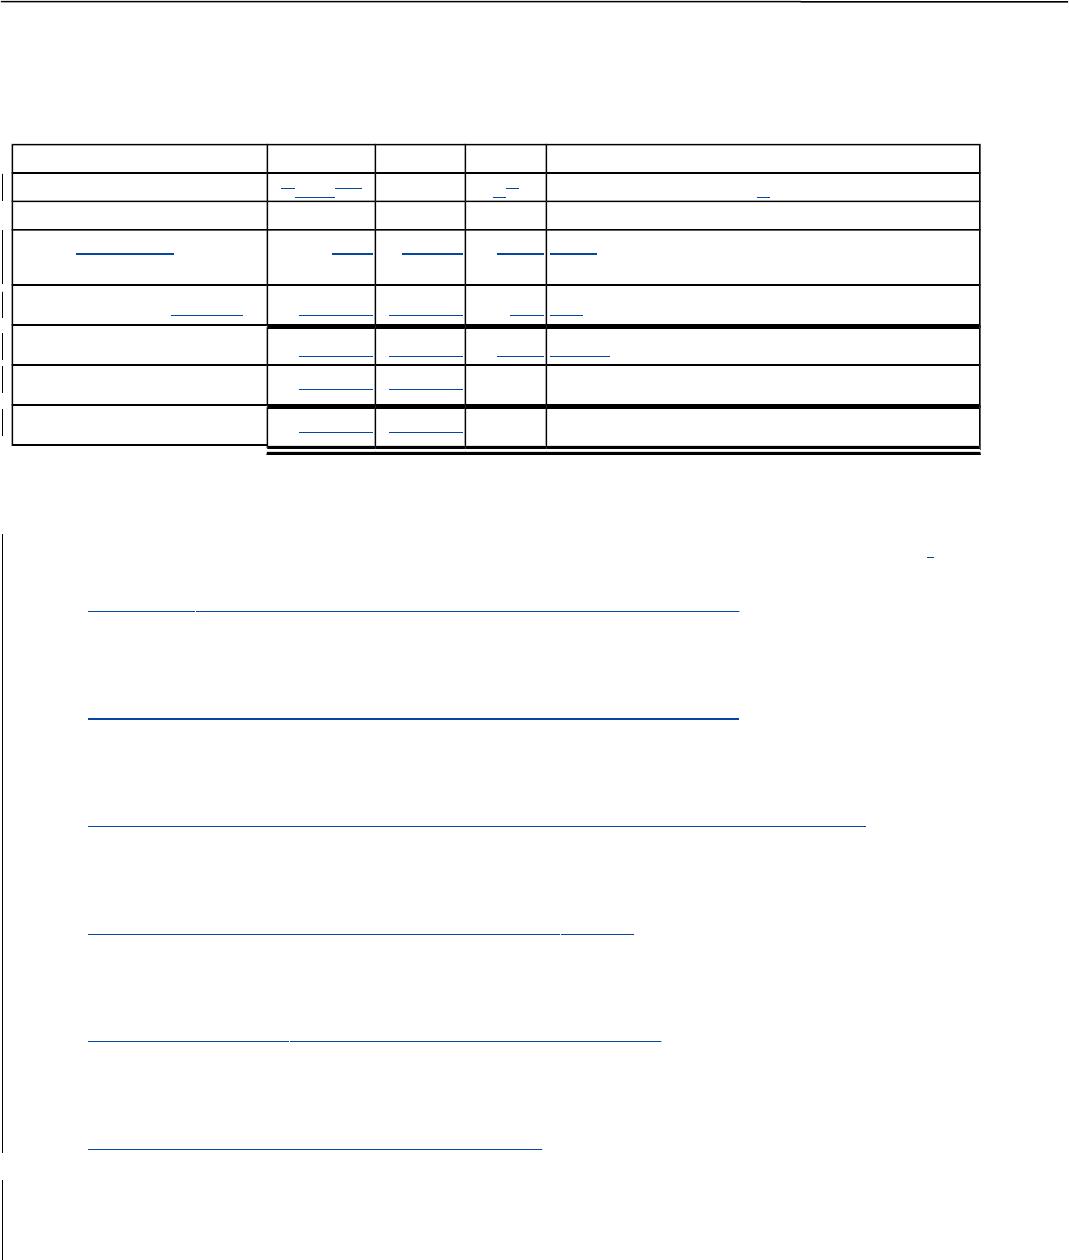
Contribution Income Statement
Units 330000 600 11 2
Sales @ $2.00 600 1,200 2.00 4.00
Variable Costs @ .50 150.00 300.00 .50 .00
Contribution Margin 450.00 900.00 1.50 15.00
Fixed Costs 300.00 300.00
Net Income 150.00 600.00
If sales were 600 units, would profit double?
What would be the change in net income if sales increased from 600 units to 601 units?
Would be an increase of $1.50 see right box (Units Extra 1.00)
What would be the change in net income if sales increased from 601 units to 602 units?
Would be an increase of $1.50 see right box (Units Extra 1.00)
What would be the net income if sales were 0 units?
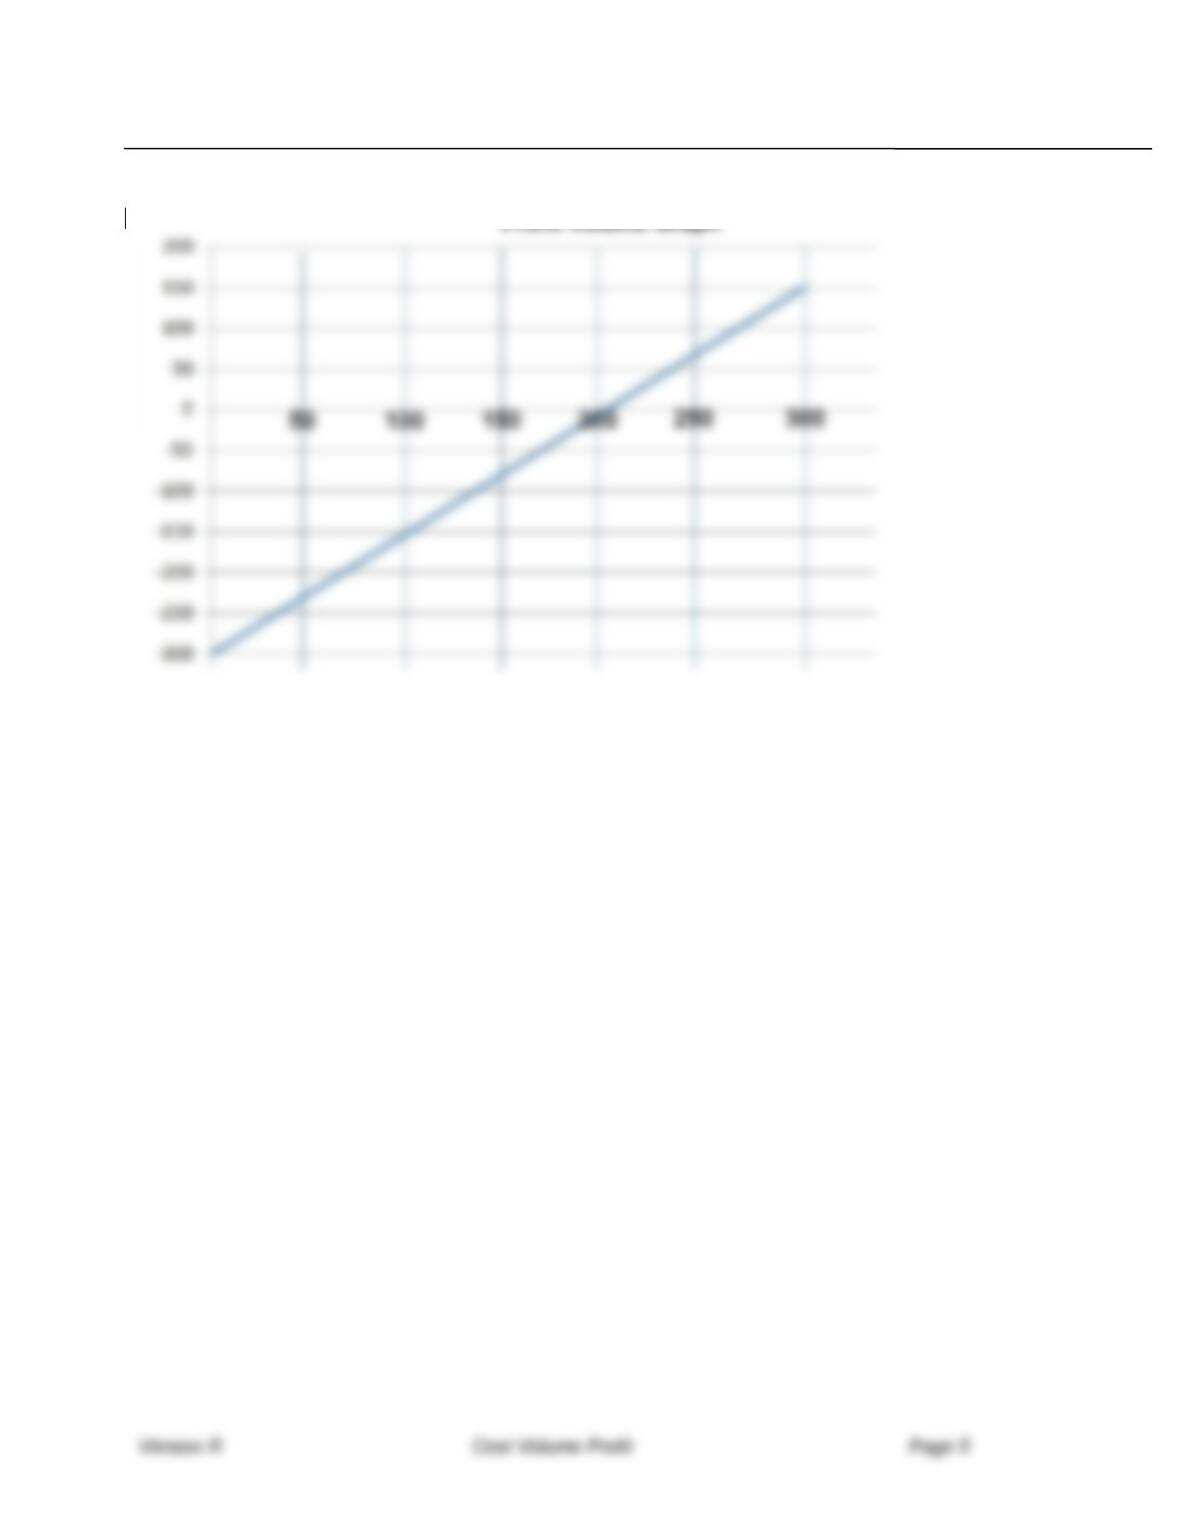
Would be a loss of $300 (the fixed cost since fixed cost is always constant)
What would be the net income if sales were 2 units?
Would be a loss of $297 (2 * $1.50 = FC 300 – 3.00)
What would be the net income if sales were 10 units?
Would be a loss of $285 (10 * $1.50 = FC 300 – 15.00)
What would be the net income if sales were 200 units?
Would be 0.00, this is the break-even point.
Version R Cost Volume Profit Page 4
University of Miami
Mark E. Friedman