Assel Baizhanova
Seminar 4
Group 3
Zarina Sautbaeve
MB LAB 2
Investigation of the activity of cellobiase enzyme using a baseline experiment with
alterations in enzyme concentration
2
Introduction
The enzymes are extremely important in speeding up reactions so for the reaction to occur
at an appreciable rate, enzyme activity should be studied at various conditions. In general,
enzymes can be defined as biological catalysts, which increase the rate of a reaction by lowering
the activation energy of the reaction (Hardin and Bertoni, 2018, p. 154). The activation energy
is the minimum amount of energy that reactants must contain before collisions to reaction proceed
successfully (Hardin and Bertoni, 2018, p. 152). The general formula for the enzymatic reaction
is E+S→ES→E+P, where E stands for enzyme, S-substrate and P-product. The interaction in the
enzymatic reaction occurs through the active site of the enzyme that can be defined as part of
the enzyme in the pocket like a form that is essentially a set of amino acids, specific for each
enzyme type, where the substrates bind and the catalytic event occurs (Hardin and Bertoni, 2018,
p. 154). When the active site of the enzyme is bounded with the new substrate as soon as the
preceding product was released, the enzyme is working at the maximum velocity, which can be
adjusted by an increase in substrate concentration (Hardin and Bertoni, 2018, p. 163). The rate
at which reaction proceeds is also changed to a more favourable one by altering the pH, enzyme
concentration and temperature. The enzymatic reaction that was studied involves the digestion
of cellulose, which is the structural polysaccharide that makes up plant walls. After exocellulase
enzyme activity which breaks the linkages between the glucose units of cellulose and two–
monomer-long cellobiose molecules are produced from this process which then can then be
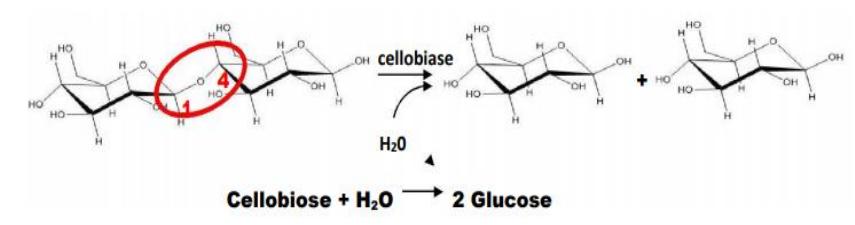
digested to individual glucose monomers by cellobiase as illustrated in Figure 1. The cellobiase
enzyme makes hydrolytic cleavage of cellobiose into glucose monomers which can then be used
to produce energy.
Figure 1. The hydrolytic breakdown of cellobiose into glucose monomers catalyzed by
cellobiase
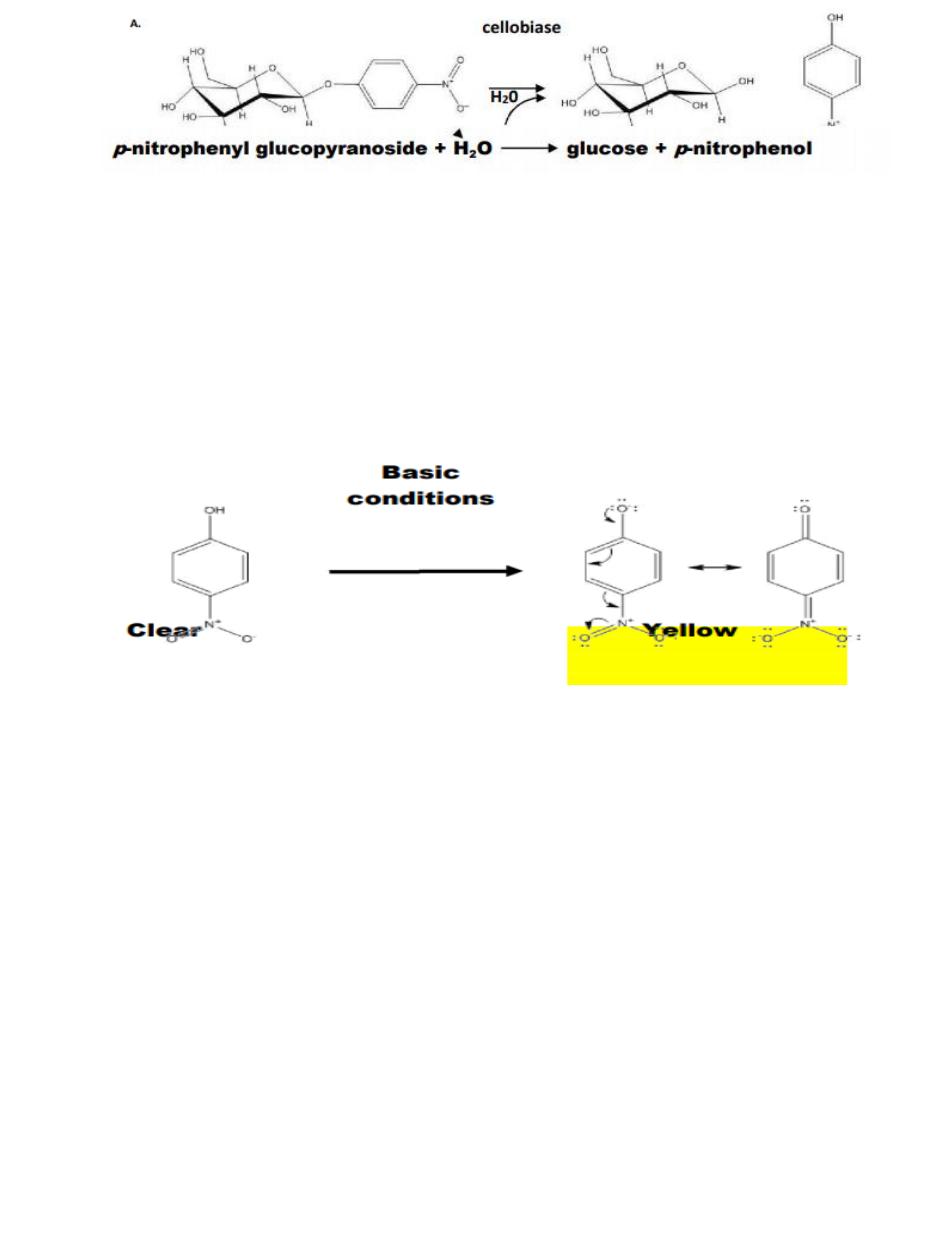
Although cellobiose is the natural substrate of cellobiase, it is hard to quantitatively detect
the glucose or the disappearance of cellobiose, so the artificial substrate, p-nitrophenyl
glucopyranoside, which is composed of beta glucose covalently linked to a molecule of p-
nitrophenol is used instead. When the bond connecting these two molecules is cleaved with the
help of cellobiase, the p-nitrophenol is released. Figure 2 illustrates the chemical composition of
the reaction investigated in the experiment.
3
Figure 2. The hydrolytic breakdown of p-nitrophenyl glucopyranoside into glucose and p-
nitrophenol catalyzed by cellobiase enzyme
In general, the amount of released p-nitrophenol can be determined by finishing the
activity of the enzyme by stop solution which a basic solution, which can be visible by the creation
of a coloured product. When the p-nitrophenol is placed in a basic solution, the hydroxyl group on
the nitrophenol loses an H+ to the OH- of the base, which changes the bonding within the phenolic
ring, so that the molecule will absorb violet light (and reflect yellow light). This makes the solution
yellow, which can be detected visually or by using a spectrophotometer to produce accurate,
quantitative results as seen in Figure 3.
Figure 3. The change of colour absorbance of p-nitrophenol under basic conditions
The investigation of the initial reaction rate was performed by a baseline experiment, which
is a collection of the data for the standard curve and comparison with the data obtained from
changes in the enzyme concentration. The baseline experiment is established for basic
comparison but does not necessarily reflect the optimum or best condition.
The purpose of the experiment is to construct a standard curve with p-nitrophenol, to
determine the initial reaction rate of cellobiase and to examine the effect of the enzyme
concentration on the initial reaction rate of the chemical reaction. The increase of the enzyme
concentration should increase the initial reaction rate of the chemical reaction due to more
available active sites that are ready to catalyze the reaction.
Materials and Methods
The determination of the initial rate by a standard curve requires preparation of standard
dilutions. This was made by preparing five Eppendorf tubes S1-S5 with 1ml deionized water in
each, S5 filled with 400 μl of standard and 600 μl of deionized water and then diluting the solution,
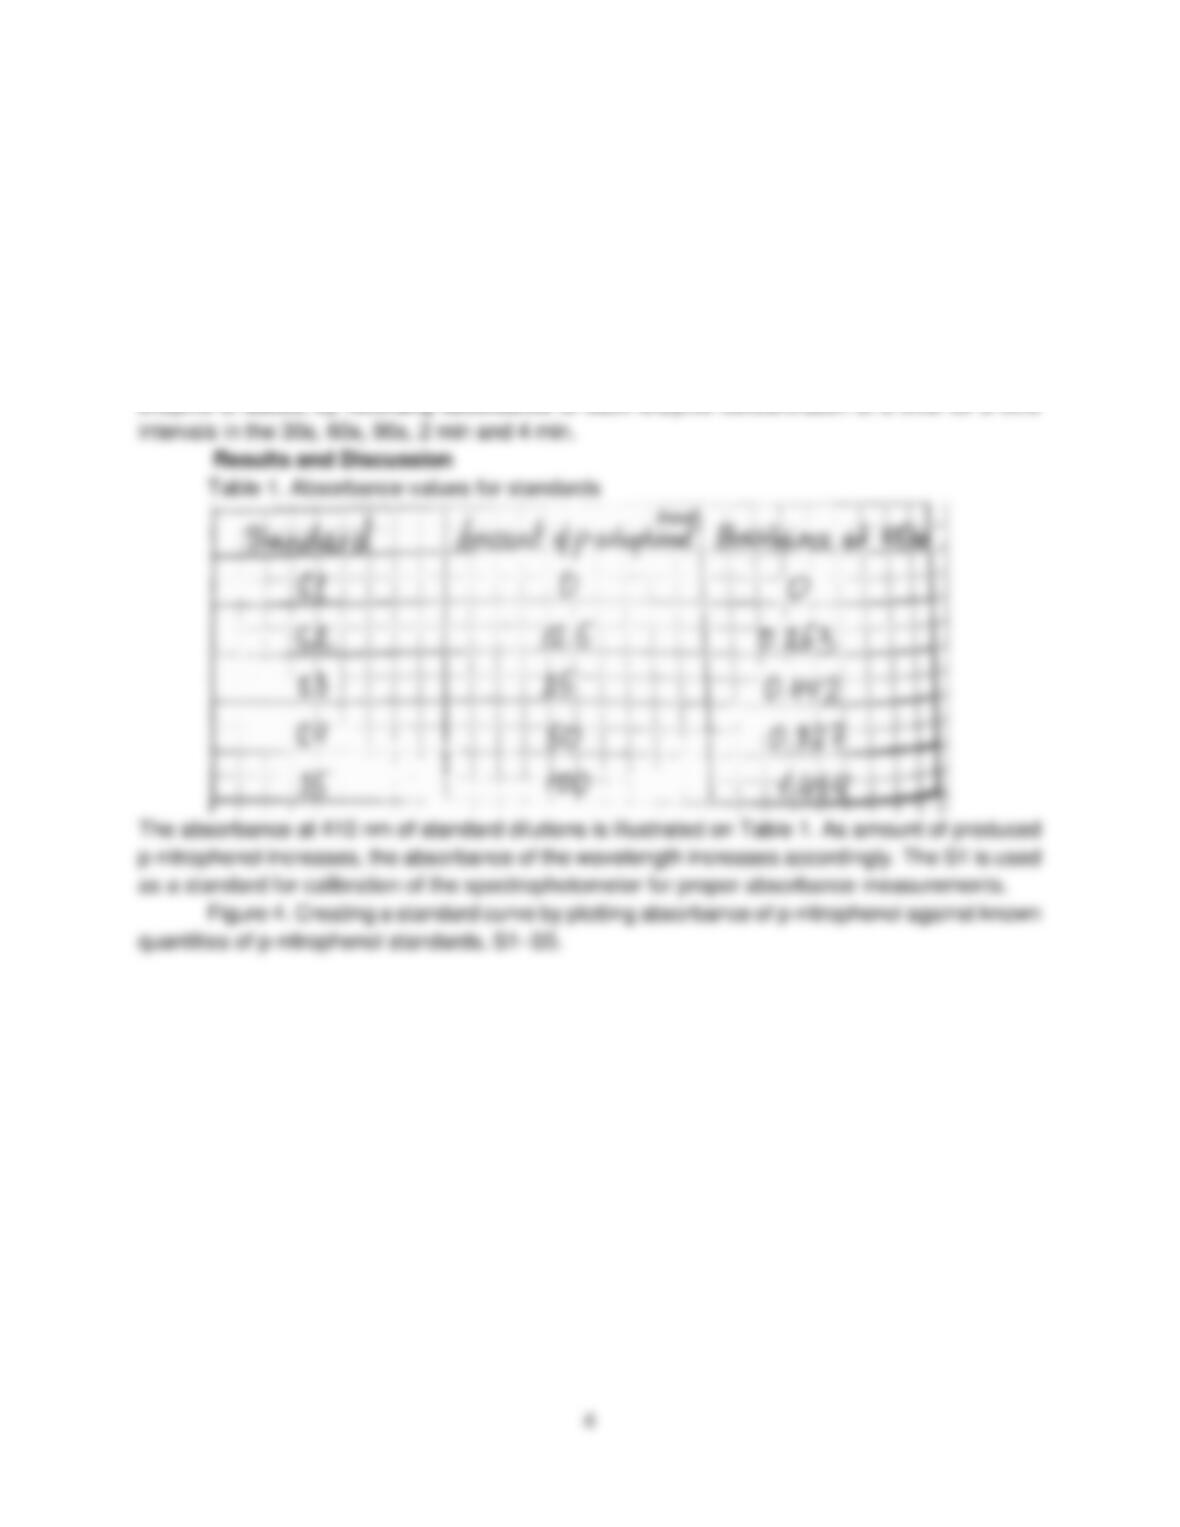
followed by adding 1 ml stop solution to each of them. The standards should be investigated by
spectrophotometer at 410 nm to construct a standard curve. Then after recording absorbance of
standard dilutions, the determination of initial reaction rates of cellobiase was done. Labelled 6
cuvettes were filled by 500μl of stop solution and then the blank cuvette, which calibrates the
spectrophotometer, was filled by 400μl 1.5 mM substrate and 100μl of the 1x resuspension buffer.
The absorbance of remaining cuvettes of the enzymatic reactions was done at the time intervals
of 30 s, 60 s, 90 s, 2 and 4 min. For that, the reaction volume was prepared by adding 2ml of 1.5
mM substrate into a 15ml conical tube and when the 1ml of the enzyme was added to the tube
immediately timing started. When 30 s is over, 500 µL of the reaction mixture from the conical
tube was added to one of the cuvettes containing stop solution, and immediately measured the
absorbance by recording the results and repeating the procedure for other time points. The
second part of the lab experiment carried out in a similar fashion but at the different enzyme
concentrations. The dilution of enzyme made accordingly by discarding proper amount each time
to make four 15 mL conical tubes with 16X, 8X, 2X and 1X and then by adding 2 mL of 1.5 mM
substrate to each of them. As it was in the previous part, timing started immediately when 1 ml