Supply Chain Management
Integration of the end (raw material) and front (customer) part of the chain
Integration of procurement, manufacturing, distribution, warehousing and transportation, in
order to secure Delivery In Full On Time, reducing system wide costs and improving service level.
Conflicting Objectives in the Supply Chain
Lot Size – Inventory Trade-Off
Manufacturers (typically) want large lot sizes
Per unit set-up costs lower, processes easier to control
Large lot sizes = large inventories
Retailers / distributors want short delivery lead times and wide product variety
Large inventories can lead to short delivery lead times, but will not support wide
product variety at an acceptable cost
Information to Address Lot Size – Inventory Trade-Off Conflicts
Advanced manufacturing systems – Kanban and CONWIP
POS data for advance warnings
Inventory – Transportation Cost Trade-Off
Full truckloads provide lowest operating costs per unit
Demand is (typically) less than full truckloads
Full truckloads (generally) inflate inventories
Information to Address Inventory – Transportation Cost Trade-Off Conflicts
Lead time reduction for batching
Information systems for combining shipments
Cross docking: allows the retailer to combine shipments from many different
manufacturers onto one truck destined for a particular location.
Advanced DSS
Lead Time – Transportation Cost Trade-Off
There is a trade-off between holding items until enough accumulate to reduce
transportation costs and shipping them immediately to reduce lead time.
Total Lead Time = Order processing time + procurement time + manufacturing time +
transportation time
Transportation costs low if quantities large
Lead times shorter if quantities small
Information to Address Lead Time – Transportation Cost Trade-Off Conflicts
Information systems for combining shipments
Cross docking
Improved forecasting
Lower order / procurement / manufacturing lead times
Product Variety – Inventory Trade-Off
Increased product variety = increased transportation and warehousing costs
Also require higher inventory levels to maintain adequate service levels

Problem matching supply with demand
Information to Address Product Variety – Inventory Trade-Off Conflicts
Delayed differentiation
Generic products shipped as far as possible before customization
Risk is “pooled” and forecasts can become more accurate (at the generic level)
Cost – Customer Service Trade-Off
Reducing inventories, manufacturing and transportation costs (typically) reduces
customer service levels
Information to Address Cost – Customer Service Trade-Off Conflicts
All of the methods mentioned in the previous sections
Direct shipping from warehouses to customers
Retail outlets require information about warehouse inventories
Retailers place order direct on warehouse – real time access to availability, allocation of
stock etc.
Strategy
Product Characteristics
Functional
(Predictable Demand)
Innovative
(Unpredictable Demand)
Product life Cycle
More than 2 years
3 months to 1 year
Product Variety
Low
High
Contribution Margin
5% to 20%
20% to 60%
Forecast Error
10%
40% to 100%
Average Stock-out rate
1% to 2%
10% to 40%
Lead time required for made-
to-order products
6 months to a year
1 day to 2 weeks
Fisher’s Model
Functional matches Efficiency – Push strategy
Innovative matches Responsiveness – Pull strategy
Lee’s Model
Demand Uncertainty
Low (Functional products)
High (Innovative products)

Supply
Uncertainty
Low
(stable
process)
Efficiency supply chain
Groceries
Responsiveness supply chain
Computers
High
(evolving
process)
Risk hedging supply chain
Power plants
Agile supply chains
Integration
Enablers:
• Information Technology: EDI (electronic data interchange), barcoding, RDFI
• Integrated Management: Data Warehousing; ERP Systems
• Responsiveness
• Financial Sophistication
• Globalization
Push
Pull
Objective
Minimize cost
Maximize service level
Focus
Resource usage – efficiency
Responsiveness
Complexity
High
Low
Lead time
Long
Short
Inventory
High
Low
Demand
Forecast
Actual Demand
Uncertainty
Low
High
Clockspeed
Slow
Fast
Profit Margins
Low
High
Variety
Low
High
Stock out rate
Low
High
Push-Pull boundary
By moving the push-pull boundary earlier, lead times and variability in the system are
decreased and service levels are improved due to increased ability to match supply and demand.
Also, inventory levels are decreased because there is little or no inventory in the pull portion of
the supply chain.
By moving the push-pull boundary later, costs can be reduced by taking advantage of economies
of scale. Furthermore, inventory levels may decrease due to risk pooling effects and reduced
safety stocks, if, for example, the push-pull boundary is moved later by delaying product
differentiation.
Benetton. Delayed differentiation in product design. The portion of the supply chain prior to
product differentiation is typically operated using a push-based strategy (demand aggregation:
better forecast, lower uncertainty, reduced inventory). The portion of the supply chain starting

from the time of differentiation is pull-based (high uncertainty, so differentiation occurs on
response to individual demand).
Dell. the push portion of the manufacturer’s supply chain is that portion prior to assembly, while
the pull part of the supply chain starts with assembly and is performed based on actual customer
demand. The push–pull boundary is at the beginning of assembly.
GM: Manufacturer design
Sport Obermeyer. High and low risk products differentiation. Low-risk products, that is, those for
which uncertainty and price are low, are produced in advance using long-term forecasts and
focusing on cost minimization, a push-based strategy. But decisions on production quantities for
high-risk products are delayed until there is a clear market signal on customer demand for each
style, a pull strategy. However, lead times are long, so they use push strategy to place order to
fabrics in advantage. Therefore push-pull for high-risk products.
Value of Information
Information replaces inventory
Sharing information to achieve integration – reduce cost and enhance service.
Potential of Information
• Helps reduce variability
• Helps improve forecasts
• Enables coordination of systems and strategies
• Improves customer service
• Facilitates lead time reductions
• Enables firms to react more quickly to changing market conditions.
Management of Information
• Types of Information
• Significant design and complexity issues
Bullwhip effect
Customer demand has low variability; however, orders have increasing variability upper stream.
Retailer forecasts demand of customers. Warehouse forecasts demand of retailer.
Manufacturer forecasts Warehouse demand. Supplier forecasts Manufacturer demand. Each of
them add a safety stock and extra capacity, to meet demand variability.
What are the Implications?
Excessive inventory investment
Poor customer service
Lost revenues
Misguided capacity plans
Ineffective transportation
Missed production schedules
Causes
• Forecast errors: forecast of the forecast of the forecast… increases error range.
• Batching orders: Full truck load – buyers hold orders until they achieve FTL, or buyers
order more than what they need to reduce transportation cost per unit. This gives
wrong signals to the supplier.
• Price fluctuations: promotions distort demand, increase variability in ordering patterns.
This gives misleading information to suppliers about demand.
• Shortage gaming: when customers place multiple orders for a product with one or more
suppliers or when they place an order for more than what they want. Customers often
do this if they know inventory will be in short supply.
Solutions
Reduce uncertainty: share information
Reduce variability: everyday low prices strategy
Reduce lead time: for safety stocks reduction
• Order lead times (i.e., the time it takes to produce and ship the item) can be reduced
through the use of cross-docking
• Information lead times (i.e., the time it takes to process an order), can be reduced through
the use of electronic data interchange (EDI).
Strategic partnership: change the way information is shared and inventory is managed within a
supply chain.
Causes
Strategies
Forecast errors
Sharing information: POS, VMI, collaborative forecasting; lead time
reduction
Batching orders
Crossdocking, 3PL, EDI
Price fluctuations
Every day low price strategy, retailer informs of promotions that
may alter the demand; Continuous replenishment
Shortage gaming
Build to order
Lead-Time Reduction
Why is it critical?
Customer orders are filled quickly
Bullwhip effect is reduced
Forecasts are more accurate
Inventory levels are reduced
How?

EDI – reduce order processing, paper work, stock picking, transportation delays
etc.
POS data leading to anticipating incoming orders
Distribution network designs
Outsourcing and Procurement
PROCUREMENT
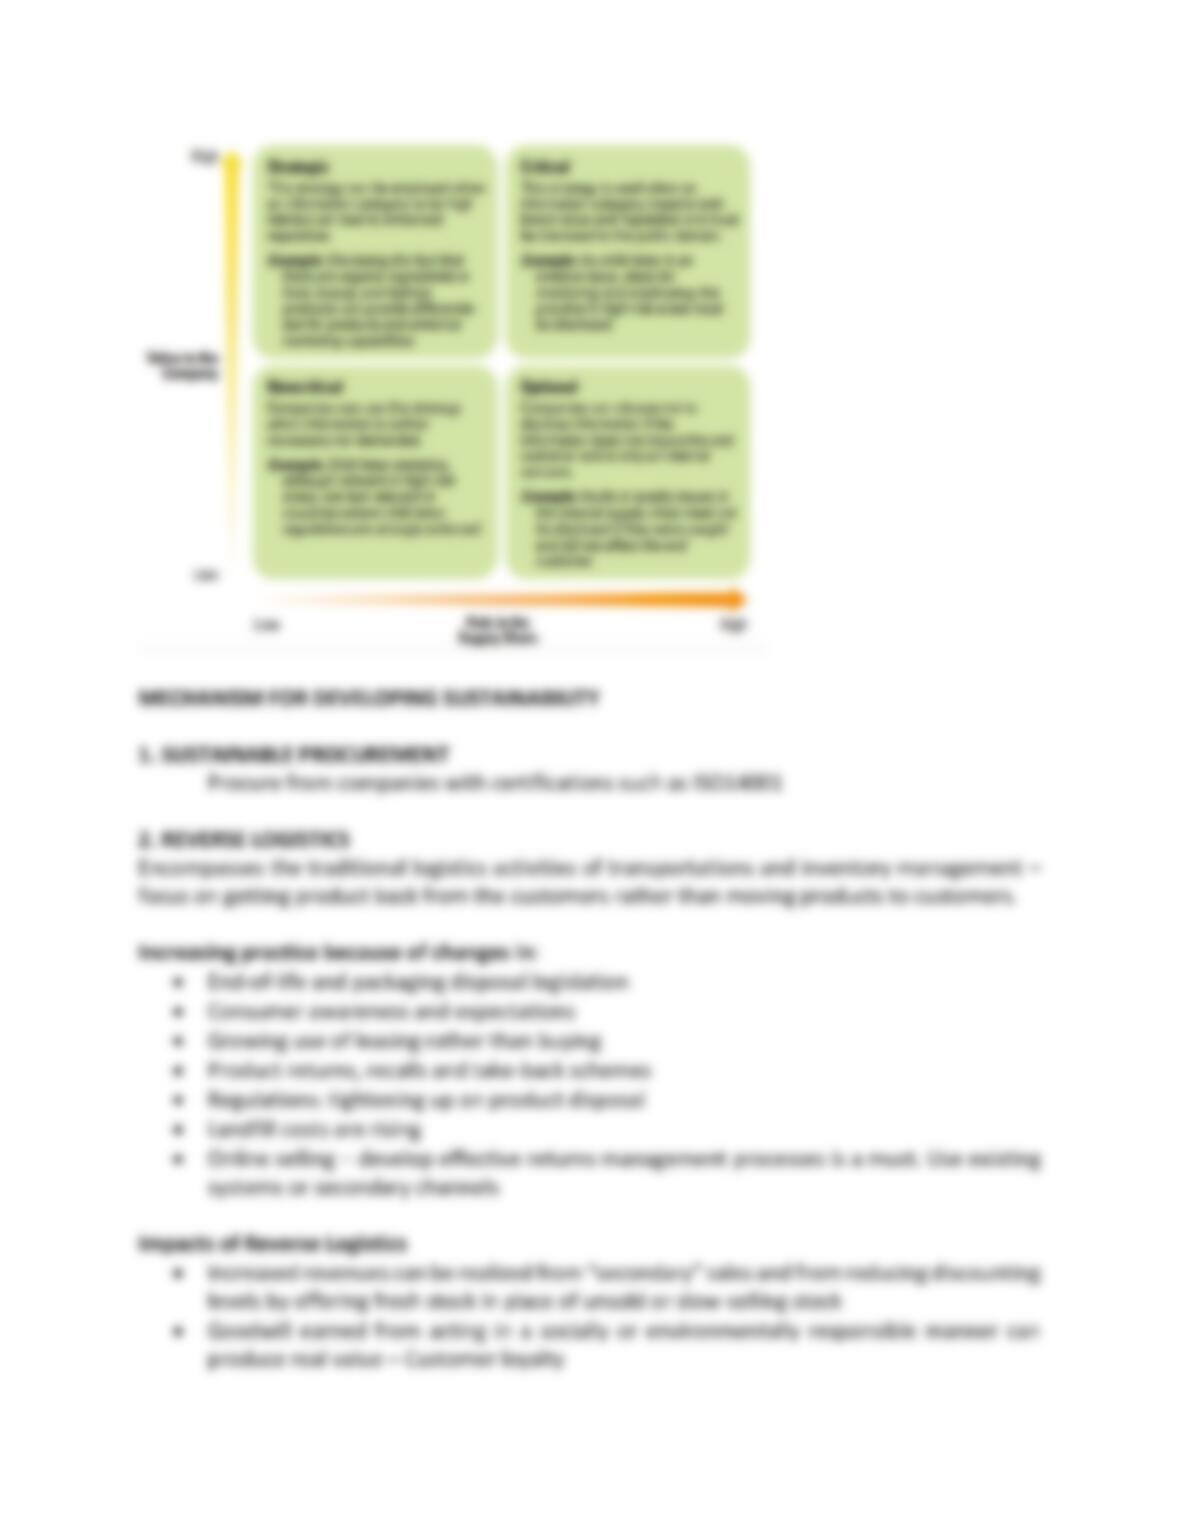
Kraljics’ Matrix:
Strategic items: high supply uncertainty and high profit impact.
Usually one supplier.
Strategy – strategic alliance
Example: Engine, hardware
Leverage: low supply uncertainty and high profit impact
Several suppliers
Strategy – Use power and make suppliers compete by price.
Example:
Bottleneck: High supply uncertainty, low profit impact.
Highly specialized pieces that do not add value to the product, that have few suppliers.
Strategy – Secure Supply: use of long term contracts.
Example:
Non-critical: low supply risk, low profit impact
Several suppliers and common products
Strategy: simplify and automate
Example: stationary products.
Product type
Functional: non-critical, mass production, low price
Innovative: quality.
Vendor Selection Criteria
Quality: product life cycle,
Capacity: can respond to required demand. Flexibility
Desired Qualities: service level, certifications, technical service, guarantee.
Reliability: trustworthy
Financial: price, financial performance, payment methods
Price: competitive price
OUTSOURCING
Drivers
Economies of scale: reduce cost by demand aggregation.
Risk pooling: transfer risks to the supplier
Reduce investment:
– release resources
– cash flow
– Reduce head count
Focus in core competency
Increase flexibility
To respond to changes in the demand
Use Suppliers technical knowledge for innovation and time to market.
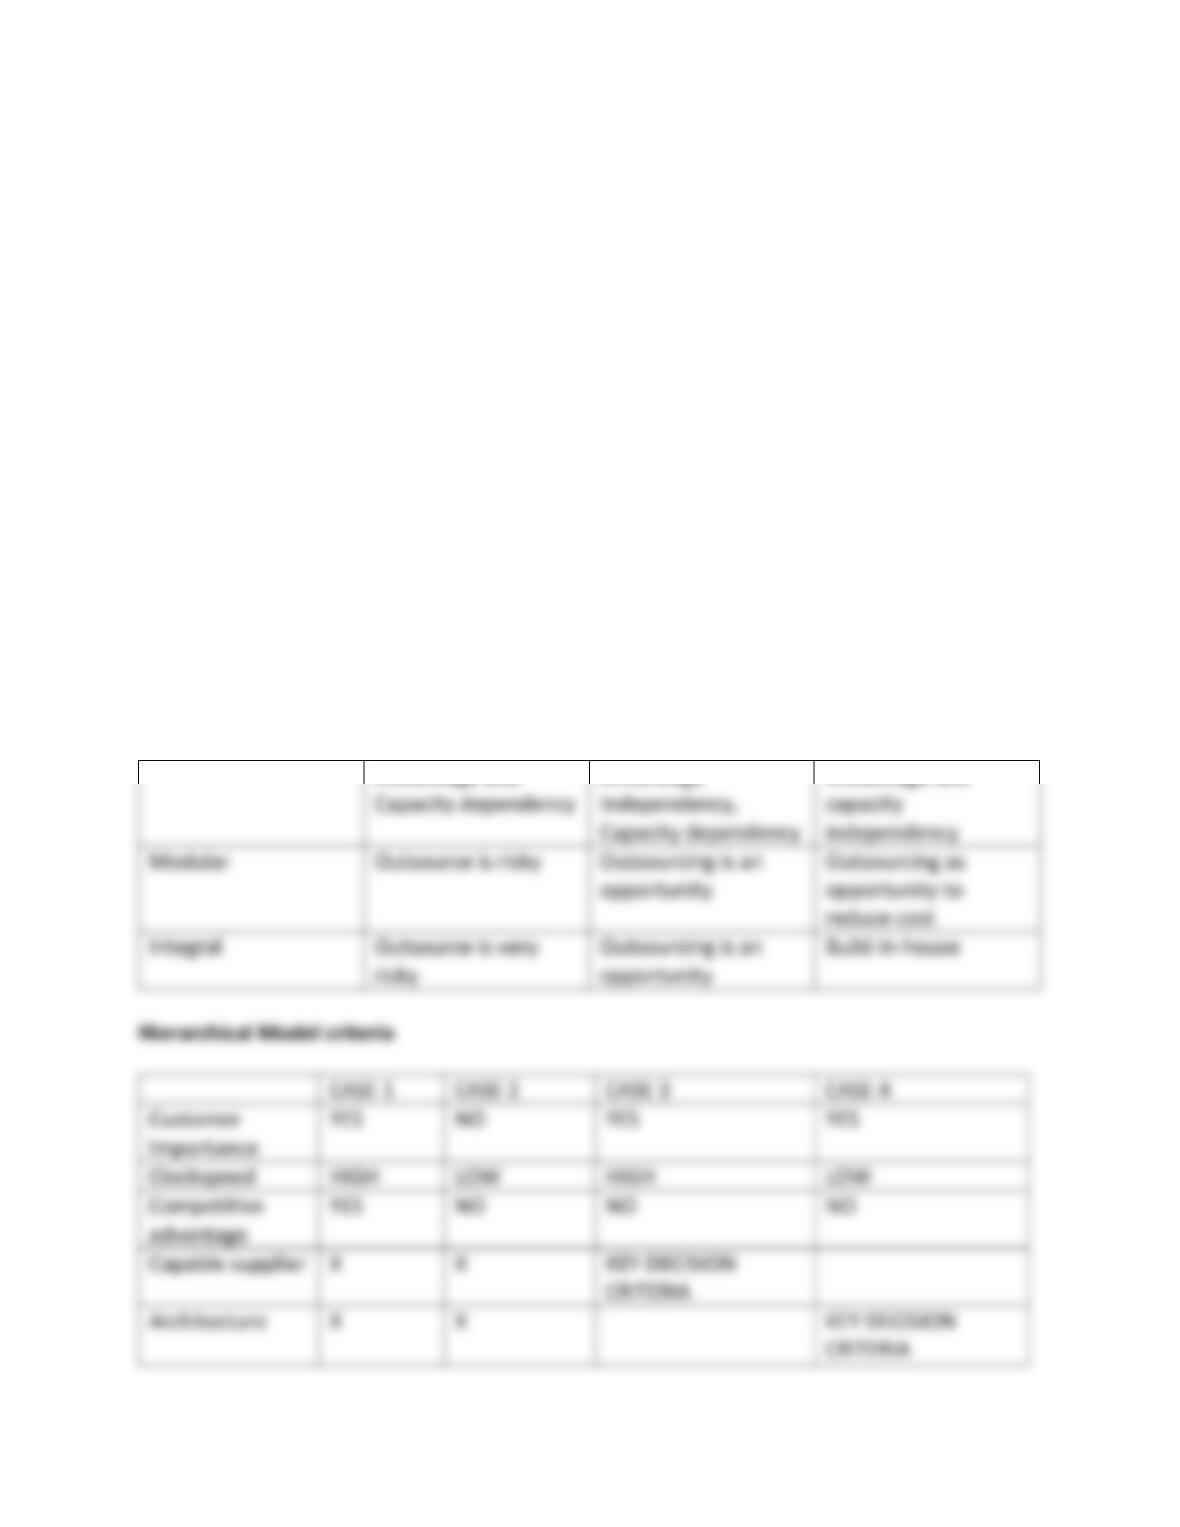
When to outsource?
Dependency Type
Knowledge Dependency: Do I know how to do it
Capability Dependency: Can I do it
Type of product
Modular
Integral
Evaluation Matrix