Operations Management: Sustainability
and Supply Chain Management
Thirteenth Edition, Global Edition
Chapter 7
Process Strategies
Copyright © 2020 Pearson Education Ltd. All Rights Reserved.
Copyright © 2020 Pearson Education Ltd. All Rights Reserved.
Outline (1 of 2)
•Global Company Profile: Harley-Davidson
•Four Process Strategies
•Selection of Equipment
•Process Analysis and Design
•Special Considerations for Service Process Strategies
Copyright © 2020 Pearson Education Ltd. All Rights Reserved.
Outline (2 of 2)
•Production Technology
•Technology in Services
•Process Redesign
Copyright © 2020 Pearson Education Ltd. All Rights Reserved.
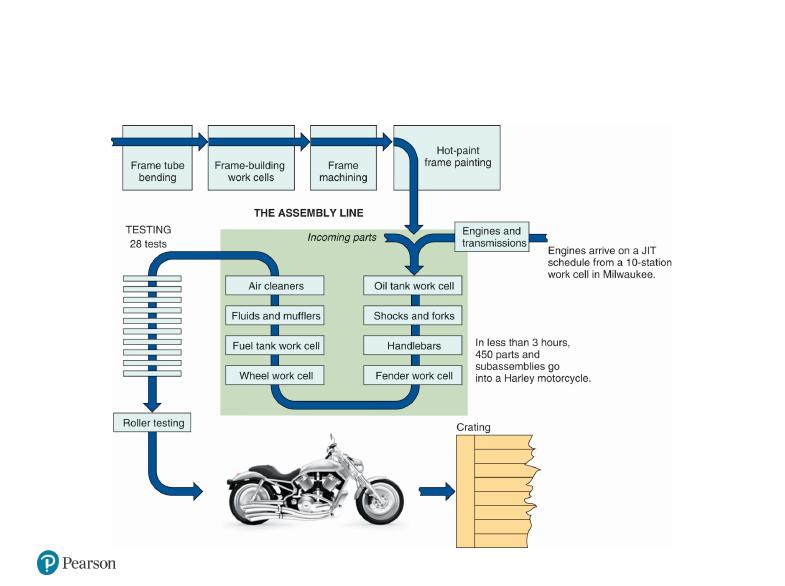
Harley-Davidson
•The only major U.S. motorcycle company
•Emphasizes quality and lean manufacturing
•Materials as Needed (MA N) system
•Many variations possible
•Tightly scheduled repetitive production
Copyright © 2020 Pearson Education Ltd. All Rights Reserved.
Process Flow Diagram
Copyright © 2020 Pearson Education Ltd. All Rights Reserved.
Learning Objectives
When you complete this chapter you should be able to:
7.1 Describe four process strategies
7.2 Compute crossover points for different processes
7.3 Use the tools of process analysis
7.4 Describe customer interaction in service processes
7.5 Identify recent advances in production technology
Copyright © 2020 Pearson Education Ltd. All Rights Reserved.
Process Strategy
The objective is to create a process to produce offerings that meet
customer requirements within cost and other managerial
constraints
Copyright © 2020 Pearson Education Ltd. All Rights Reserved.
Process Strategies (1 of 2)
•How to produce a product or provide a service that
–Meets or exceeds customer requirements
–Meets cost and managerial goals
•Has long-term effects on
–Efficiency and production flexibility
–Costs and quality
Copyright © 2020 Pearson Education Ltd. All Rights Reserved.
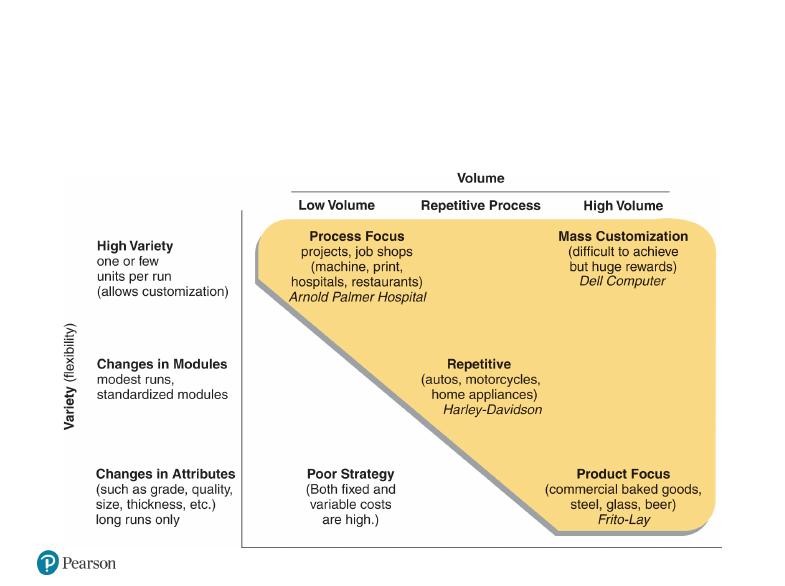
Process, Volume, and Variety
Figure 7.1
Copyright © 2020 Pearson Education Ltd. All Rights Reserved.
Process Strategies (2 of 2)
Four basic strategies
1. Process focus
2. Repetitive focus
3. Product focus
4. Mass customization
Within these basic strategies, there are many ways they
may be implemented
Copyright © 2020 Pearson Education Ltd. All Rights Reserved.
Process Focus (1 of 2)
•Facilities are organized around specific activities or
processes
•General purpose equipment and skilled personnel
•High degree of product flexibility
•Typically high variable costs and low equipment utilization
•Product flows may vary considerably, making planning and
scheduling a challenge
Copyright © 2020 Pearson Education Ltd. All Rights Reserved.
Process Focus (2 of 2)
Figure 7.2(a)
Copyright © 2020 Pearson Education Ltd. All Rights Reserved.
Repetitive Focus (1 of 2)
•Facilities often organized as assembly lines
•Characterized by modules with parts and assemblies made
previously
•Modules may be combined for many output options
•Less flexibility than process-focused facilities but more
efficient
Copyright © 2020 Pearson Education Ltd. All Rights Reserved.
Repetitive Focus (2 of 2)
Figure 7.2(b)
Copyright © 2020 Pearson Education Ltd. All Rights Reserved.
Product Focus (1 of 2)
•Facilities are organized by product
•High volume but low variety of products
•Long, continuous production runs enable efficient
processes
•Typically high fixed cost but low variable cost
•Generally less skilled labor
Copyright © 2020 Pearson Education Ltd. All Rights Reserved.
Product Focus (2 of 2)
Figure 7.2(c)
Copyright © 2020 Pearson Education Ltd. All Rights Reserved.
Mass Customization (1 of 4)
•The rapid, low-cost
production of goods and
services to satisfy
increasingly unique
customer desires
•Combines the flexibility of a
process focus with the
efficiency of a product focus

Operations Management: Sustainability
and Supply Chain Management
Thirteenth Edition, Global Edition
Chapter 7
Process Strategies
Copyright © 2020 Pearson Education Ltd. All Rights Reserved.
Copyright © 2020 Pearson Education Ltd. All Rights Reserved.
Outline (1 of 2)
•Global Company Profile: Harley-Davidson
•Four Process Strategies
•Selection of Equipment
•Process Analysis and Design
•Special Considerations for Service Process Strategies
Copyright © 2020 Pearson Education Ltd. All Rights Reserved.
Outline (2 of 2)
•Production Technology
•Technology in Services
•Process Redesign
Copyright © 2020 Pearson Education Ltd. All Rights Reserved.
Harley-Davidson
•The only major U.S. motorcycle company
•Emphasizes quality and lean manufacturing
•Materials as Needed (MA N) system
•Many variations possible
•Tightly scheduled repetitive production
Copyright © 2020 Pearson Education Ltd. All Rights Reserved.
Process Flow Diagram
Copyright © 2020 Pearson Education Ltd. All Rights Reserved.
Learning Objectives
When you complete this chapter you should be able to:
7.1 Describe four process strategies
7.2 Compute crossover points for different processes
7.3 Use the tools of process analysis
7.4 Describe customer interaction in service processes
7.5 Identify recent advances in production technology
Copyright © 2020 Pearson Education Ltd. All Rights Reserved.
Process Strategy
The objective is to create a process to produce offerings that meet
customer requirements within cost and other managerial
constraints
Copyright © 2020 Pearson Education Ltd. All Rights Reserved.
Process Strategies (1 of 2)
•How to produce a product or provide a service that
–Meets or exceeds customer requirements
–Meets cost and managerial goals
•Has long-term effects on
–Efficiency and production flexibility
–Costs and quality
Copyright © 2020 Pearson Education Ltd. All Rights Reserved.
Process, Volume, and Variety
Figure 7.1
Copyright © 2020 Pearson Education Ltd. All Rights Reserved.
Process Strategies (2 of 2)
Four basic strategies
1. Process focus
2. Repetitive focus
3. Product focus
4. Mass customization
Within these basic strategies, there are many ways they
may be implemented
Copyright © 2020 Pearson Education Ltd. All Rights Reserved.
Process Focus (1 of 2)
•Facilities are organized around specific activities or
processes
•General purpose equipment and skilled personnel
•High degree of product flexibility
•Typically high variable costs and low equipment utilization
•Product flows may vary considerably, making planning and
scheduling a challenge
Copyright © 2020 Pearson Education Ltd. All Rights Reserved.
Process Focus (2 of 2)
Figure 7.2(a)
Copyright © 2020 Pearson Education Ltd. All Rights Reserved.
Repetitive Focus (1 of 2)
•Facilities often organized as assembly lines
•Characterized by modules with parts and assemblies made
previously
•Modules may be combined for many output options
•Less flexibility than process-focused facilities but more
efficient
Copyright © 2020 Pearson Education Ltd. All Rights Reserved.
Repetitive Focus (2 of 2)
Figure 7.2(b)
Copyright © 2020 Pearson Education Ltd. All Rights Reserved.
Product Focus (1 of 2)
•Facilities are organized by product
•High volume but low variety of products
•Long, continuous production runs enable efficient
processes
•Typically high fixed cost but low variable cost
•Generally less skilled labor
Copyright © 2020 Pearson Education Ltd. All Rights Reserved.
Product Focus (2 of 2)
Figure 7.2(c)
Copyright © 2020 Pearson Education Ltd. All Rights Reserved.
Mass Customization (1 of 4)
•The rapid, low-cost
production of goods and
services to satisfy
increasingly unique
customer desires
•Combines the flexibility of a
process focus with the
efficiency of a product focus

Operations Management: Sustainability
and Supply Chain Management
Thirteenth Edition, Global Edition
Chapter 7
Process Strategies
Copyright © 2020 Pearson Education Ltd. All Rights Reserved.
Copyright © 2020 Pearson Education Ltd. All Rights Reserved.
Outline (1 of 2)
•Global Company Profile: Harley-Davidson
•Four Process Strategies
•Selection of Equipment
•Process Analysis and Design
•Special Considerations for Service Process Strategies
Copyright © 2020 Pearson Education Ltd. All Rights Reserved.
Outline (2 of 2)
•Production Technology
•Technology in Services
•Process Redesign
Copyright © 2020 Pearson Education Ltd. All Rights Reserved.
Harley-Davidson
•The only major U.S. motorcycle company
•Emphasizes quality and lean manufacturing
•Materials as Needed (MA N) system
•Many variations possible
•Tightly scheduled repetitive production
Copyright © 2020 Pearson Education Ltd. All Rights Reserved.
Process Flow Diagram
Copyright © 2020 Pearson Education Ltd. All Rights Reserved.
Learning Objectives
When you complete this chapter you should be able to:
7.1 Describe four process strategies
7.2 Compute crossover points for different processes
7.3 Use the tools of process analysis
7.4 Describe customer interaction in service processes
7.5 Identify recent advances in production technology
Copyright © 2020 Pearson Education Ltd. All Rights Reserved.
Process Strategy
The objective is to create a process to produce offerings that meet
customer requirements within cost and other managerial
constraints
Copyright © 2020 Pearson Education Ltd. All Rights Reserved.
Process Strategies (1 of 2)
•How to produce a product or provide a service that
–Meets or exceeds customer requirements
–Meets cost and managerial goals
•Has long-term effects on
–Efficiency and production flexibility
–Costs and quality
Copyright © 2020 Pearson Education Ltd. All Rights Reserved.
Process, Volume, and Variety
Figure 7.1
Copyright © 2020 Pearson Education Ltd. All Rights Reserved.
Process Strategies (2 of 2)
Four basic strategies
1. Process focus
2. Repetitive focus
3. Product focus
4. Mass customization
Within these basic strategies, there are many ways they
may be implemented
Copyright © 2020 Pearson Education Ltd. All Rights Reserved.
Process Focus (1 of 2)
•Facilities are organized around specific activities or
processes
•General purpose equipment and skilled personnel
•High degree of product flexibility
•Typically high variable costs and low equipment utilization
•Product flows may vary considerably, making planning and
scheduling a challenge
Copyright © 2020 Pearson Education Ltd. All Rights Reserved.
Process Focus (2 of 2)
Figure 7.2(a)
Copyright © 2020 Pearson Education Ltd. All Rights Reserved.
Repetitive Focus (1 of 2)
•Facilities often organized as assembly lines
•Characterized by modules with parts and assemblies made
previously
•Modules may be combined for many output options
•Less flexibility than process-focused facilities but more
efficient
Copyright © 2020 Pearson Education Ltd. All Rights Reserved.
Repetitive Focus (2 of 2)
Figure 7.2(b)
Copyright © 2020 Pearson Education Ltd. All Rights Reserved.
Product Focus (1 of 2)
•Facilities are organized by product
•High volume but low variety of products
•Long, continuous production runs enable efficient
processes
•Typically high fixed cost but low variable cost
•Generally less skilled labor
Copyright © 2020 Pearson Education Ltd. All Rights Reserved.
Product Focus (2 of 2)
Figure 7.2(c)
Copyright © 2020 Pearson Education Ltd. All Rights Reserved.
Mass Customization (1 of 4)
•The rapid, low-cost
production of goods and
services to satisfy
increasingly unique
customer desires
•Combines the flexibility of a
process focus with the
efficiency of a product focus

Operations Management: Sustainability
and Supply Chain Management
Thirteenth Edition, Global Edition
Chapter 7
Process Strategies
Copyright © 2020 Pearson Education Ltd. All Rights Reserved.
Copyright © 2020 Pearson Education Ltd. All Rights Reserved.
Outline (1 of 2)
•Global Company Profile: Harley-Davidson
•Four Process Strategies
•Selection of Equipment
•Process Analysis and Design
•Special Considerations for Service Process Strategies
Copyright © 2020 Pearson Education Ltd. All Rights Reserved.
Outline (2 of 2)
•Production Technology
•Technology in Services
•Process Redesign
Copyright © 2020 Pearson Education Ltd. All Rights Reserved.
Harley-Davidson
•The only major U.S. motorcycle company
•Emphasizes quality and lean manufacturing
•Materials as Needed (MA N) system
•Many variations possible
•Tightly scheduled repetitive production
Copyright © 2020 Pearson Education Ltd. All Rights Reserved.
Process Flow Diagram
Copyright © 2020 Pearson Education Ltd. All Rights Reserved.
Learning Objectives
When you complete this chapter you should be able to:
7.1 Describe four process strategies
7.2 Compute crossover points for different processes
7.3 Use the tools of process analysis
7.4 Describe customer interaction in service processes
7.5 Identify recent advances in production technology
Copyright © 2020 Pearson Education Ltd. All Rights Reserved.
Process Strategy
The objective is to create a process to produce offerings that meet
customer requirements within cost and other managerial
constraints
Copyright © 2020 Pearson Education Ltd. All Rights Reserved.
Process Strategies (1 of 2)
•How to produce a product or provide a service that
–Meets or exceeds customer requirements
–Meets cost and managerial goals
•Has long-term effects on
–Efficiency and production flexibility
–Costs and quality
Copyright © 2020 Pearson Education Ltd. All Rights Reserved.
Process, Volume, and Variety
Figure 7.1
Copyright © 2020 Pearson Education Ltd. All Rights Reserved.
Process Strategies (2 of 2)
Four basic strategies
1. Process focus
2. Repetitive focus
3. Product focus
4. Mass customization
Within these basic strategies, there are many ways they
may be implemented
Copyright © 2020 Pearson Education Ltd. All Rights Reserved.
Process Focus (1 of 2)
•Facilities are organized around specific activities or
processes
•General purpose equipment and skilled personnel
•High degree of product flexibility
•Typically high variable costs and low equipment utilization
•Product flows may vary considerably, making planning and
scheduling a challenge
Copyright © 2020 Pearson Education Ltd. All Rights Reserved.
Process Focus (2 of 2)
Figure 7.2(a)
Copyright © 2020 Pearson Education Ltd. All Rights Reserved.
Repetitive Focus (1 of 2)
•Facilities often organized as assembly lines
•Characterized by modules with parts and assemblies made
previously
•Modules may be combined for many output options
•Less flexibility than process-focused facilities but more
efficient
Copyright © 2020 Pearson Education Ltd. All Rights Reserved.
Repetitive Focus (2 of 2)
Figure 7.2(b)
Copyright © 2020 Pearson Education Ltd. All Rights Reserved.
Product Focus (1 of 2)
•Facilities are organized by product
•High volume but low variety of products
•Long, continuous production runs enable efficient
processes
•Typically high fixed cost but low variable cost
•Generally less skilled labor
Copyright © 2020 Pearson Education Ltd. All Rights Reserved.
Product Focus (2 of 2)
Figure 7.2(c)
Copyright © 2020 Pearson Education Ltd. All Rights Reserved.
Mass Customization (1 of 4)
•The rapid, low-cost
production of goods and
services to satisfy
increasingly unique
customer desires
•Combines the flexibility of a
process focus with the
efficiency of a product focus
Operations Management: Sustainability
and Supply Chain Management
Thirteenth Edition, Global Edition
Chapter 7
Process Strategies
Copyright © 2020 Pearson Education Ltd. All Rights Reserved.
Copyright © 2020 Pearson Education Ltd. All Rights Reserved.
Outline (1 of 2)
•Global Company Profile: Harley-Davidson
•Four Process Strategies
•Selection of Equipment
•Process Analysis and Design
•Special Considerations for Service Process Strategies
Copyright © 2020 Pearson Education Ltd. All Rights Reserved.
Outline (2 of 2)
•Production Technology
•Technology in Services
•Process Redesign
Copyright © 2020 Pearson Education Ltd. All Rights Reserved.
Harley-Davidson
•The only major U.S. motorcycle company
•Emphasizes quality and lean manufacturing
•Materials as Needed (MA N) system
•Many variations possible
•Tightly scheduled repetitive production
Copyright © 2020 Pearson Education Ltd. All Rights Reserved.
Process Flow Diagram
Copyright © 2020 Pearson Education Ltd. All Rights Reserved.
Learning Objectives
When you complete this chapter you should be able to:
7.1 Describe four process strategies
7.2 Compute crossover points for different processes
7.3 Use the tools of process analysis
7.4 Describe customer interaction in service processes
7.5 Identify recent advances in production technology
Copyright © 2020 Pearson Education Ltd. All Rights Reserved.
Process Strategy
The objective is to create a process to produce offerings that meet
customer requirements within cost and other managerial
constraints
Copyright © 2020 Pearson Education Ltd. All Rights Reserved.
Process Strategies (1 of 2)
•How to produce a product or provide a service that
–Meets or exceeds customer requirements
–Meets cost and managerial goals
•Has long-term effects on
–Efficiency and production flexibility
–Costs and quality
Copyright © 2020 Pearson Education Ltd. All Rights Reserved.
Process, Volume, and Variety
Figure 7.1
Copyright © 2020 Pearson Education Ltd. All Rights Reserved.
Process Strategies (2 of 2)
Four basic strategies
1. Process focus
2. Repetitive focus
3. Product focus
4. Mass customization
Within these basic strategies, there are many ways they
may be implemented
Copyright © 2020 Pearson Education Ltd. All Rights Reserved.
Process Focus (1 of 2)
•Facilities are organized around specific activities or
processes
•General purpose equipment and skilled personnel
•High degree of product flexibility
•Typically high variable costs and low equipment utilization
•Product flows may vary considerably, making planning and
scheduling a challenge
Copyright © 2020 Pearson Education Ltd. All Rights Reserved.
Process Focus (2 of 2)
Figure 7.2(a)
Copyright © 2020 Pearson Education Ltd. All Rights Reserved.
Repetitive Focus (1 of 2)
•Facilities often organized as assembly lines
•Characterized by modules with parts and assemblies made
previously
•Modules may be combined for many output options
•Less flexibility than process-focused facilities but more
efficient
Copyright © 2020 Pearson Education Ltd. All Rights Reserved.
Repetitive Focus (2 of 2)
Figure 7.2(b)
Copyright © 2020 Pearson Education Ltd. All Rights Reserved.
Product Focus (1 of 2)
•Facilities are organized by product
•High volume but low variety of products
•Long, continuous production runs enable efficient
processes
•Typically high fixed cost but low variable cost
•Generally less skilled labor
Copyright © 2020 Pearson Education Ltd. All Rights Reserved.
Product Focus (2 of 2)
Figure 7.2(c)
Copyright © 2020 Pearson Education Ltd. All Rights Reserved.
Mass Customization (1 of 4)
•The rapid, low-cost
production of goods and
services to satisfy
increasingly unique
customer desires
•Combines the flexibility of a
process focus with the
efficiency of a product focus

Operations Management: Sustainability
and Supply Chain Management
Thirteenth Edition, Global Edition
Chapter 7
Process Strategies
Copyright © 2020 Pearson Education Ltd. All Rights Reserved.
Copyright © 2020 Pearson Education Ltd. All Rights Reserved.
Outline (1 of 2)
•Global Company Profile: Harley-Davidson
•Four Process Strategies
•Selection of Equipment
•Process Analysis and Design
•Special Considerations for Service Process Strategies
Copyright © 2020 Pearson Education Ltd. All Rights Reserved.
Outline (2 of 2)
•Production Technology
•Technology in Services
•Process Redesign
Copyright © 2020 Pearson Education Ltd. All Rights Reserved.
Harley-Davidson
•The only major U.S. motorcycle company
•Emphasizes quality and lean manufacturing
•Materials as Needed (MA N) system
•Many variations possible
•Tightly scheduled repetitive production
Copyright © 2020 Pearson Education Ltd. All Rights Reserved.
Process Flow Diagram
Copyright © 2020 Pearson Education Ltd. All Rights Reserved.
Learning Objectives
When you complete this chapter you should be able to:
7.1 Describe four process strategies
7.2 Compute crossover points for different processes
7.3 Use the tools of process analysis
7.4 Describe customer interaction in service processes
7.5 Identify recent advances in production technology
Copyright © 2020 Pearson Education Ltd. All Rights Reserved.
Process Strategy
The objective is to create a process to produce offerings that meet
customer requirements within cost and other managerial
constraints
Copyright © 2020 Pearson Education Ltd. All Rights Reserved.
Process Strategies (1 of 2)
•How to produce a product or provide a service that
–Meets or exceeds customer requirements
–Meets cost and managerial goals
•Has long-term effects on
–Efficiency and production flexibility
–Costs and quality
Copyright © 2020 Pearson Education Ltd. All Rights Reserved.
Process, Volume, and Variety
Figure 7.1
Copyright © 2020 Pearson Education Ltd. All Rights Reserved.
Process Strategies (2 of 2)
Four basic strategies
1. Process focus
2. Repetitive focus
3. Product focus
4. Mass customization
Within these basic strategies, there are many ways they
may be implemented
Copyright © 2020 Pearson Education Ltd. All Rights Reserved.
Process Focus (1 of 2)
•Facilities are organized around specific activities or
processes
•General purpose equipment and skilled personnel
•High degree of product flexibility
•Typically high variable costs and low equipment utilization
•Product flows may vary considerably, making planning and
scheduling a challenge
Copyright © 2020 Pearson Education Ltd. All Rights Reserved.
Process Focus (2 of 2)
Figure 7.2(a)
Copyright © 2020 Pearson Education Ltd. All Rights Reserved.
Repetitive Focus (1 of 2)
•Facilities often organized as assembly lines
•Characterized by modules with parts and assemblies made
previously
•Modules may be combined for many output options
•Less flexibility than process-focused facilities but more
efficient
Copyright © 2020 Pearson Education Ltd. All Rights Reserved.
Repetitive Focus (2 of 2)
Figure 7.2(b)
Copyright © 2020 Pearson Education Ltd. All Rights Reserved.
Product Focus (1 of 2)
•Facilities are organized by product
•High volume but low variety of products
•Long, continuous production runs enable efficient
processes
•Typically high fixed cost but low variable cost
•Generally less skilled labor
Copyright © 2020 Pearson Education Ltd. All Rights Reserved.
Product Focus (2 of 2)
Figure 7.2(c)
Copyright © 2020 Pearson Education Ltd. All Rights Reserved.
Mass Customization (1 of 4)
•The rapid, low-cost
production of goods and
services to satisfy
increasingly unique
customer desires
•Combines the flexibility of a
process focus with the
efficiency of a product focus

Operations Management: Sustainability
and Supply Chain Management
Thirteenth Edition, Global Edition
Chapter 7
Process Strategies
Copyright © 2020 Pearson Education Ltd. All Rights Reserved.
Copyright © 2020 Pearson Education Ltd. All Rights Reserved.
Outline (1 of 2)
•Global Company Profile: Harley-Davidson
•Four Process Strategies
•Selection of Equipment
•Process Analysis and Design
•Special Considerations for Service Process Strategies
Copyright © 2020 Pearson Education Ltd. All Rights Reserved.
Outline (2 of 2)
•Production Technology
•Technology in Services
•Process Redesign
Copyright © 2020 Pearson Education Ltd. All Rights Reserved.
Harley-Davidson
•The only major U.S. motorcycle company
•Emphasizes quality and lean manufacturing
•Materials as Needed (MA N) system
•Many variations possible
•Tightly scheduled repetitive production
Copyright © 2020 Pearson Education Ltd. All Rights Reserved.
Process Flow Diagram
Copyright © 2020 Pearson Education Ltd. All Rights Reserved.
Learning Objectives
When you complete this chapter you should be able to:
7.1 Describe four process strategies
7.2 Compute crossover points for different processes
7.3 Use the tools of process analysis
7.4 Describe customer interaction in service processes
7.5 Identify recent advances in production technology
Copyright © 2020 Pearson Education Ltd. All Rights Reserved.
Process Strategy
The objective is to create a process to produce offerings that meet
customer requirements within cost and other managerial
constraints
Copyright © 2020 Pearson Education Ltd. All Rights Reserved.
Process Strategies (1 of 2)
•How to produce a product or provide a service that
–Meets or exceeds customer requirements
–Meets cost and managerial goals
•Has long-term effects on
–Efficiency and production flexibility
–Costs and quality
Copyright © 2020 Pearson Education Ltd. All Rights Reserved.
Process, Volume, and Variety
Figure 7.1
Copyright © 2020 Pearson Education Ltd. All Rights Reserved.
Process Strategies (2 of 2)
Four basic strategies
1. Process focus
2. Repetitive focus
3. Product focus
4. Mass customization
Within these basic strategies, there are many ways they
may be implemented
Copyright © 2020 Pearson Education Ltd. All Rights Reserved.
Process Focus (1 of 2)
•Facilities are organized around specific activities or
processes
•General purpose equipment and skilled personnel
•High degree of product flexibility
•Typically high variable costs and low equipment utilization
•Product flows may vary considerably, making planning and
scheduling a challenge
Copyright © 2020 Pearson Education Ltd. All Rights Reserved.
Process Focus (2 of 2)
Figure 7.2(a)
Copyright © 2020 Pearson Education Ltd. All Rights Reserved.
Repetitive Focus (1 of 2)
•Facilities often organized as assembly lines
•Characterized by modules with parts and assemblies made
previously
•Modules may be combined for many output options
•Less flexibility than process-focused facilities but more
efficient
Copyright © 2020 Pearson Education Ltd. All Rights Reserved.
Repetitive Focus (2 of 2)
Figure 7.2(b)
Copyright © 2020 Pearson Education Ltd. All Rights Reserved.
Product Focus (1 of 2)
•Facilities are organized by product
•High volume but low variety of products
•Long, continuous production runs enable efficient
processes
•Typically high fixed cost but low variable cost
•Generally less skilled labor
Copyright © 2020 Pearson Education Ltd. All Rights Reserved.
Product Focus (2 of 2)
Figure 7.2(c)
Copyright © 2020 Pearson Education Ltd. All Rights Reserved.
Mass Customization (1 of 4)
•The rapid, low-cost
production of goods and
services to satisfy
increasingly unique
customer desires
•Combines the flexibility of a
process focus with the
efficiency of a product focus

Operations Management: Sustainability
and Supply Chain Management
Thirteenth Edition, Global Edition
Chapter 7
Process Strategies
Copyright © 2020 Pearson Education Ltd. All Rights Reserved.
Copyright © 2020 Pearson Education Ltd. All Rights Reserved.
Outline (1 of 2)
•Global Company Profile: Harley-Davidson
•Four Process Strategies
•Selection of Equipment
•Process Analysis and Design
•Special Considerations for Service Process Strategies
Copyright © 2020 Pearson Education Ltd. All Rights Reserved.
Outline (2 of 2)
•Production Technology
•Technology in Services
•Process Redesign
Copyright © 2020 Pearson Education Ltd. All Rights Reserved.
Harley-Davidson
•The only major U.S. motorcycle company
•Emphasizes quality and lean manufacturing
•Materials as Needed (MA N) system
•Many variations possible
•Tightly scheduled repetitive production
Copyright © 2020 Pearson Education Ltd. All Rights Reserved.
Process Flow Diagram
Copyright © 2020 Pearson Education Ltd. All Rights Reserved.
Learning Objectives
When you complete this chapter you should be able to:
7.1 Describe four process strategies
7.2 Compute crossover points for different processes
7.3 Use the tools of process analysis
7.4 Describe customer interaction in service processes
7.5 Identify recent advances in production technology
Copyright © 2020 Pearson Education Ltd. All Rights Reserved.
Process Strategy
The objective is to create a process to produce offerings that meet
customer requirements within cost and other managerial
constraints
Copyright © 2020 Pearson Education Ltd. All Rights Reserved.
Process Strategies (1 of 2)
•How to produce a product or provide a service that
–Meets or exceeds customer requirements
–Meets cost and managerial goals
•Has long-term effects on
–Efficiency and production flexibility
–Costs and quality
Copyright © 2020 Pearson Education Ltd. All Rights Reserved.
Process, Volume, and Variety
Figure 7.1
Copyright © 2020 Pearson Education Ltd. All Rights Reserved.
Process Strategies (2 of 2)
Four basic strategies
1. Process focus
2. Repetitive focus
3. Product focus
4. Mass customization
Within these basic strategies, there are many ways they
may be implemented
Copyright © 2020 Pearson Education Ltd. All Rights Reserved.
Process Focus (1 of 2)
•Facilities are organized around specific activities or
processes
•General purpose equipment and skilled personnel
•High degree of product flexibility
•Typically high variable costs and low equipment utilization
•Product flows may vary considerably, making planning and
scheduling a challenge
Copyright © 2020 Pearson Education Ltd. All Rights Reserved.
Process Focus (2 of 2)
Figure 7.2(a)
Copyright © 2020 Pearson Education Ltd. All Rights Reserved.
Repetitive Focus (1 of 2)
•Facilities often organized as assembly lines
•Characterized by modules with parts and assemblies made
previously
•Modules may be combined for many output options
•Less flexibility than process-focused facilities but more
efficient
Copyright © 2020 Pearson Education Ltd. All Rights Reserved.
Repetitive Focus (2 of 2)
Figure 7.2(b)
Copyright © 2020 Pearson Education Ltd. All Rights Reserved.
Product Focus (1 of 2)
•Facilities are organized by product
•High volume but low variety of products
•Long, continuous production runs enable efficient
processes
•Typically high fixed cost but low variable cost
•Generally less skilled labor
Copyright © 2020 Pearson Education Ltd. All Rights Reserved.
Product Focus (2 of 2)
Figure 7.2(c)
Copyright © 2020 Pearson Education Ltd. All Rights Reserved.
Mass Customization (1 of 4)
•The rapid, low-cost
production of goods and
services to satisfy
increasingly unique
customer desires
•Combines the flexibility of a
process focus with the
efficiency of a product focus
Operations Management: Sustainability
and Supply Chain Management
Thirteenth Edition, Global Edition
Chapter 7
Process Strategies
Copyright © 2020 Pearson Education Ltd. All Rights Reserved.
Copyright © 2020 Pearson Education Ltd. All Rights Reserved.
Outline (1 of 2)
•Global Company Profile: Harley-Davidson
•Four Process Strategies
•Selection of Equipment
•Process Analysis and Design
•Special Considerations for Service Process Strategies
Copyright © 2020 Pearson Education Ltd. All Rights Reserved.
Outline (2 of 2)
•Production Technology
•Technology in Services
•Process Redesign
Copyright © 2020 Pearson Education Ltd. All Rights Reserved.
Harley-Davidson
•The only major U.S. motorcycle company
•Emphasizes quality and lean manufacturing
•Materials as Needed (MA N) system
•Many variations possible
•Tightly scheduled repetitive production
Copyright © 2020 Pearson Education Ltd. All Rights Reserved.
Process Flow Diagram
Copyright © 2020 Pearson Education Ltd. All Rights Reserved.
Learning Objectives
When you complete this chapter you should be able to:
7.1 Describe four process strategies
7.2 Compute crossover points for different processes
7.3 Use the tools of process analysis
7.4 Describe customer interaction in service processes
7.5 Identify recent advances in production technology
Copyright © 2020 Pearson Education Ltd. All Rights Reserved.
Process Strategy
The objective is to create a process to produce offerings that meet
customer requirements within cost and other managerial
constraints
Copyright © 2020 Pearson Education Ltd. All Rights Reserved.
Process Strategies (1 of 2)
•How to produce a product or provide a service that
–Meets or exceeds customer requirements
–Meets cost and managerial goals
•Has long-term effects on
–Efficiency and production flexibility
–Costs and quality
Copyright © 2020 Pearson Education Ltd. All Rights Reserved.
Process, Volume, and Variety
Figure 7.1
Copyright © 2020 Pearson Education Ltd. All Rights Reserved.
Process Strategies (2 of 2)
Four basic strategies
1. Process focus
2. Repetitive focus
3. Product focus
4. Mass customization
Within these basic strategies, there are many ways they
may be implemented
Copyright © 2020 Pearson Education Ltd. All Rights Reserved.
Process Focus (1 of 2)
•Facilities are organized around specific activities or
processes
•General purpose equipment and skilled personnel
•High degree of product flexibility
•Typically high variable costs and low equipment utilization
•Product flows may vary considerably, making planning and
scheduling a challenge
Copyright © 2020 Pearson Education Ltd. All Rights Reserved.
Process Focus (2 of 2)
Figure 7.2(a)
Copyright © 2020 Pearson Education Ltd. All Rights Reserved.
Repetitive Focus (1 of 2)
•Facilities often organized as assembly lines
•Characterized by modules with parts and assemblies made
previously
•Modules may be combined for many output options
•Less flexibility than process-focused facilities but more
efficient
Copyright © 2020 Pearson Education Ltd. All Rights Reserved.
Repetitive Focus (2 of 2)
Figure 7.2(b)
Copyright © 2020 Pearson Education Ltd. All Rights Reserved.
Product Focus (1 of 2)
•Facilities are organized by product
•High volume but low variety of products
•Long, continuous production runs enable efficient
processes
•Typically high fixed cost but low variable cost
•Generally less skilled labor
Copyright © 2020 Pearson Education Ltd. All Rights Reserved.
Product Focus (2 of 2)
Figure 7.2(c)
Copyright © 2020 Pearson Education Ltd. All Rights Reserved.
Mass Customization (1 of 4)
•The rapid, low-cost
production of goods and
services to satisfy
increasingly unique
customer desires
•Combines the flexibility of a
process focus with the
efficiency of a product focus

Operations Management: Sustainability
and Supply Chain Management
Thirteenth Edition, Global Edition
Chapter 7
Process Strategies
Copyright © 2020 Pearson Education Ltd. All Rights Reserved.
Copyright © 2020 Pearson Education Ltd. All Rights Reserved.
Outline (1 of 2)
•Global Company Profile: Harley-Davidson
•Four Process Strategies
•Selection of Equipment
•Process Analysis and Design
•Special Considerations for Service Process Strategies
Copyright © 2020 Pearson Education Ltd. All Rights Reserved.
Outline (2 of 2)
•Production Technology
•Technology in Services
•Process Redesign
Copyright © 2020 Pearson Education Ltd. All Rights Reserved.
Harley-Davidson
•The only major U.S. motorcycle company
•Emphasizes quality and lean manufacturing
•Materials as Needed (MA N) system
•Many variations possible
•Tightly scheduled repetitive production
Copyright © 2020 Pearson Education Ltd. All Rights Reserved.
Process Flow Diagram
Copyright © 2020 Pearson Education Ltd. All Rights Reserved.
Learning Objectives
When you complete this chapter you should be able to:
7.1 Describe four process strategies
7.2 Compute crossover points for different processes
7.3 Use the tools of process analysis
7.4 Describe customer interaction in service processes
7.5 Identify recent advances in production technology
Copyright © 2020 Pearson Education Ltd. All Rights Reserved.
Process Strategy
The objective is to create a process to produce offerings that meet
customer requirements within cost and other managerial
constraints
Copyright © 2020 Pearson Education Ltd. All Rights Reserved.
Process Strategies (1 of 2)
•How to produce a product or provide a service that
–Meets or exceeds customer requirements
–Meets cost and managerial goals
•Has long-term effects on
–Efficiency and production flexibility
–Costs and quality
Copyright © 2020 Pearson Education Ltd. All Rights Reserved.
Process, Volume, and Variety
Figure 7.1
Copyright © 2020 Pearson Education Ltd. All Rights Reserved.
Process Strategies (2 of 2)
Four basic strategies
1. Process focus
2. Repetitive focus
3. Product focus
4. Mass customization
Within these basic strategies, there are many ways they
may be implemented
Copyright © 2020 Pearson Education Ltd. All Rights Reserved.
Process Focus (1 of 2)
•Facilities are organized around specific activities or
processes
•General purpose equipment and skilled personnel
•High degree of product flexibility
•Typically high variable costs and low equipment utilization
•Product flows may vary considerably, making planning and
scheduling a challenge
Copyright © 2020 Pearson Education Ltd. All Rights Reserved.
Process Focus (2 of 2)
Figure 7.2(a)
Copyright © 2020 Pearson Education Ltd. All Rights Reserved.
Repetitive Focus (1 of 2)
•Facilities often organized as assembly lines
•Characterized by modules with parts and assemblies made
previously
•Modules may be combined for many output options
•Less flexibility than process-focused facilities but more
efficient
Copyright © 2020 Pearson Education Ltd. All Rights Reserved.
Repetitive Focus (2 of 2)
Figure 7.2(b)
Copyright © 2020 Pearson Education Ltd. All Rights Reserved.
Product Focus (1 of 2)
•Facilities are organized by product
•High volume but low variety of products
•Long, continuous production runs enable efficient
processes
•Typically high fixed cost but low variable cost
•Generally less skilled labor
Copyright © 2020 Pearson Education Ltd. All Rights Reserved.
Product Focus (2 of 2)
Figure 7.2(c)
Copyright © 2020 Pearson Education Ltd. All Rights Reserved.
Mass Customization (1 of 4)
•The rapid, low-cost
production of goods and
services to satisfy
increasingly unique
customer desires
•Combines the flexibility of a
process focus with the
efficiency of a product focus

Operations Management: Sustainability
and Supply Chain Management
Thirteenth Edition, Global Edition
Chapter 7
Process Strategies
Copyright © 2020 Pearson Education Ltd. All Rights Reserved.
Copyright © 2020 Pearson Education Ltd. All Rights Reserved.
Outline (1 of 2)
•Global Company Profile: Harley-Davidson
•Four Process Strategies
•Selection of Equipment
•Process Analysis and Design
•Special Considerations for Service Process Strategies
Copyright © 2020 Pearson Education Ltd. All Rights Reserved.
Outline (2 of 2)
•Production Technology
•Technology in Services
•Process Redesign
Copyright © 2020 Pearson Education Ltd. All Rights Reserved.
Harley-Davidson
•The only major U.S. motorcycle company
•Emphasizes quality and lean manufacturing
•Materials as Needed (MA N) system
•Many variations possible
•Tightly scheduled repetitive production
Copyright © 2020 Pearson Education Ltd. All Rights Reserved.
Process Flow Diagram
Copyright © 2020 Pearson Education Ltd. All Rights Reserved.
Learning Objectives
When you complete this chapter you should be able to:
7.1 Describe four process strategies
7.2 Compute crossover points for different processes
7.3 Use the tools of process analysis
7.4 Describe customer interaction in service processes
7.5 Identify recent advances in production technology
Copyright © 2020 Pearson Education Ltd. All Rights Reserved.
Process Strategy
The objective is to create a process to produce offerings that meet
customer requirements within cost and other managerial
constraints
Copyright © 2020 Pearson Education Ltd. All Rights Reserved.
Process Strategies (1 of 2)
•How to produce a product or provide a service that
–Meets or exceeds customer requirements
–Meets cost and managerial goals
•Has long-term effects on
–Efficiency and production flexibility
–Costs and quality
Copyright © 2020 Pearson Education Ltd. All Rights Reserved.
Process, Volume, and Variety
Figure 7.1
Copyright © 2020 Pearson Education Ltd. All Rights Reserved.
Process Strategies (2 of 2)
Four basic strategies
1. Process focus
2. Repetitive focus
3. Product focus
4. Mass customization
Within these basic strategies, there are many ways they
may be implemented
Copyright © 2020 Pearson Education Ltd. All Rights Reserved.
Process Focus (1 of 2)
•Facilities are organized around specific activities or
processes
•General purpose equipment and skilled personnel
•High degree of product flexibility
•Typically high variable costs and low equipment utilization
•Product flows may vary considerably, making planning and
scheduling a challenge
Copyright © 2020 Pearson Education Ltd. All Rights Reserved.
Process Focus (2 of 2)
Figure 7.2(a)
Copyright © 2020 Pearson Education Ltd. All Rights Reserved.
Repetitive Focus (1 of 2)
•Facilities often organized as assembly lines
•Characterized by modules with parts and assemblies made
previously
•Modules may be combined for many output options
•Less flexibility than process-focused facilities but more
efficient
Copyright © 2020 Pearson Education Ltd. All Rights Reserved.
Repetitive Focus (2 of 2)
Figure 7.2(b)
Copyright © 2020 Pearson Education Ltd. All Rights Reserved.
Product Focus (1 of 2)
•Facilities are organized by product
•High volume but low variety of products
•Long, continuous production runs enable efficient
processes
•Typically high fixed cost but low variable cost
•Generally less skilled labor
Copyright © 2020 Pearson Education Ltd. All Rights Reserved.
Product Focus (2 of 2)
Figure 7.2(c)
Copyright © 2020 Pearson Education Ltd. All Rights Reserved.
Mass Customization (1 of 4)
•The rapid, low-cost
production of goods and
services to satisfy
increasingly unique
customer desires
•Combines the flexibility of a
process focus with the
efficiency of a product focus

Operations Management: Sustainability
and Supply Chain Management
Thirteenth Edition, Global Edition
Chapter 7
Process Strategies
Copyright © 2020 Pearson Education Ltd. All Rights Reserved.
Copyright © 2020 Pearson Education Ltd. All Rights Reserved.
Outline (1 of 2)
•Global Company Profile: Harley-Davidson
•Four Process Strategies
•Selection of Equipment
•Process Analysis and Design
•Special Considerations for Service Process Strategies
Copyright © 2020 Pearson Education Ltd. All Rights Reserved.
Outline (2 of 2)
•Production Technology
•Technology in Services
•Process Redesign
Copyright © 2020 Pearson Education Ltd. All Rights Reserved.
Harley-Davidson
•The only major U.S. motorcycle company
•Emphasizes quality and lean manufacturing
•Materials as Needed (MA N) system
•Many variations possible
•Tightly scheduled repetitive production
Copyright © 2020 Pearson Education Ltd. All Rights Reserved.
Process Flow Diagram
Copyright © 2020 Pearson Education Ltd. All Rights Reserved.
Learning Objectives
When you complete this chapter you should be able to:
7.1 Describe four process strategies
7.2 Compute crossover points for different processes
7.3 Use the tools of process analysis
7.4 Describe customer interaction in service processes
7.5 Identify recent advances in production technology
Copyright © 2020 Pearson Education Ltd. All Rights Reserved.
Process Strategy
The objective is to create a process to produce offerings that meet
customer requirements within cost and other managerial
constraints
Copyright © 2020 Pearson Education Ltd. All Rights Reserved.
Process Strategies (1 of 2)
•How to produce a product or provide a service that
–Meets or exceeds customer requirements
–Meets cost and managerial goals
•Has long-term effects on
–Efficiency and production flexibility
–Costs and quality
Copyright © 2020 Pearson Education Ltd. All Rights Reserved.
Process, Volume, and Variety
Figure 7.1
Process Strategies (2 of 2)
Copyright © 2020 Pearson Education Ltd. All Rights Reserved.
Repetitive Focus (1 of 2)
•Facilities often organized as assembly lines
•Characterized by modules with parts and assemblies made
previously
•Modules may be combined for many output options
•Less flexibility than process-focused facilities but more
efficient
Copyright © 2020 Pearson Education Ltd. All Rights Reserved.
Repetitive Focus (2 of 2)
Figure 7.2(b)
Copyright © 2020 Pearson Education Ltd. All Rights Reserved.
Product Focus (1 of 2)
•Facilities are organized by product
•High volume but low variety of products
•Long, continuous production runs enable efficient
processes
•Typically high fixed cost but low variable cost
•Generally less skilled labor
Copyright © 2020 Pearson Education Ltd. All Rights Reserved.
Product Focus (2 of 2)
Figure 7.2(c)
Copyright © 2020 Pearson Education Ltd. All Rights Reserved.
Mass Customization (1 of 4)
•The rapid, low-cost
production of goods and
services to satisfy
increasingly unique
customer desires
•Combines the flexibility of a
process focus with the
efficiency of a product focus
Operations Management: Sustainability
and Supply Chain Management
Thirteenth Edition, Global Edition
Chapter 7
Process Strategies
Copyright © 2020 Pearson Education Ltd. All Rights Reserved.
Copyright © 2020 Pearson Education Ltd. All Rights Reserved.
Outline (1 of 2)
•Global Company Profile: Harley-Davidson
•Four Process Strategies
•Selection of Equipment
•Process Analysis and Design
•Special Considerations for Service Process Strategies
Copyright © 2020 Pearson Education Ltd. All Rights Reserved.
Outline (2 of 2)
•Production Technology
•Technology in Services
•Process Redesign
Copyright © 2020 Pearson Education Ltd. All Rights Reserved.
Harley-Davidson
•The only major U.S. motorcycle company
•Emphasizes quality and lean manufacturing
•Materials as Needed (MA N) system
•Many variations possible
•Tightly scheduled repetitive production
Copyright © 2020 Pearson Education Ltd. All Rights Reserved.
Process Flow Diagram
Copyright © 2020 Pearson Education Ltd. All Rights Reserved.
Learning Objectives
When you complete this chapter you should be able to:
7.1 Describe four process strategies
7.2 Compute crossover points for different processes
7.3 Use the tools of process analysis
7.4 Describe customer interaction in service processes
7.5 Identify recent advances in production technology
Copyright © 2020 Pearson Education Ltd. All Rights Reserved.
Process Strategy
The objective is to create a process to produce offerings that meet
customer requirements within cost and other managerial
constraints
Copyright © 2020 Pearson Education Ltd. All Rights Reserved.
Process Strategies (1 of 2)
•How to produce a product or provide a service that
–Meets or exceeds customer requirements
–Meets cost and managerial goals
•Has long-term effects on
–Efficiency and production flexibility
–Costs and quality
Copyright © 2020 Pearson Education Ltd. All Rights Reserved.
Process, Volume, and Variety
Figure 7.1
Copyright © 2020 Pearson Education Ltd. All Rights Reserved.
Process Strategies (2 of 2)
Four basic strategies
1. Process focus
2. Repetitive focus
3. Product focus
4. Mass customization
Within these basic strategies, there are many ways they
may be implemented
Process Focus (1 of 2)
•Facilities are organized around specific activities or
processes
•General purpose equipment and skilled personnel
•High degree of product flexibility
•Typically high variable costs and low equipment utilization
•Product flows may vary considerably, making planning and
scheduling a challenge
Copyright © 2020 Pearson Education Ltd. All Rights Reserved.
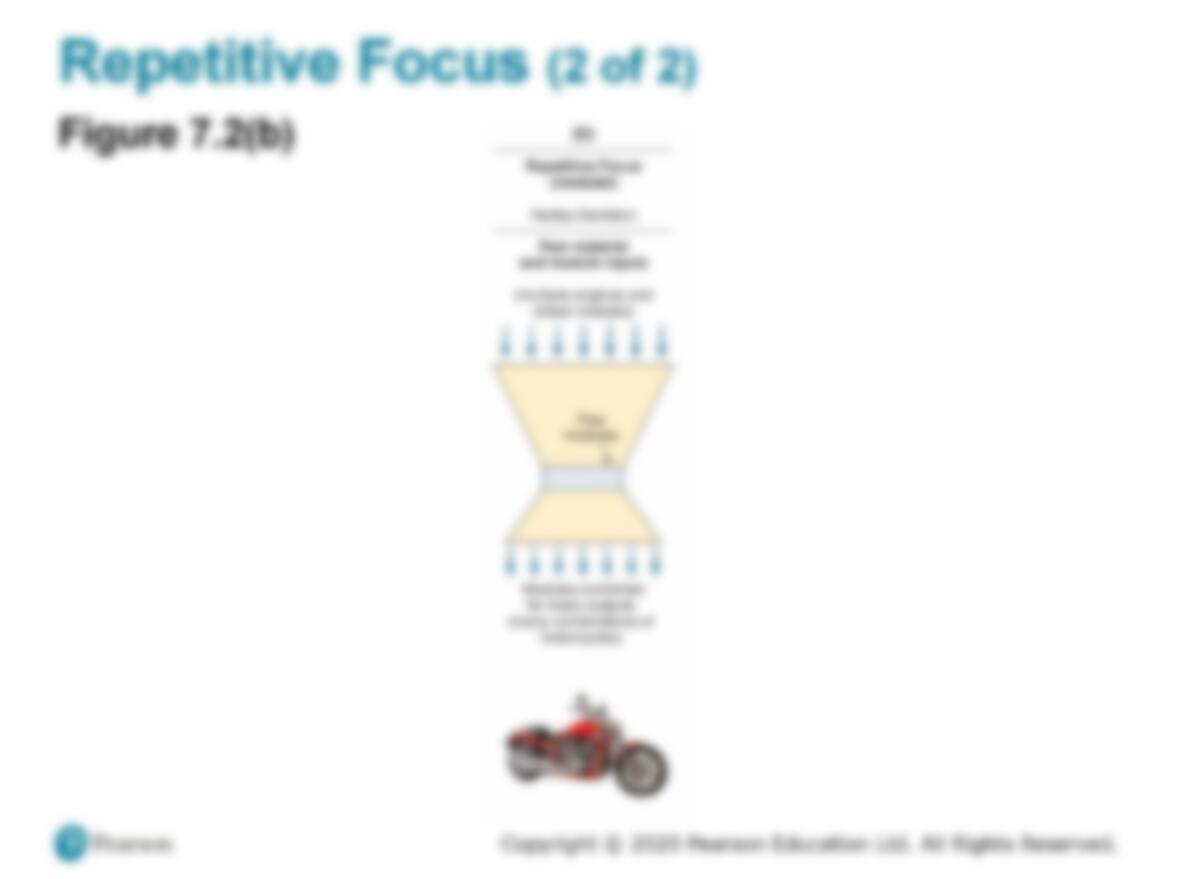
Repetitive Focus (2 of 2)
Figure 7.2(b)
Copyright © 2020 Pearson Education Ltd. All Rights Reserved.
Product Focus (1 of 2)
•Facilities are organized by product
•High volume but low variety of products
•Long, continuous production runs enable efficient
processes
•Typically high fixed cost but low variable cost
•Generally less skilled labor
Copyright © 2020 Pearson Education Ltd. All Rights Reserved.
Product Focus (2 of 2)
Figure 7.2(c)
Copyright © 2020 Pearson Education Ltd. All Rights Reserved.
Mass Customization (1 of 4)
•The rapid, low-cost
production of goods and
services to satisfy
increasingly unique
customer desires
•Combines the flexibility of a
process focus with the
efficiency of a product focus
Operations Management: Sustainability
and Supply Chain Management
Thirteenth Edition, Global Edition
Chapter 7
Process Strategies
Copyright © 2020 Pearson Education Ltd. All Rights Reserved.
Copyright © 2020 Pearson Education Ltd. All Rights Reserved.
Outline (1 of 2)
•Global Company Profile: Harley-Davidson
•Four Process Strategies
•Selection of Equipment
•Process Analysis and Design
•Special Considerations for Service Process Strategies
Copyright © 2020 Pearson Education Ltd. All Rights Reserved.
Outline (2 of 2)
•Production Technology
•Technology in Services
•Process Redesign
Copyright © 2020 Pearson Education Ltd. All Rights Reserved.
Harley-Davidson
•The only major U.S. motorcycle company
•Emphasizes quality and lean manufacturing
•Materials as Needed (MA N) system
•Many variations possible
•Tightly scheduled repetitive production
Copyright © 2020 Pearson Education Ltd. All Rights Reserved.
Process Flow Diagram
Copyright © 2020 Pearson Education Ltd. All Rights Reserved.
Learning Objectives
When you complete this chapter you should be able to:
7.1 Describe four process strategies
7.2 Compute crossover points for different processes
7.3 Use the tools of process analysis
7.4 Describe customer interaction in service processes
7.5 Identify recent advances in production technology
Copyright © 2020 Pearson Education Ltd. All Rights Reserved.
Process Strategy
The objective is to create a process to produce offerings that meet
customer requirements within cost and other managerial
constraints
Copyright © 2020 Pearson Education Ltd. All Rights Reserved.
Process Strategies (1 of 2)
•How to produce a product or provide a service that
–Meets or exceeds customer requirements
–Meets cost and managerial goals
•Has long-term effects on
–Efficiency and production flexibility
–Costs and quality
Copyright © 2020 Pearson Education Ltd. All Rights Reserved.
Process, Volume, and Variety
Figure 7.1
Copyright © 2020 Pearson Education Ltd. All Rights Reserved.
Process Strategies (2 of 2)
Four basic strategies
1. Process focus
2. Repetitive focus
3. Product focus
4. Mass customization
Within these basic strategies, there are many ways they
may be implemented
Copyright © 2020 Pearson Education Ltd. All Rights Reserved.
Process Focus (1 of 2)
•Facilities are organized around specific activities or
processes
•General purpose equipment and skilled personnel
•High degree of product flexibility
•Typically high variable costs and low equipment utilization
•Product flows may vary considerably, making planning and
scheduling a challenge
Process Focus (2 of 2)
Figure 7.2(a)
Copyright © 2020 Pearson Education Ltd. All Rights Reserved.
Product Focus (1 of 2)
•Facilities are organized by product
•High volume but low variety of products
•Long, continuous production runs enable efficient
processes
•Typically high fixed cost but low variable cost
•Generally less skilled labor
Copyright © 2020 Pearson Education Ltd. All Rights Reserved.
Product Focus (2 of 2)
Figure 7.2(c)
Copyright © 2020 Pearson Education Ltd. All Rights Reserved.
Mass Customization (1 of 4)
•The rapid, low-cost
production of goods and
services to satisfy
increasingly unique
customer desires
•Combines the flexibility of a
process focus with the
efficiency of a product focus
Operations Management: Sustainability
and Supply Chain Management
Thirteenth Edition, Global Edition
Chapter 7
Process Strategies
Copyright © 2020 Pearson Education Ltd. All Rights Reserved.
Copyright © 2020 Pearson Education Ltd. All Rights Reserved.
Outline (1 of 2)
•Global Company Profile: Harley-Davidson
•Four Process Strategies
•Selection of Equipment
•Process Analysis and Design
•Special Considerations for Service Process Strategies
Copyright © 2020 Pearson Education Ltd. All Rights Reserved.
Outline (2 of 2)
•Production Technology
•Technology in Services
•Process Redesign
Copyright © 2020 Pearson Education Ltd. All Rights Reserved.
Harley-Davidson
•The only major U.S. motorcycle company
•Emphasizes quality and lean manufacturing
•Materials as Needed (MA N) system
•Many variations possible
•Tightly scheduled repetitive production
Copyright © 2020 Pearson Education Ltd. All Rights Reserved.
Process Flow Diagram
Copyright © 2020 Pearson Education Ltd. All Rights Reserved.
Learning Objectives
When you complete this chapter you should be able to:
7.1 Describe four process strategies
7.2 Compute crossover points for different processes
7.3 Use the tools of process analysis
7.4 Describe customer interaction in service processes
7.5 Identify recent advances in production technology
Copyright © 2020 Pearson Education Ltd. All Rights Reserved.
Process Strategy
The objective is to create a process to produce offerings that meet
customer requirements within cost and other managerial
constraints
Copyright © 2020 Pearson Education Ltd. All Rights Reserved.
Process Strategies (1 of 2)
•How to produce a product or provide a service that
–Meets or exceeds customer requirements
–Meets cost and managerial goals
•Has long-term effects on
–Efficiency and production flexibility
–Costs and quality
Copyright © 2020 Pearson Education Ltd. All Rights Reserved.
Process, Volume, and Variety
Figure 7.1
Copyright © 2020 Pearson Education Ltd. All Rights Reserved.
Process Strategies (2 of 2)
Four basic strategies
1. Process focus
2. Repetitive focus
3. Product focus
4. Mass customization
Within these basic strategies, there are many ways they
may be implemented
Copyright © 2020 Pearson Education Ltd. All Rights Reserved.
Process Focus (1 of 2)
•Facilities are organized around specific activities or
processes
•General purpose equipment and skilled personnel
•High degree of product flexibility
•Typically high variable costs and low equipment utilization
•Product flows may vary considerably, making planning and
scheduling a challenge
Copyright © 2020 Pearson Education Ltd. All Rights Reserved.
Process Focus (2 of 2)
Figure 7.2(a)
Repetitive Focus (1 of 2)
•Facilities often organized as assembly lines
•Characterized by modules with parts and assemblies made
previously
•Modules may be combined for many output options
•Less flexibility than process-focused facilities but more
efficient
Copyright © 2020 Pearson Education Ltd. All Rights Reserved.
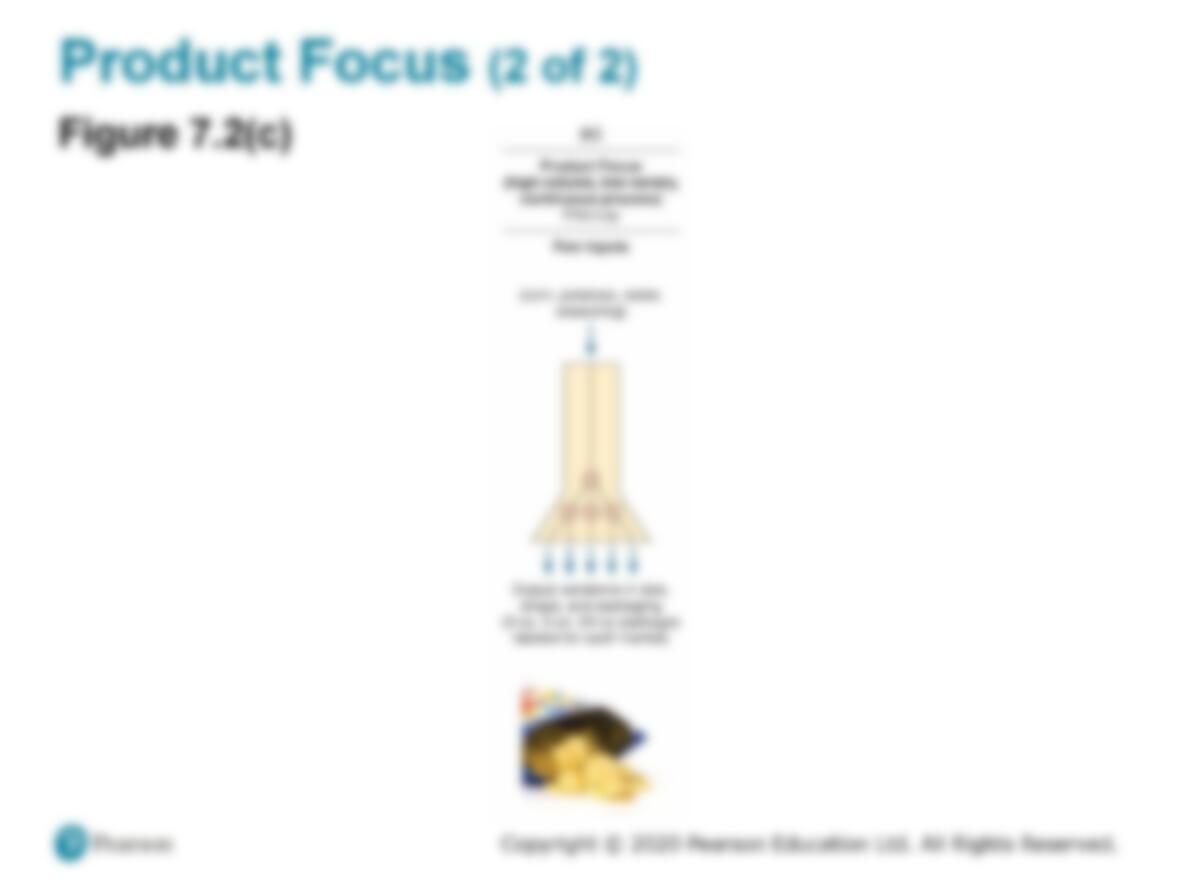
Product Focus (2 of 2)
Figure 7.2(c)
Copyright © 2020 Pearson Education Ltd. All Rights Reserved.
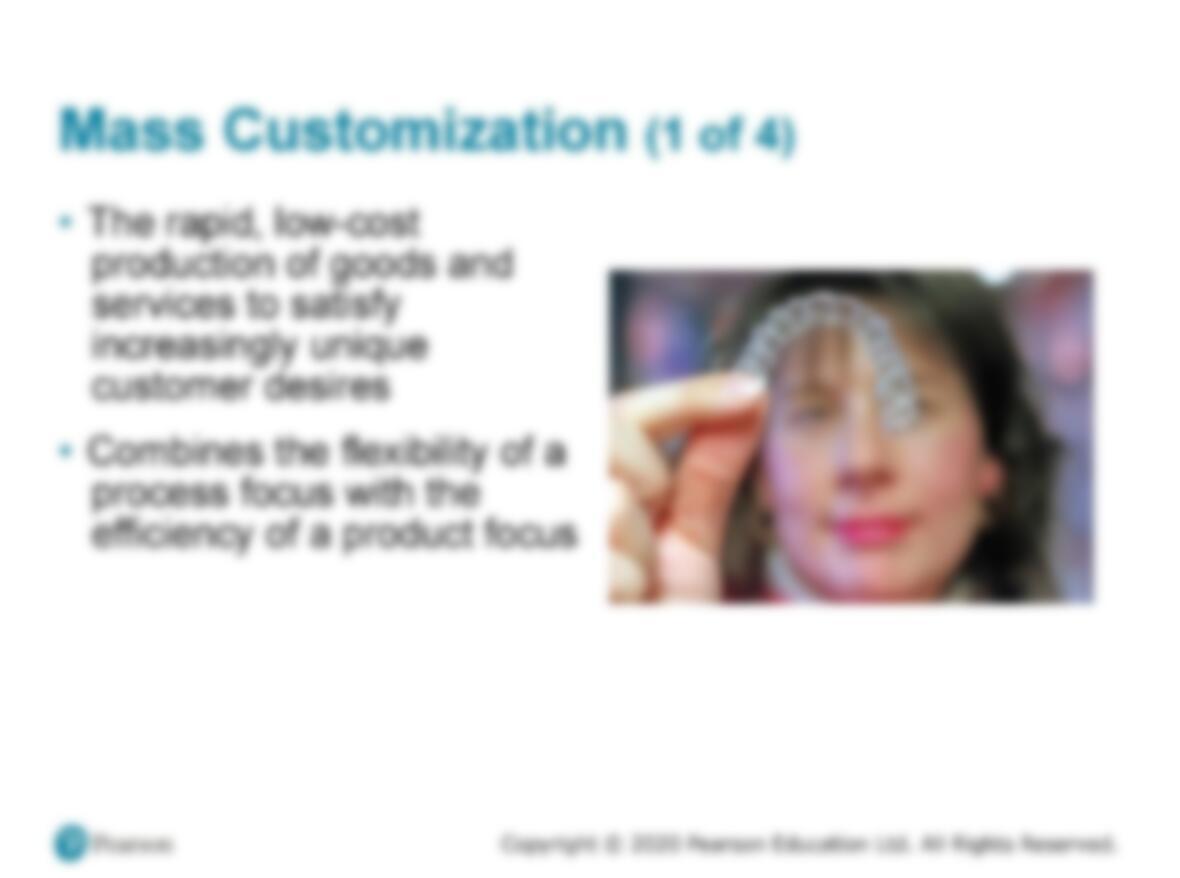
Mass Customization (1 of 4)
•The rapid, low-cost
production of goods and
services to satisfy
increasingly unique
customer desires
•Combines the flexibility of a
process focus with the
efficiency of a product focus
Operations Management: Sustainability
and Supply Chain Management
Thirteenth Edition, Global Edition
Chapter 7
Process Strategies
Copyright © 2020 Pearson Education Ltd. All Rights Reserved.
Copyright © 2020 Pearson Education Ltd. All Rights Reserved.
Outline (1 of 2)
•Global Company Profile: Harley-Davidson
•Four Process Strategies
•Selection of Equipment
•Process Analysis and Design
•Special Considerations for Service Process Strategies
Copyright © 2020 Pearson Education Ltd. All Rights Reserved.
Outline (2 of 2)
•Production Technology
•Technology in Services
•Process Redesign
Copyright © 2020 Pearson Education Ltd. All Rights Reserved.
Harley-Davidson
•The only major U.S. motorcycle company
•Emphasizes quality and lean manufacturing
•Materials as Needed (MA N) system
•Many variations possible
•Tightly scheduled repetitive production
Copyright © 2020 Pearson Education Ltd. All Rights Reserved.
Process Flow Diagram
Copyright © 2020 Pearson Education Ltd. All Rights Reserved.
Learning Objectives
When you complete this chapter you should be able to:
7.1 Describe four process strategies
7.2 Compute crossover points for different processes
7.3 Use the tools of process analysis
7.4 Describe customer interaction in service processes
7.5 Identify recent advances in production technology
Copyright © 2020 Pearson Education Ltd. All Rights Reserved.
Process Strategy
The objective is to create a process to produce offerings that meet
customer requirements within cost and other managerial
constraints
Copyright © 2020 Pearson Education Ltd. All Rights Reserved.
Process Strategies (1 of 2)
•How to produce a product or provide a service that
–Meets or exceeds customer requirements
–Meets cost and managerial goals
•Has long-term effects on
–Efficiency and production flexibility
–Costs and quality
Copyright © 2020 Pearson Education Ltd. All Rights Reserved.
Process, Volume, and Variety
Figure 7.1
Copyright © 2020 Pearson Education Ltd. All Rights Reserved.
Process Strategies (2 of 2)
Four basic strategies
1. Process focus
2. Repetitive focus
3. Product focus
4. Mass customization
Within these basic strategies, there are many ways they
may be implemented
Copyright © 2020 Pearson Education Ltd. All Rights Reserved.
Process Focus (1 of 2)
•Facilities are organized around specific activities or
processes
•General purpose equipment and skilled personnel
•High degree of product flexibility
•Typically high variable costs and low equipment utilization
•Product flows may vary considerably, making planning and
scheduling a challenge
Copyright © 2020 Pearson Education Ltd. All Rights Reserved.
Process Focus (2 of 2)
Figure 7.2(a)
Copyright © 2020 Pearson Education Ltd. All Rights Reserved.
Repetitive Focus (1 of 2)
•Facilities often organized as assembly lines
•Characterized by modules with parts and assemblies made
previously
•Modules may be combined for many output options
•Less flexibility than process-focused facilities but more
efficient
Repetitive Focus (2 of 2)
Figure 7.2(b)
Copyright © 2020 Pearson Education Ltd. All Rights Reserved.
Mass Customization (1 of 4)
•The rapid, low-cost
production of goods and
services to satisfy
increasingly unique
customer desires
•Combines the flexibility of a
process focus with the
efficiency of a product focus
Operations Management: Sustainability
and Supply Chain Management
Thirteenth Edition, Global Edition
Chapter 7
Process Strategies
Copyright © 2020 Pearson Education Ltd. All Rights Reserved.
Copyright © 2020 Pearson Education Ltd. All Rights Reserved.
Outline (1 of 2)
•Global Company Profile: Harley-Davidson
•Four Process Strategies
•Selection of Equipment
•Process Analysis and Design
•Special Considerations for Service Process Strategies
Copyright © 2020 Pearson Education Ltd. All Rights Reserved.
Outline (2 of 2)
•Production Technology
•Technology in Services
•Process Redesign
Copyright © 2020 Pearson Education Ltd. All Rights Reserved.
Harley-Davidson
•The only major U.S. motorcycle company
•Emphasizes quality and lean manufacturing
•Materials as Needed (MA N) system
•Many variations possible
•Tightly scheduled repetitive production
Copyright © 2020 Pearson Education Ltd. All Rights Reserved.
Process Flow Diagram
Copyright © 2020 Pearson Education Ltd. All Rights Reserved.
Learning Objectives
When you complete this chapter you should be able to:
7.1 Describe four process strategies
7.2 Compute crossover points for different processes
7.3 Use the tools of process analysis
7.4 Describe customer interaction in service processes
7.5 Identify recent advances in production technology
Copyright © 2020 Pearson Education Ltd. All Rights Reserved.
Process Strategy
The objective is to create a process to produce offerings that meet
customer requirements within cost and other managerial
constraints
Copyright © 2020 Pearson Education Ltd. All Rights Reserved.
Process Strategies (1 of 2)
•How to produce a product or provide a service that
–Meets or exceeds customer requirements
–Meets cost and managerial goals
•Has long-term effects on
–Efficiency and production flexibility
–Costs and quality
Copyright © 2020 Pearson Education Ltd. All Rights Reserved.
Process, Volume, and Variety
Figure 7.1
Copyright © 2020 Pearson Education Ltd. All Rights Reserved.
Process Strategies (2 of 2)
Four basic strategies
1. Process focus
2. Repetitive focus
3. Product focus
4. Mass customization
Within these basic strategies, there are many ways they
may be implemented
Copyright © 2020 Pearson Education Ltd. All Rights Reserved.
Process Focus (1 of 2)
•Facilities are organized around specific activities or
processes
•General purpose equipment and skilled personnel
•High degree of product flexibility
•Typically high variable costs and low equipment utilization
•Product flows may vary considerably, making planning and
scheduling a challenge
Copyright © 2020 Pearson Education Ltd. All Rights Reserved.
Process Focus (2 of 2)
Figure 7.2(a)
Copyright © 2020 Pearson Education Ltd. All Rights Reserved.
Repetitive Focus (1 of 2)
•Facilities often organized as assembly lines
•Characterized by modules with parts and assemblies made
previously
•Modules may be combined for many output options
•Less flexibility than process-focused facilities but more
efficient
Copyright © 2020 Pearson Education Ltd. All Rights Reserved.
Repetitive Focus (2 of 2)
Figure 7.2(b)
Product Focus (1 of 2)
•Facilities are organized by product
•High volume but low variety of products
•Long, continuous production runs enable efficient
processes
•Typically high fixed cost but low variable cost
•Generally less skilled labor
Operations Management: Sustainability
and Supply Chain Management
Thirteenth Edition, Global Edition
Chapter 7
Process Strategies
Copyright © 2020 Pearson Education Ltd. All Rights Reserved.
Copyright © 2020 Pearson Education Ltd. All Rights Reserved.
Outline (1 of 2)
•Global Company Profile: Harley-Davidson
•Four Process Strategies
•Selection of Equipment
•Process Analysis and Design
•Special Considerations for Service Process Strategies
Copyright © 2020 Pearson Education Ltd. All Rights Reserved.
Outline (2 of 2)
•Production Technology
•Technology in Services
•Process Redesign
Copyright © 2020 Pearson Education Ltd. All Rights Reserved.
Harley-Davidson
•The only major U.S. motorcycle company
•Emphasizes quality and lean manufacturing
•Materials as Needed (MA N) system
•Many variations possible
•Tightly scheduled repetitive production
Copyright © 2020 Pearson Education Ltd. All Rights Reserved.
Process Flow Diagram
Copyright © 2020 Pearson Education Ltd. All Rights Reserved.
Learning Objectives
When you complete this chapter you should be able to:
7.1 Describe four process strategies
7.2 Compute crossover points for different processes
7.3 Use the tools of process analysis
7.4 Describe customer interaction in service processes
7.5 Identify recent advances in production technology
Copyright © 2020 Pearson Education Ltd. All Rights Reserved.
Process Strategy
The objective is to create a process to produce offerings that meet
customer requirements within cost and other managerial
constraints
Copyright © 2020 Pearson Education Ltd. All Rights Reserved.
Process Strategies (1 of 2)
•How to produce a product or provide a service that
–Meets or exceeds customer requirements
–Meets cost and managerial goals
•Has long-term effects on
–Efficiency and production flexibility
–Costs and quality
Copyright © 2020 Pearson Education Ltd. All Rights Reserved.
Process, Volume, and Variety
Figure 7.1
Copyright © 2020 Pearson Education Ltd. All Rights Reserved.
Process Strategies (2 of 2)
Four basic strategies
1. Process focus
2. Repetitive focus
3. Product focus
4. Mass customization
Within these basic strategies, there are many ways they
may be implemented
Copyright © 2020 Pearson Education Ltd. All Rights Reserved.
Process Focus (1 of 2)
•Facilities are organized around specific activities or
processes
•General purpose equipment and skilled personnel
•High degree of product flexibility
•Typically high variable costs and low equipment utilization
•Product flows may vary considerably, making planning and
scheduling a challenge
Copyright © 2020 Pearson Education Ltd. All Rights Reserved.
Process Focus (2 of 2)
Figure 7.2(a)
Copyright © 2020 Pearson Education Ltd. All Rights Reserved.
Repetitive Focus (1 of 2)
•Facilities often organized as assembly lines
•Characterized by modules with parts and assemblies made
previously
•Modules may be combined for many output options
•Less flexibility than process-focused facilities but more
efficient
Copyright © 2020 Pearson Education Ltd. All Rights Reserved.
Repetitive Focus (2 of 2)
Figure 7.2(b)
Copyright © 2020 Pearson Education Ltd. All Rights Reserved.
Product Focus (1 of 2)
•Facilities are organized by product
•High volume but low variety of products
•Long, continuous production runs enable efficient
processes
•Typically high fixed cost but low variable cost
•Generally less skilled labor
Copyright © 2020 Pearson Education Ltd. All Rights Reserved.
Product Focus (2 of 2)
Figure 7.2(c)
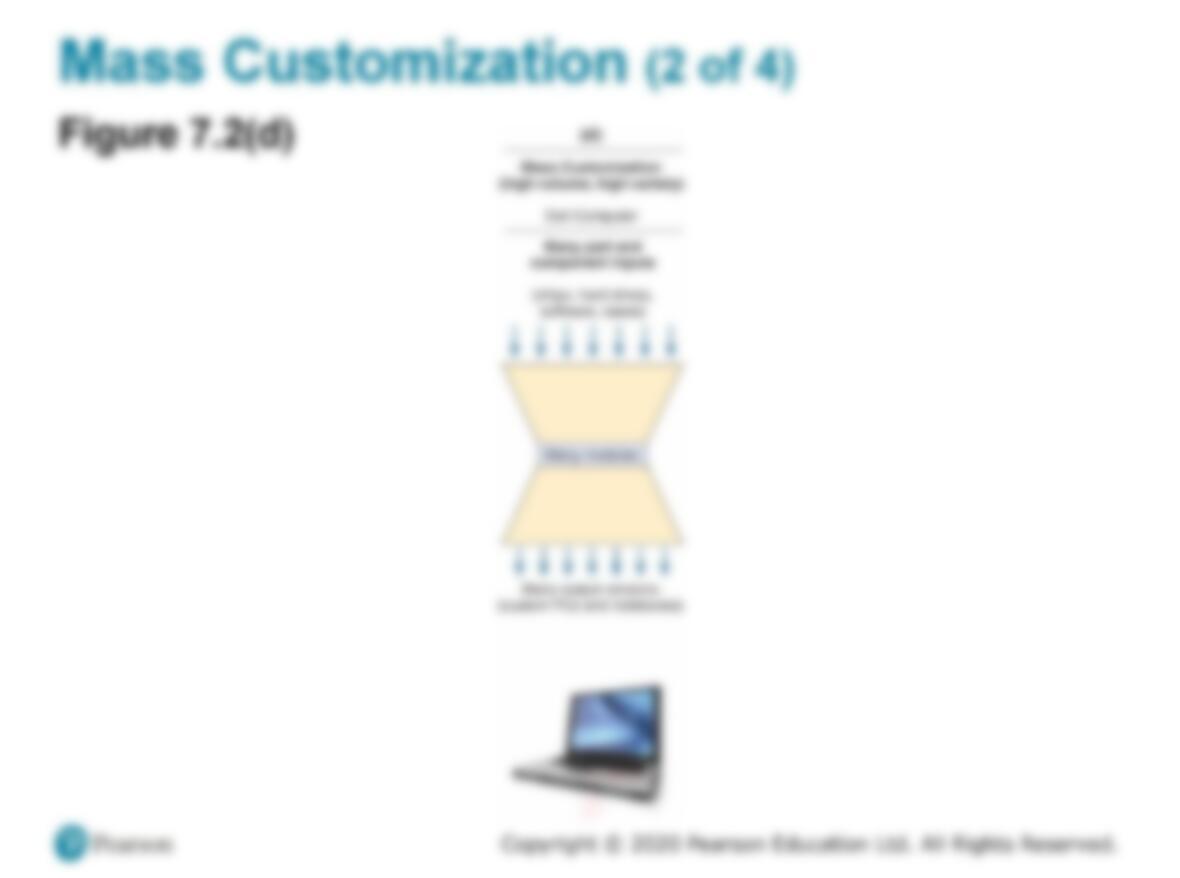
Mass Customization (1 of 4)
•The rapid, low-cost
production of goods and
services to satisfy
increasingly unique
customer desires
•Combines the flexibility of a
process focus with the
efficiency of a product focus
Copyright © 2020 Pearson Education Ltd. All Rights Reserved.
Mass Customization (3 of 4)
Table 7.1 Mass Customization Provides More Choices Than
Ever
Copyright © 2020 Pearson Education Ltd. All Rights Reserved.
Mass Customization (4 of 4)
•Imaginative product design
•Flexible process design
•Tightly controlled inventory management
•Tight schedules
•Responsive partners in the supply chain
Copyright © 2020 Pearson Education Ltd. All Rights Reserved.
Comparison of Processes (1 of 4)
Table 7.2 Comparison of the Characteristics of Four Types
of Processes
PROCESS FOCUS
(LOW-VOLUME,
HIGH-VARIETY; e.g.,
ARNOLD PALMER
HOSPITAL)
REPETITIVE FOCUS
(MODULAR; e.g.,
HARLEY-DAVIDSON)
PRODUCT FOCUS
(HIGH-VOLUME,
LOW-VARIETY; e.g.,
FRITO-LAY)
MASS
CUSTOMIZATION
(HIGH-VOLUME, HIGH-
VARIETY; e.g.,
DELL COMPUTER)
1. Small quantity
and large variety of
products
1. Long runs, a
standardized product
from modules
1. Large quantity and
small variety of
products
1. Large quantity and
large variety of
products
2. Broadly skilled
operators
2. Moderately trained
employees
2. Less broadly
skilled operators
2. Flexible operators
Copyright © 2020 Pearson Education Ltd. All Rights Reserved.
Comparison of Processes (2 of 4)
Table 7.2 Comparison of the Characteristics of Four Types
of Processes
PROCESS FOCUS
(LOW-VOLUME,
HIGH-VARIETY; e.g.,
ARNOLD PALMER
HOSPITAL)
REPETITIVE FOCUS
(MODULAR; e.g.,
HARLEY-DAVIDSON)
PRODUCT FOCUS
(HIGH-VOLUME,
LOW-VARIETY; e.g.,
FRITO-LAY)
MASS
CUSTOMIZATION
(HIGH-VOLUME, HIGH-
VARIETY; e.g.,
DELL COMPUTER)
3. Instructions for
each job
3. Few changes in
the instructions
3. Standardized job
instructions
3. Custom orders
requiring many job
instructions
4. High inventory 4. Low inventory 4. Low inventory 4. Low inventory
relative to the value of
the product
Copyright © 2020 Pearson Education Ltd. All Rights Reserved.
Comparison of Processes (3 of 4)
Table 7.2 Comparison of the Characteristics of Four Types
of Processes
PROCESS FOCUS
(LOW-VOLUME,
HIGH-VARIETY; e.g.,
ARNOLD PALMER
HOSPITAL)
REPETITIVE FOCUS
(MODULAR; e.g.,
HARLEY-DAVIDSON)
PRODUCT FOCUS
(HIGH-VOLUME,
LOW-VARIETY; e.g.,
FRITO-LAY)
MASS
CUSTOMIZATION
(HIGH-VOLUME, HIGH-
VARIETY; e.g.,
DELL COMPUTER)
5. Finished goods
are made to order
and not stored
5. Finished goods
are made to frequent
forecasts
5. Finished goods
are made to a
forecast and stored
5. Finished goods are
build-to-order (BTO)
6. Scheduling is
complex
6. Scheduling is
routine
6. Scheduling is
routine
6. Sophisticated
scheduling
accommodates
custom orders
Copyright © 2020 Pearson Education Ltd. All Rights Reserved.
Comparison of Processes (4 of 4)
Table 7.2 Comparison of the Characteristics of Four Types
of Processes
PROCESS FOCUS
(LOW-VOLUME,
HIGH-VARIETY; e.g.,
ARNOLD PALMER
HOSPITAL)
REPETITIVE FOCUS
(MODULAR; e.g.,
HARLEY-DAVIDSON)
PRODUCT FOCUS
(HIGH-VOLUME,
LOW-VARIETY; e.g.,
FRITO-LAY)
MASS
CUSTOMIZATION
(HIGH-VOLUME, HIGH-
VARIETY; e.g.,
DELL COMPUTER)
7. Fixed costs are
low and variable
costs high
7. Fixed costs are
dependent on
flexibility of the
facility
7. Fixed costs are
high and variable
costs low
7. Fixed costs tend to
be high and variable
costs low
Copyright © 2020 Pearson Education Ltd. All Rights Reserved.
Crossover Chart Example (1 of 2)
•Evaluate three different accounting software products
•Calculate crossover points between software A and B and
between software B and C
Blank TOTAL FIXED COST
DOLLARS REQUIRED PER
ACCOUNTING REPORT
Software A $200,000 $60
Software B $300,000 $25
Software C $400,000 $10
Copyright © 2020 Pearson Education Ltd. All Rights Reserved.
Crossover Chart Example (2 of 2)
•Software A is most economical from 0 to 2,857 reports
•Software B is most economical from 2,857 to 6,666 reports
Copyright © 2020 Pearson Education Ltd. All Rights Reserved.
Crossover Charts
Figure 7.3
Copyright © 2020 Pearson Education Ltd. All Rights Reserved.
Focused Processes
•Focus brings efficiency
•Focus on depth of product line rather than breadth
•Focus can be
–Customers
–Products
–Service
–Technology
Copyright © 2020 Pearson Education Ltd. All Rights Reserved.
Selection of Equipment
•Decisions can be complex as alternate methods may be
available
•Important factors may be
–Cost
–Cash flow
–Market stability
–Quality
–Capacity
–Flexibility
Copyright © 2020 Pearson Education Ltd. All Rights Reserved.
Flexibility
•Flexibility is the ability to
respond with little penalty in
time, cost, or customer
value
•May be a competitive
advantage
•May be difficult and
expensive
•Without it, change may
mean starting over
Copyright © 2020 Pearson Education Ltd. All Rights Reserved.
Process Analysis and Design (1 of 3)
•Is the process designed to achieve a competitive
advantage?
•Does the process eliminate steps that do not add value?
•Does the process maximize customer value?
•Will the process win orders?
Copyright © 2020 Pearson Education Ltd. All Rights Reserved.
Process Analysis and Design (2 of 3)
•Flowchart
–Shows the movement of materials
–Harley-Davidson flowchart
•Time-Function Mapping
–Shows flows and time frame
Copyright © 2020 Pearson Education Ltd. All Rights Reserved.
“Baseline” Time-Function Map
Figure 7.4(a)
Copyright © 2020 Pearson Education Ltd. All Rights Reserved.
“Target” Time-Function Map
Figure 7.4(b)
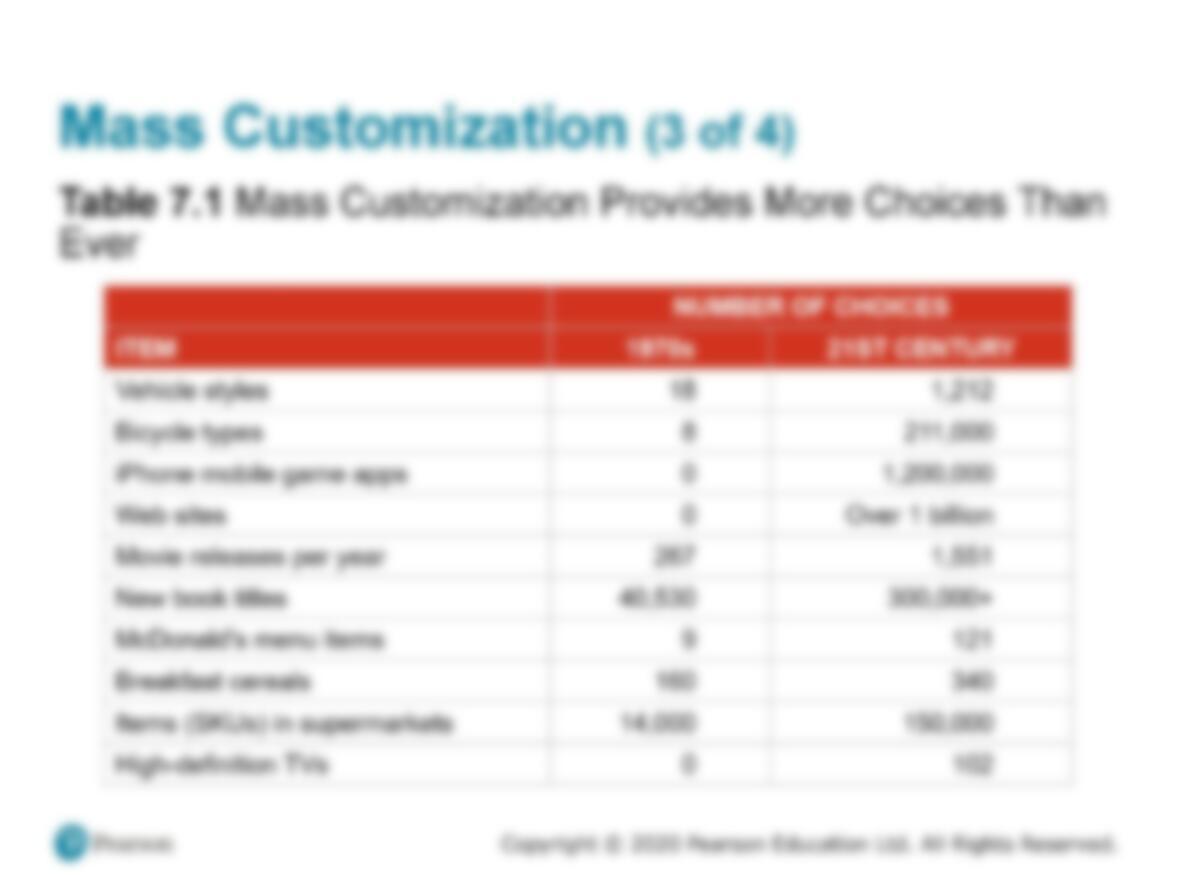
Copyright © 2020 Pearson Education Ltd. All Rights Reserved.
Mass Customization (4 of 4)
•Imaginative product design
•Flexible process design
•Tightly controlled inventory management
•Tight schedules
•Responsive partners in the supply chain
Copyright © 2020 Pearson Education Ltd. All Rights Reserved.
Comparison of Processes (1 of 4)
Table 7.2 Comparison of the Characteristics of Four Types
of Processes
PROCESS FOCUS
(LOW-VOLUME,
HIGH-VARIETY; e.g.,
ARNOLD PALMER
HOSPITAL)
REPETITIVE FOCUS
(MODULAR; e.g.,
HARLEY-DAVIDSON)
PRODUCT FOCUS
(HIGH-VOLUME,
LOW-VARIETY; e.g.,
FRITO-LAY)
MASS
CUSTOMIZATION
(HIGH-VOLUME, HIGH-
VARIETY; e.g.,
DELL COMPUTER)
1. Small quantity
and large variety of
products
1. Long runs, a
standardized product
from modules
1. Large quantity and
small variety of
products
1. Large quantity and
large variety of
products
2. Broadly skilled
operators
2. Moderately trained
employees
2. Less broadly
skilled operators
2. Flexible operators
Copyright © 2020 Pearson Education Ltd. All Rights Reserved.
Comparison of Processes (2 of 4)
Table 7.2 Comparison of the Characteristics of Four Types
of Processes
PROCESS FOCUS
(LOW-VOLUME,
HIGH-VARIETY; e.g.,
ARNOLD PALMER
HOSPITAL)
REPETITIVE FOCUS
(MODULAR; e.g.,
HARLEY-DAVIDSON)
PRODUCT FOCUS
(HIGH-VOLUME,
LOW-VARIETY; e.g.,
FRITO-LAY)
MASS
CUSTOMIZATION
(HIGH-VOLUME, HIGH-
VARIETY; e.g.,
DELL COMPUTER)
3. Instructions for
each job
3. Few changes in
the instructions
3. Standardized job
instructions
3. Custom orders
requiring many job
instructions
4. High inventory 4. Low inventory 4. Low inventory 4. Low inventory
relative to the value of
the product
Copyright © 2020 Pearson Education Ltd. All Rights Reserved.
Comparison of Processes (3 of 4)
Table 7.2 Comparison of the Characteristics of Four Types
of Processes
PROCESS FOCUS
(LOW-VOLUME,
HIGH-VARIETY; e.g.,
ARNOLD PALMER
HOSPITAL)
REPETITIVE FOCUS
(MODULAR; e.g.,
HARLEY-DAVIDSON)
PRODUCT FOCUS
(HIGH-VOLUME,
LOW-VARIETY; e.g.,
FRITO-LAY)
MASS
CUSTOMIZATION
(HIGH-VOLUME, HIGH-
VARIETY; e.g.,
DELL COMPUTER)
5. Finished goods
are made to order
and not stored
5. Finished goods
are made to frequent
forecasts
5. Finished goods
are made to a
forecast and stored
5. Finished goods are
build-to-order (BTO)
6. Scheduling is
complex
6. Scheduling is
routine
6. Scheduling is
routine
6. Sophisticated
scheduling
accommodates
custom orders
Copyright © 2020 Pearson Education Ltd. All Rights Reserved.
Comparison of Processes (4 of 4)
Table 7.2 Comparison of the Characteristics of Four Types
of Processes
PROCESS FOCUS
(LOW-VOLUME,
HIGH-VARIETY; e.g.,
ARNOLD PALMER
HOSPITAL)
REPETITIVE FOCUS
(MODULAR; e.g.,
HARLEY-DAVIDSON)
PRODUCT FOCUS
(HIGH-VOLUME,
LOW-VARIETY; e.g.,
FRITO-LAY)
MASS
CUSTOMIZATION
(HIGH-VOLUME, HIGH-
VARIETY; e.g.,
DELL COMPUTER)
7. Fixed costs are
low and variable
costs high
7. Fixed costs are
dependent on
flexibility of the
facility
7. Fixed costs are
high and variable
costs low
7. Fixed costs tend to
be high and variable
costs low
Copyright © 2020 Pearson Education Ltd. All Rights Reserved.
Crossover Chart Example (1 of 2)
•Evaluate three different accounting software products
•Calculate crossover points between software A and B and
between software B and C
Blank TOTAL FIXED COST
DOLLARS REQUIRED PER
ACCOUNTING REPORT
Software A $200,000 $60
Software B $300,000 $25
Software C $400,000 $10
Copyright © 2020 Pearson Education Ltd. All Rights Reserved.
Crossover Chart Example (2 of 2)
•Software A is most economical from 0 to 2,857 reports
•Software B is most economical from 2,857 to 6,666 reports
Copyright © 2020 Pearson Education Ltd. All Rights Reserved.
Crossover Charts
Figure 7.3
Copyright © 2020 Pearson Education Ltd. All Rights Reserved.
Focused Processes
•Focus brings efficiency
•Focus on depth of product line rather than breadth
•Focus can be
–Customers
–Products
–Service
–Technology
Copyright © 2020 Pearson Education Ltd. All Rights Reserved.
Selection of Equipment
•Decisions can be complex as alternate methods may be
available
•Important factors may be
–Cost
–Cash flow
–Market stability
–Quality
–Capacity
–Flexibility
Copyright © 2020 Pearson Education Ltd. All Rights Reserved.
Flexibility
•Flexibility is the ability to
respond with little penalty in
time, cost, or customer
value
•May be a competitive
advantage
•May be difficult and
expensive
•Without it, change may
mean starting over
Copyright © 2020 Pearson Education Ltd. All Rights Reserved.
Process Analysis and Design (1 of 3)
•Is the process designed to achieve a competitive
advantage?
•Does the process eliminate steps that do not add value?
•Does the process maximize customer value?
•Will the process win orders?
Copyright © 2020 Pearson Education Ltd. All Rights Reserved.
Process Analysis and Design (2 of 3)
•Flowchart
–Shows the movement of materials
–Harley-Davidson flowchart
•Time-Function Mapping
–Shows flows and time frame
Copyright © 2020 Pearson Education Ltd. All Rights Reserved.
“Baseline” Time-Function Map
Figure 7.4(a)
Copyright © 2020 Pearson Education Ltd. All Rights Reserved.
“Target” Time-Function Map
Figure 7.4(b)
Mass Customization (2 of 4)
Figure 7.2(d)
Copyright © 2020 Pearson Education Ltd. All Rights Reserved.
Comparison of Processes (1 of 4)
Table 7.2 Comparison of the Characteristics of Four Types
of Processes
PROCESS FOCUS
(LOW-VOLUME,
HIGH-VARIETY; e.g.,
ARNOLD PALMER
HOSPITAL)
REPETITIVE FOCUS
(MODULAR; e.g.,
HARLEY-DAVIDSON)
PRODUCT FOCUS
(HIGH-VOLUME,
LOW-VARIETY; e.g.,
FRITO-LAY)
MASS
CUSTOMIZATION
(HIGH-VOLUME, HIGH-
VARIETY; e.g.,
DELL COMPUTER)
1. Small quantity
and large variety of
products
1. Long runs, a
standardized product
from modules
1. Large quantity and
small variety of
products
1. Large quantity and
large variety of
products
2. Broadly skilled
operators
2. Moderately trained
employees
2. Less broadly
skilled operators
2. Flexible operators
Copyright © 2020 Pearson Education Ltd. All Rights Reserved.
Comparison of Processes (2 of 4)
Table 7.2 Comparison of the Characteristics of Four Types
of Processes
PROCESS FOCUS
(LOW-VOLUME,
HIGH-VARIETY; e.g.,
ARNOLD PALMER
HOSPITAL)
REPETITIVE FOCUS
(MODULAR; e.g.,
HARLEY-DAVIDSON)
PRODUCT FOCUS
(HIGH-VOLUME,
LOW-VARIETY; e.g.,
FRITO-LAY)
MASS
CUSTOMIZATION
(HIGH-VOLUME, HIGH-
VARIETY; e.g.,
DELL COMPUTER)
3. Instructions for
each job
3. Few changes in
the instructions
3. Standardized job
instructions
3. Custom orders
requiring many job
instructions
4. High inventory 4. Low inventory 4. Low inventory 4. Low inventory
relative to the value of
the product
Copyright © 2020 Pearson Education Ltd. All Rights Reserved.
Comparison of Processes (3 of 4)
Table 7.2 Comparison of the Characteristics of Four Types
of Processes
PROCESS FOCUS
(LOW-VOLUME,
HIGH-VARIETY; e.g.,
ARNOLD PALMER
HOSPITAL)
REPETITIVE FOCUS
(MODULAR; e.g.,
HARLEY-DAVIDSON)
PRODUCT FOCUS
(HIGH-VOLUME,
LOW-VARIETY; e.g.,
FRITO-LAY)
MASS
CUSTOMIZATION
(HIGH-VOLUME, HIGH-
VARIETY; e.g.,
DELL COMPUTER)
5. Finished goods
are made to order
and not stored
5. Finished goods
are made to frequent
forecasts
5. Finished goods
are made to a
forecast and stored
5. Finished goods are
build-to-order (BTO)
6. Scheduling is
complex
6. Scheduling is
routine
6. Scheduling is
routine
6. Sophisticated
scheduling
accommodates
custom orders
Copyright © 2020 Pearson Education Ltd. All Rights Reserved.
Comparison of Processes (4 of 4)
Table 7.2 Comparison of the Characteristics of Four Types
of Processes
PROCESS FOCUS
(LOW-VOLUME,
HIGH-VARIETY; e.g.,
ARNOLD PALMER
HOSPITAL)
REPETITIVE FOCUS
(MODULAR; e.g.,
HARLEY-DAVIDSON)
PRODUCT FOCUS
(HIGH-VOLUME,
LOW-VARIETY; e.g.,
FRITO-LAY)
MASS
CUSTOMIZATION
(HIGH-VOLUME, HIGH-
VARIETY; e.g.,
DELL COMPUTER)
7. Fixed costs are
low and variable
costs high
7. Fixed costs are
dependent on
flexibility of the
facility
7. Fixed costs are
high and variable
costs low
7. Fixed costs tend to
be high and variable
costs low
Copyright © 2020 Pearson Education Ltd. All Rights Reserved.
Crossover Chart Example (1 of 2)
•Evaluate three different accounting software products
•Calculate crossover points between software A and B and
between software B and C
Blank TOTAL FIXED COST
DOLLARS REQUIRED PER
ACCOUNTING REPORT
Software A $200,000 $60
Software B $300,000 $25
Software C $400,000 $10
Copyright © 2020 Pearson Education Ltd. All Rights Reserved.
Crossover Chart Example (2 of 2)
•Software A is most economical from 0 to 2,857 reports
•Software B is most economical from 2,857 to 6,666 reports
Copyright © 2020 Pearson Education Ltd. All Rights Reserved.
Crossover Charts
Figure 7.3
Copyright © 2020 Pearson Education Ltd. All Rights Reserved.
Focused Processes
•Focus brings efficiency
•Focus on depth of product line rather than breadth
•Focus can be
–Customers
–Products
–Service
–Technology
Copyright © 2020 Pearson Education Ltd. All Rights Reserved.
Selection of Equipment
•Decisions can be complex as alternate methods may be
available
•Important factors may be
–Cost
–Cash flow
–Market stability
–Quality
–Capacity
–Flexibility
Copyright © 2020 Pearson Education Ltd. All Rights Reserved.
Flexibility
•Flexibility is the ability to
respond with little penalty in
time, cost, or customer
value
•May be a competitive
advantage
•May be difficult and
expensive
•Without it, change may
mean starting over
Copyright © 2020 Pearson Education Ltd. All Rights Reserved.
Process Analysis and Design (1 of 3)
•Is the process designed to achieve a competitive
advantage?
•Does the process eliminate steps that do not add value?
•Does the process maximize customer value?
•Will the process win orders?
Copyright © 2020 Pearson Education Ltd. All Rights Reserved.
Process Analysis and Design (2 of 3)
•Flowchart
–Shows the movement of materials
–Harley-Davidson flowchart
•Time-Function Mapping
–Shows flows and time frame
Copyright © 2020 Pearson Education Ltd. All Rights Reserved.
“Baseline” Time-Function Map
Figure 7.4(a)
Copyright © 2020 Pearson Education Ltd. All Rights Reserved.
“Target” Time-Function Map
Figure 7.4(b)
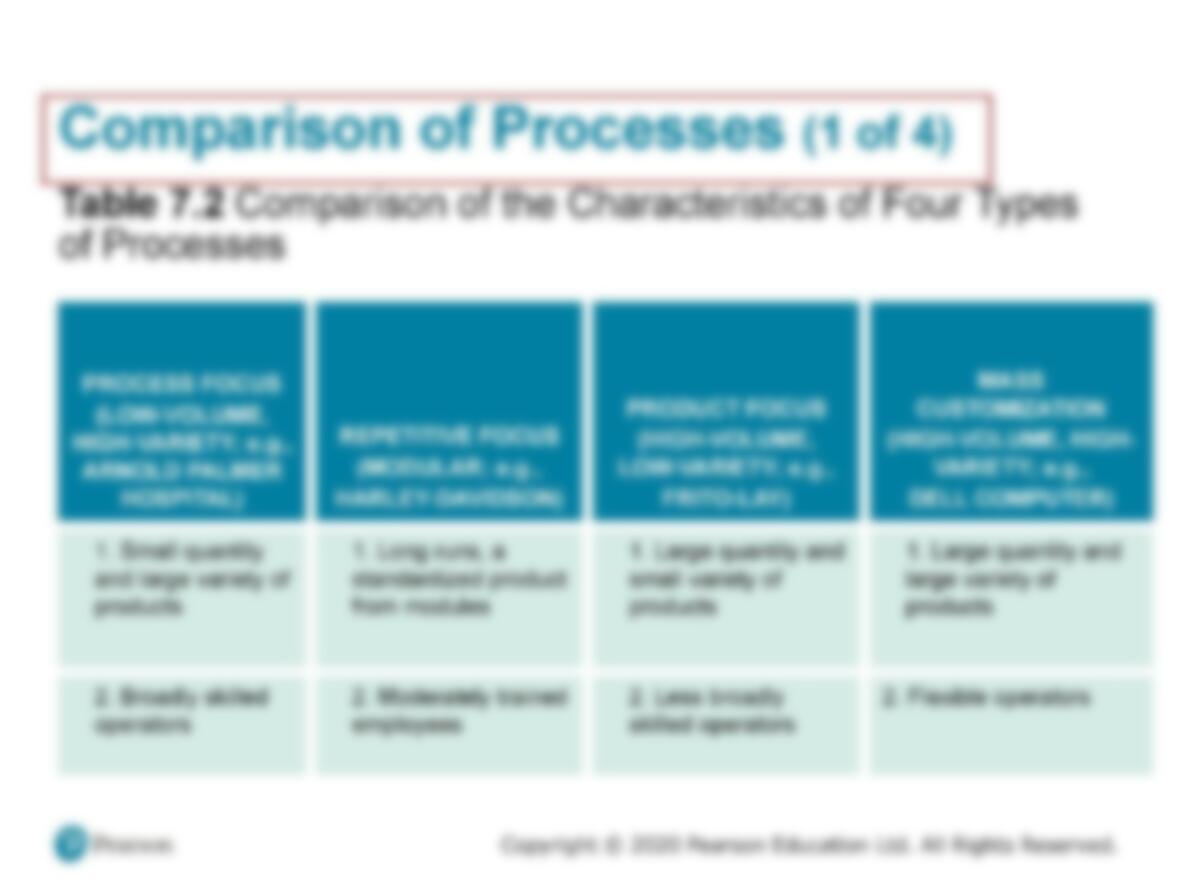
Copyright © 2020 Pearson Education Ltd. All Rights Reserved.
Mass Customization (2 of 4)
Figure 7.2(d)
Mass Customization (3 of 4)
Table 7.1 Mass Customization Provides More Choices Than
Ever
Copyright © 2020 Pearson Education Ltd. All Rights Reserved.
Comparison of Processes (2 of 4)
Table 7.2 Comparison of the Characteristics of Four Types
of Processes
PROCESS FOCUS
(LOW-VOLUME,
HIGH-VARIETY; e.g.,
ARNOLD PALMER
HOSPITAL)
REPETITIVE FOCUS
(MODULAR; e.g.,
HARLEY-DAVIDSON)
PRODUCT FOCUS
(HIGH-VOLUME,
LOW-VARIETY; e.g.,
FRITO-LAY)
MASS
CUSTOMIZATION
(HIGH-VOLUME, HIGH-
VARIETY; e.g.,
DELL COMPUTER)
3. Instructions for
each job
3. Few changes in
the instructions
3. Standardized job
instructions
3. Custom orders
requiring many job
instructions
4. High inventory 4. Low inventory 4. Low inventory 4. Low inventory
relative to the value of
the product
Copyright © 2020 Pearson Education Ltd. All Rights Reserved.
Comparison of Processes (3 of 4)
Table 7.2 Comparison of the Characteristics of Four Types
of Processes
PROCESS FOCUS
(LOW-VOLUME,
HIGH-VARIETY; e.g.,
ARNOLD PALMER
HOSPITAL)
REPETITIVE FOCUS
(MODULAR; e.g.,
HARLEY-DAVIDSON)
PRODUCT FOCUS
(HIGH-VOLUME,
LOW-VARIETY; e.g.,
FRITO-LAY)
MASS
CUSTOMIZATION
(HIGH-VOLUME, HIGH-
VARIETY; e.g.,
DELL COMPUTER)
5. Finished goods
are made to order
and not stored
5. Finished goods
are made to frequent
forecasts
5. Finished goods
are made to a
forecast and stored
5. Finished goods are
build-to-order (BTO)
6. Scheduling is
complex
6. Scheduling is
routine
6. Scheduling is
routine
6. Sophisticated
scheduling
accommodates
custom orders
Copyright © 2020 Pearson Education Ltd. All Rights Reserved.
Comparison of Processes (4 of 4)
Table 7.2 Comparison of the Characteristics of Four Types
of Processes
PROCESS FOCUS
(LOW-VOLUME,
HIGH-VARIETY; e.g.,
ARNOLD PALMER
HOSPITAL)
REPETITIVE FOCUS
(MODULAR; e.g.,
HARLEY-DAVIDSON)
PRODUCT FOCUS
(HIGH-VOLUME,
LOW-VARIETY; e.g.,
FRITO-LAY)
MASS
CUSTOMIZATION
(HIGH-VOLUME, HIGH-
VARIETY; e.g.,
DELL COMPUTER)
7. Fixed costs are
low and variable
costs high
7. Fixed costs are
dependent on
flexibility of the
facility
7. Fixed costs are
high and variable
costs low
7. Fixed costs tend to
be high and variable
costs low
Copyright © 2020 Pearson Education Ltd. All Rights Reserved.
Crossover Chart Example (1 of 2)
•Evaluate three different accounting software products
•Calculate crossover points between software A and B and
between software B and C
Blank TOTAL FIXED COST
DOLLARS REQUIRED PER
ACCOUNTING REPORT
Software A $200,000 $60
Software B $300,000 $25
Software C $400,000 $10
Copyright © 2020 Pearson Education Ltd. All Rights Reserved.
Crossover Chart Example (2 of 2)
•Software A is most economical from 0 to 2,857 reports
•Software B is most economical from 2,857 to 6,666 reports
Copyright © 2020 Pearson Education Ltd. All Rights Reserved.
Crossover Charts
Figure 7.3
Copyright © 2020 Pearson Education Ltd. All Rights Reserved.
Focused Processes
•Focus brings efficiency
•Focus on depth of product line rather than breadth
•Focus can be
–Customers
–Products
–Service
–Technology
Copyright © 2020 Pearson Education Ltd. All Rights Reserved.
Selection of Equipment
•Decisions can be complex as alternate methods may be
available
•Important factors may be
–Cost
–Cash flow
–Market stability
–Quality
–Capacity
–Flexibility
Copyright © 2020 Pearson Education Ltd. All Rights Reserved.
Flexibility
•Flexibility is the ability to
respond with little penalty in
time, cost, or customer
value
•May be a competitive
advantage
•May be difficult and
expensive
•Without it, change may
mean starting over
Copyright © 2020 Pearson Education Ltd. All Rights Reserved.
Process Analysis and Design (1 of 3)
•Is the process designed to achieve a competitive
advantage?
•Does the process eliminate steps that do not add value?
•Does the process maximize customer value?
•Will the process win orders?
Copyright © 2020 Pearson Education Ltd. All Rights Reserved.
Process Analysis and Design (2 of 3)
•Flowchart
–Shows the movement of materials
–Harley-Davidson flowchart
•Time-Function Mapping
–Shows flows and time frame
Copyright © 2020 Pearson Education Ltd. All Rights Reserved.
“Baseline” Time-Function Map
Figure 7.4(a)
Copyright © 2020 Pearson Education Ltd. All Rights Reserved.
“Target” Time-Function Map
Figure 7.4(b)
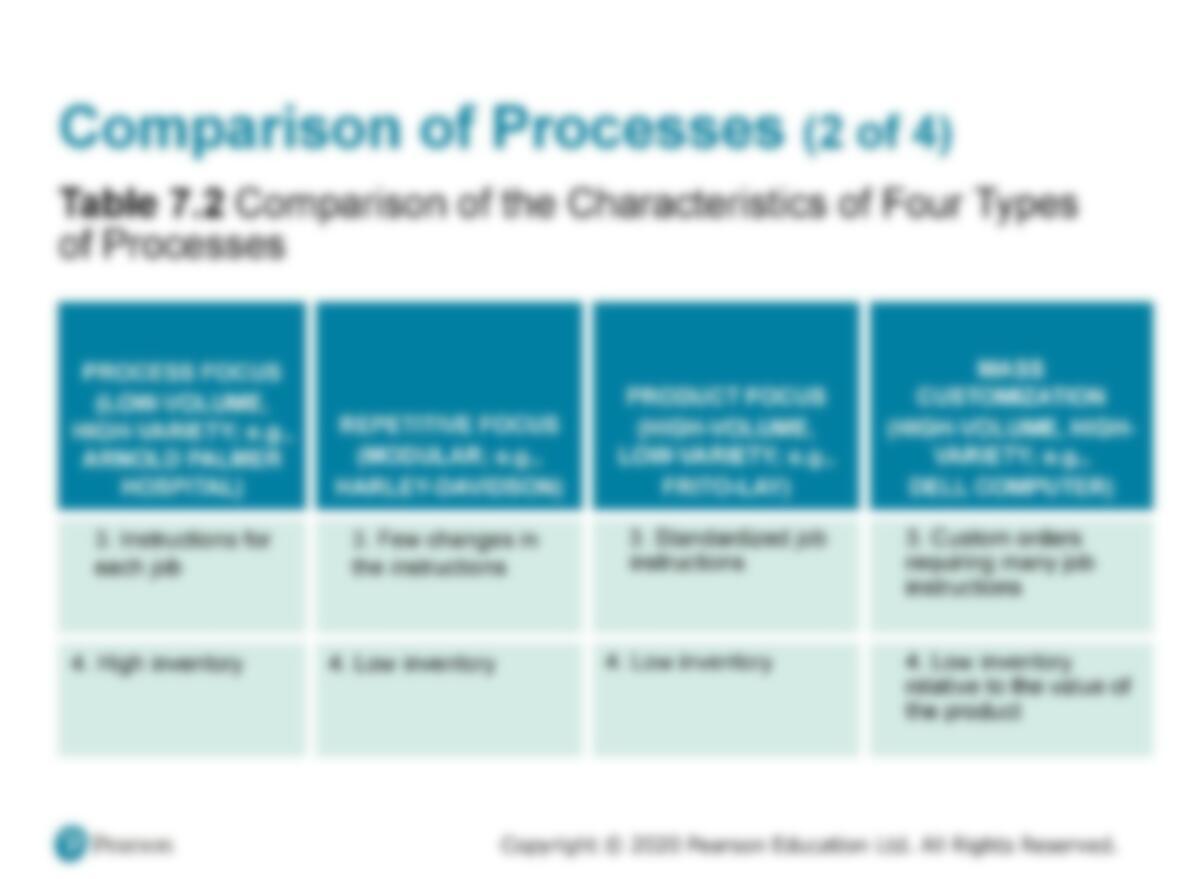
Copyright © 2020 Pearson Education Ltd. All Rights Reserved.
Mass Customization (2 of 4)
Figure 7.2(d)
Copyright © 2020 Pearson Education Ltd. All Rights Reserved.
Mass Customization (3 of 4)
Table 7.1 Mass Customization Provides More Choices Than
Ever
Mass Customization (4 of 4)
•Imaginative product design
•Flexible process design
•Tightly controlled inventory management
•Tight schedules
•Responsive partners in the supply chain
Copyright © 2020 Pearson Education Ltd. All Rights Reserved.
Comparison of Processes (3 of 4)
Table 7.2 Comparison of the Characteristics of Four Types
of Processes
PROCESS FOCUS
(LOW-VOLUME,
HIGH-VARIETY; e.g.,
ARNOLD PALMER
HOSPITAL)
REPETITIVE FOCUS
(MODULAR; e.g.,
HARLEY-DAVIDSON)
PRODUCT FOCUS
(HIGH-VOLUME,
LOW-VARIETY; e.g.,
FRITO-LAY)
MASS
CUSTOMIZATION
(HIGH-VOLUME, HIGH-
VARIETY; e.g.,
DELL COMPUTER)
5. Finished goods
are made to order
and not stored
5. Finished goods
are made to frequent
forecasts
5. Finished goods
are made to a
forecast and stored
5. Finished goods are
build-to-order (BTO)
6. Scheduling is
complex
6. Scheduling is
routine
6. Scheduling is
routine
6. Sophisticated
scheduling
accommodates
custom orders
Copyright © 2020 Pearson Education Ltd. All Rights Reserved.
Comparison of Processes (4 of 4)
Table 7.2 Comparison of the Characteristics of Four Types
of Processes
PROCESS FOCUS
(LOW-VOLUME,
HIGH-VARIETY; e.g.,
ARNOLD PALMER
HOSPITAL)
REPETITIVE FOCUS
(MODULAR; e.g.,
HARLEY-DAVIDSON)
PRODUCT FOCUS
(HIGH-VOLUME,
LOW-VARIETY; e.g.,
FRITO-LAY)
MASS
CUSTOMIZATION
(HIGH-VOLUME, HIGH-
VARIETY; e.g.,
DELL COMPUTER)
7. Fixed costs are
low and variable
costs high
7. Fixed costs are
dependent on
flexibility of the
facility
7. Fixed costs are
high and variable
costs low
7. Fixed costs tend to
be high and variable
costs low
Copyright © 2020 Pearson Education Ltd. All Rights Reserved.
Crossover Chart Example (1 of 2)
•Evaluate three different accounting software products
•Calculate crossover points between software A and B and
between software B and C
Blank TOTAL FIXED COST
DOLLARS REQUIRED PER
ACCOUNTING REPORT
Software A $200,000 $60
Software B $300,000 $25
Software C $400,000 $10
Copyright © 2020 Pearson Education Ltd. All Rights Reserved.
Crossover Chart Example (2 of 2)
•Software A is most economical from 0 to 2,857 reports
•Software B is most economical from 2,857 to 6,666 reports
Copyright © 2020 Pearson Education Ltd. All Rights Reserved.
Crossover Charts
Figure 7.3
Copyright © 2020 Pearson Education Ltd. All Rights Reserved.
Focused Processes
•Focus brings efficiency
•Focus on depth of product line rather than breadth
•Focus can be
–Customers
–Products
–Service
–Technology
Copyright © 2020 Pearson Education Ltd. All Rights Reserved.
Selection of Equipment
•Decisions can be complex as alternate methods may be
available
•Important factors may be
–Cost
–Cash flow
–Market stability
–Quality
–Capacity
–Flexibility
Copyright © 2020 Pearson Education Ltd. All Rights Reserved.
Flexibility
•Flexibility is the ability to
respond with little penalty in
time, cost, or customer
value
•May be a competitive
advantage
•May be difficult and
expensive
•Without it, change may
mean starting over
Copyright © 2020 Pearson Education Ltd. All Rights Reserved.
Process Analysis and Design (1 of 3)
•Is the process designed to achieve a competitive
advantage?
•Does the process eliminate steps that do not add value?
•Does the process maximize customer value?
•Will the process win orders?
Copyright © 2020 Pearson Education Ltd. All Rights Reserved.
Process Analysis and Design (2 of 3)
•Flowchart
–Shows the movement of materials
–Harley-Davidson flowchart
•Time-Function Mapping
–Shows flows and time frame
Copyright © 2020 Pearson Education Ltd. All Rights Reserved.
“Baseline” Time-Function Map
Figure 7.4(a)
Copyright © 2020 Pearson Education Ltd. All Rights Reserved.
“Target” Time-Function Map
Figure 7.4(b)
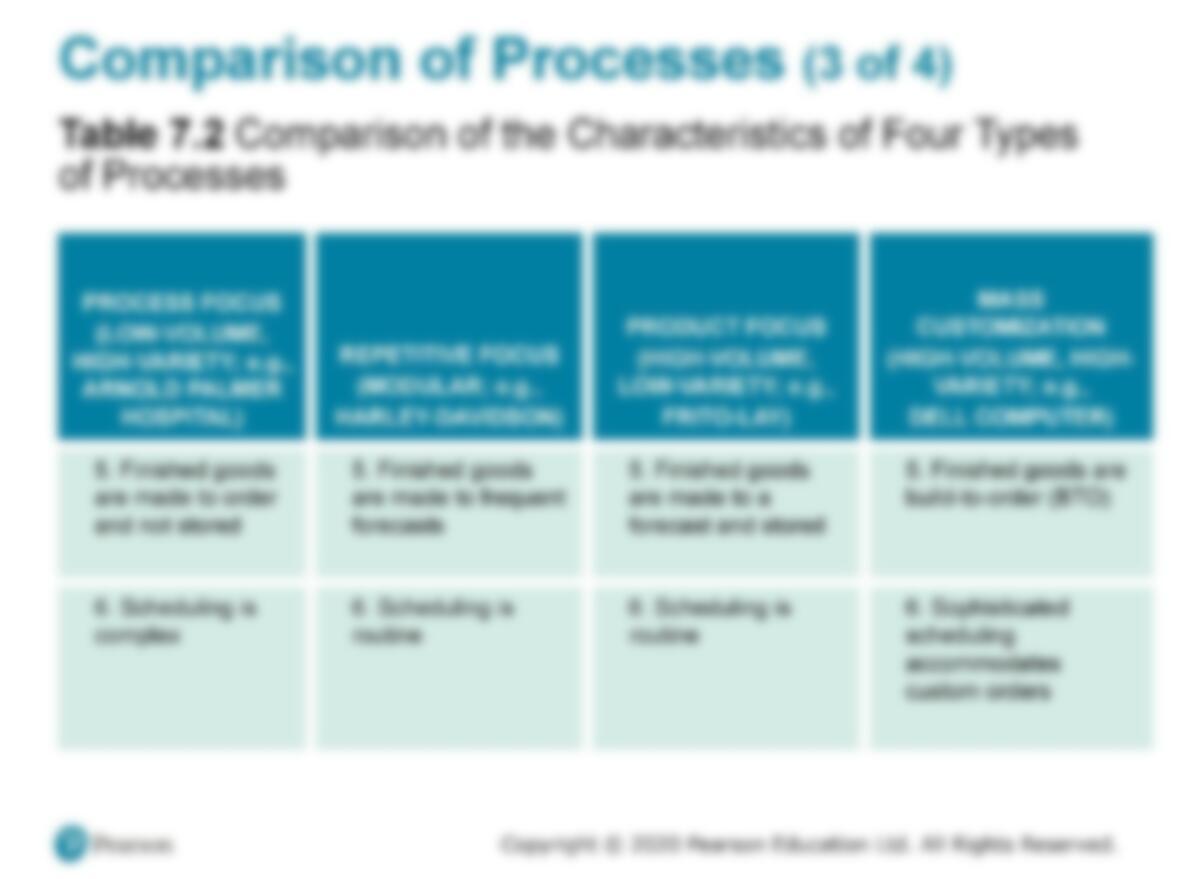
Copyright © 2020 Pearson Education Ltd. All Rights Reserved.
Mass Customization (2 of 4)
Figure 7.2(d)
Copyright © 2020 Pearson Education Ltd. All Rights Reserved.
Mass Customization (3 of 4)
Table 7.1 Mass Customization Provides More Choices Than
Ever
Copyright © 2020 Pearson Education Ltd. All Rights Reserved.
Mass Customization (4 of 4)
•Imaginative product design
•Flexible process design
•Tightly controlled inventory management
•Tight schedules
•Responsive partners in the supply chain
Comparison of Processes (1 of 4)
Table 7.2 Comparison of the Characteristics of Four Types
of Processes
PROCESS FOCUS
(LOW-VOLUME,
HIGH-VARIETY; e.g.,
ARNOLD PALMER
HOSPITAL)
REPETITIVE FOCUS
(MODULAR; e.g.,
HARLEY-DAVIDSON)
PRODUCT FOCUS
(HIGH-VOLUME,
LOW-VARIETY; e.g.,
FRITO-LAY)
MASS
CUSTOMIZATION
(HIGH-VOLUME, HIGH-
VARIETY; e.g.,
DELL COMPUTER)
1. Small quantity
and large variety of
products
1. Long runs, a
standardized product
from modules
1. Large quantity and
small variety of
products
1. Large quantity and
large variety of
products
Copyright © 2020 Pearson Education Ltd. All Rights Reserved.
Comparison of Processes (4 of 4)
Table 7.2 Comparison of the Characteristics of Four Types
of Processes
PROCESS FOCUS
(LOW-VOLUME,
HIGH-VARIETY; e.g.,
ARNOLD PALMER
HOSPITAL)
REPETITIVE FOCUS
(MODULAR; e.g.,
HARLEY-DAVIDSON)
PRODUCT FOCUS
(HIGH-VOLUME,
LOW-VARIETY; e.g.,
FRITO-LAY)
MASS
CUSTOMIZATION
(HIGH-VOLUME, HIGH-
VARIETY; e.g.,
DELL COMPUTER)
7. Fixed costs are
low and variable
costs high
7. Fixed costs are
dependent on
flexibility of the
facility
7. Fixed costs are
high and variable
costs low
7. Fixed costs tend to
be high and variable
costs low
Copyright © 2020 Pearson Education Ltd. All Rights Reserved.
Crossover Chart Example (1 of 2)
•Evaluate three different accounting software products
•Calculate crossover points between software A and B and
between software B and C
Blank TOTAL FIXED COST
DOLLARS REQUIRED PER
ACCOUNTING REPORT
Software A $200,000 $60
Software B $300,000 $25
Software C $400,000 $10
Copyright © 2020 Pearson Education Ltd. All Rights Reserved.
Crossover Chart Example (2 of 2)
•Software A is most economical from 0 to 2,857 reports
•Software B is most economical from 2,857 to 6,666 reports
Copyright © 2020 Pearson Education Ltd. All Rights Reserved.
Crossover Charts
Figure 7.3
Copyright © 2020 Pearson Education Ltd. All Rights Reserved.
Focused Processes
•Focus brings efficiency
•Focus on depth of product line rather than breadth
•Focus can be
–Customers
–Products
–Service
–Technology
Copyright © 2020 Pearson Education Ltd. All Rights Reserved.
Selection of Equipment
•Decisions can be complex as alternate methods may be
available
•Important factors may be
–Cost
–Cash flow
–Market stability
–Quality
–Capacity
–Flexibility
Copyright © 2020 Pearson Education Ltd. All Rights Reserved.
Flexibility
•Flexibility is the ability to
respond with little penalty in
time, cost, or customer
value
•May be a competitive
advantage
•May be difficult and
expensive
•Without it, change may
mean starting over
Copyright © 2020 Pearson Education Ltd. All Rights Reserved.
Process Analysis and Design (1 of 3)
•Is the process designed to achieve a competitive
advantage?
•Does the process eliminate steps that do not add value?
•Does the process maximize customer value?
•Will the process win orders?
Copyright © 2020 Pearson Education Ltd. All Rights Reserved.
Process Analysis and Design (2 of 3)
•Flowchart
–Shows the movement of materials
–Harley-Davidson flowchart
•Time-Function Mapping
–Shows flows and time frame
Copyright © 2020 Pearson Education Ltd. All Rights Reserved.
“Baseline” Time-Function Map
Figure 7.4(a)
Copyright © 2020 Pearson Education Ltd. All Rights Reserved.
“Target” Time-Function Map
Figure 7.4(b)
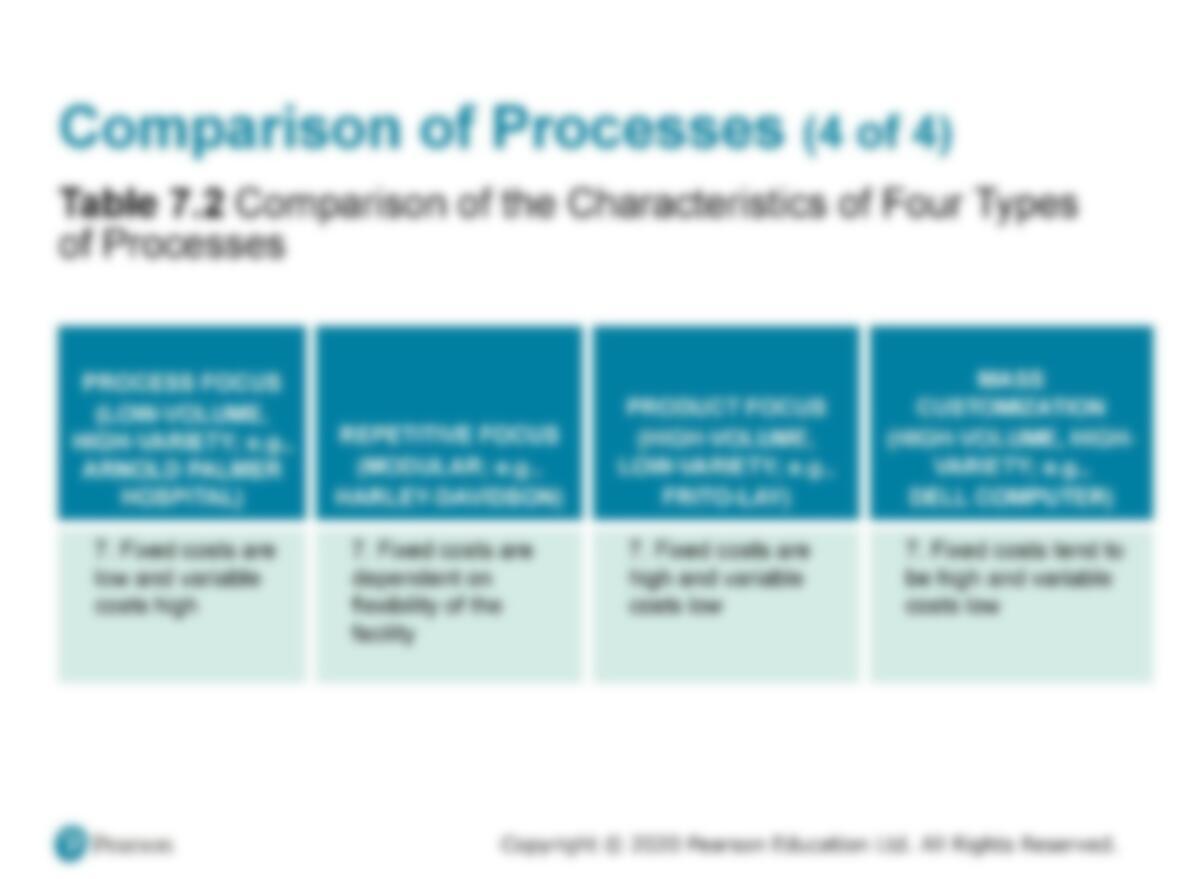
Copyright © 2020 Pearson Education Ltd. All Rights Reserved.
Mass Customization (2 of 4)
Figure 7.2(d)
Copyright © 2020 Pearson Education Ltd. All Rights Reserved.
Mass Customization (3 of 4)
Table 7.1 Mass Customization Provides More Choices Than
Ever
Copyright © 2020 Pearson Education Ltd. All Rights Reserved.
Mass Customization (4 of 4)
•Imaginative product design
•Flexible process design
•Tightly controlled inventory management
•Tight schedules
•Responsive partners in the supply chain
Copyright © 2020 Pearson Education Ltd. All Rights Reserved.
Comparison of Processes (1 of 4)
Table 7.2 Comparison of the Characteristics of Four Types
of Processes
PROCESS FOCUS
(LOW-VOLUME,
HIGH-VARIETY; e.g.,
ARNOLD PALMER
HOSPITAL)
REPETITIVE FOCUS
(MODULAR; e.g.,
HARLEY-DAVIDSON)
PRODUCT FOCUS
(HIGH-VOLUME,
LOW-VARIETY; e.g.,
FRITO-LAY)
MASS
CUSTOMIZATION
(HIGH-VOLUME, HIGH-
VARIETY; e.g.,
DELL COMPUTER)
1. Small quantity
and large variety of
products
1. Long runs, a
standardized product
from modules
1. Large quantity and
small variety of
products
1. Large quantity and
large variety of
products
2. Broadly skilled
operators
2. Moderately trained
employees
2. Less broadly
skilled operators
2. Flexible operators
Comparison of Processes (2 of 4)
Table 7.2 Comparison of the Characteristics of Four Types
of Processes
PROCESS FOCUS
(LOW-VOLUME,
HIGH-VARIETY; e.g.,
ARNOLD PALMER
HOSPITAL)
REPETITIVE FOCUS
(MODULAR; e.g.,
HARLEY-DAVIDSON)
PRODUCT FOCUS
(HIGH-VOLUME,
LOW-VARIETY; e.g.,
FRITO-LAY)
MASS
CUSTOMIZATION
(HIGH-VOLUME, HIGH-
VARIETY; e.g.,
DELL COMPUTER)
3. Instructions for
each job
3. Few changes in
the instructions
3. Standardized job
instructions
3. Custom orders
requiring many job
instructions
Copyright © 2020 Pearson Education Ltd. All Rights Reserved.
Crossover Chart Example (1 of 2)
•Evaluate three different accounting software products
•Calculate crossover points between software A and B and
between software B and C
Blank TOTAL FIXED COST
DOLLARS REQUIRED PER
ACCOUNTING REPORT
Software A $200,000 $60
Software B $300,000 $25
Software C $400,000 $10
Copyright © 2020 Pearson Education Ltd. All Rights Reserved.
Crossover Chart Example (2 of 2)
•Software A is most economical from 0 to 2,857 reports
•Software B is most economical from 2,857 to 6,666 reports
Copyright © 2020 Pearson Education Ltd. All Rights Reserved.
Crossover Charts
Figure 7.3
Copyright © 2020 Pearson Education Ltd. All Rights Reserved.
Focused Processes
•Focus brings efficiency
•Focus on depth of product line rather than breadth
•Focus can be
–Customers
–Products
–Service
–Technology
Copyright © 2020 Pearson Education Ltd. All Rights Reserved.
Selection of Equipment
•Decisions can be complex as alternate methods may be
available
•Important factors may be
–Cost
–Cash flow
–Market stability
–Quality
–Capacity
–Flexibility
Copyright © 2020 Pearson Education Ltd. All Rights Reserved.
Flexibility
•Flexibility is the ability to
respond with little penalty in
time, cost, or customer
value
•May be a competitive
advantage
•May be difficult and
expensive
•Without it, change may
mean starting over
Copyright © 2020 Pearson Education Ltd. All Rights Reserved.
Process Analysis and Design (1 of 3)
•Is the process designed to achieve a competitive
advantage?
•Does the process eliminate steps that do not add value?
•Does the process maximize customer value?
•Will the process win orders?
Copyright © 2020 Pearson Education Ltd. All Rights Reserved.
Process Analysis and Design (2 of 3)
•Flowchart
–Shows the movement of materials
–Harley-Davidson flowchart
•Time-Function Mapping
–Shows flows and time frame
Copyright © 2020 Pearson Education Ltd. All Rights Reserved.
“Baseline” Time-Function Map
Figure 7.4(a)
Copyright © 2020 Pearson Education Ltd. All Rights Reserved.
“Target” Time-Function Map
Figure 7.4(b)
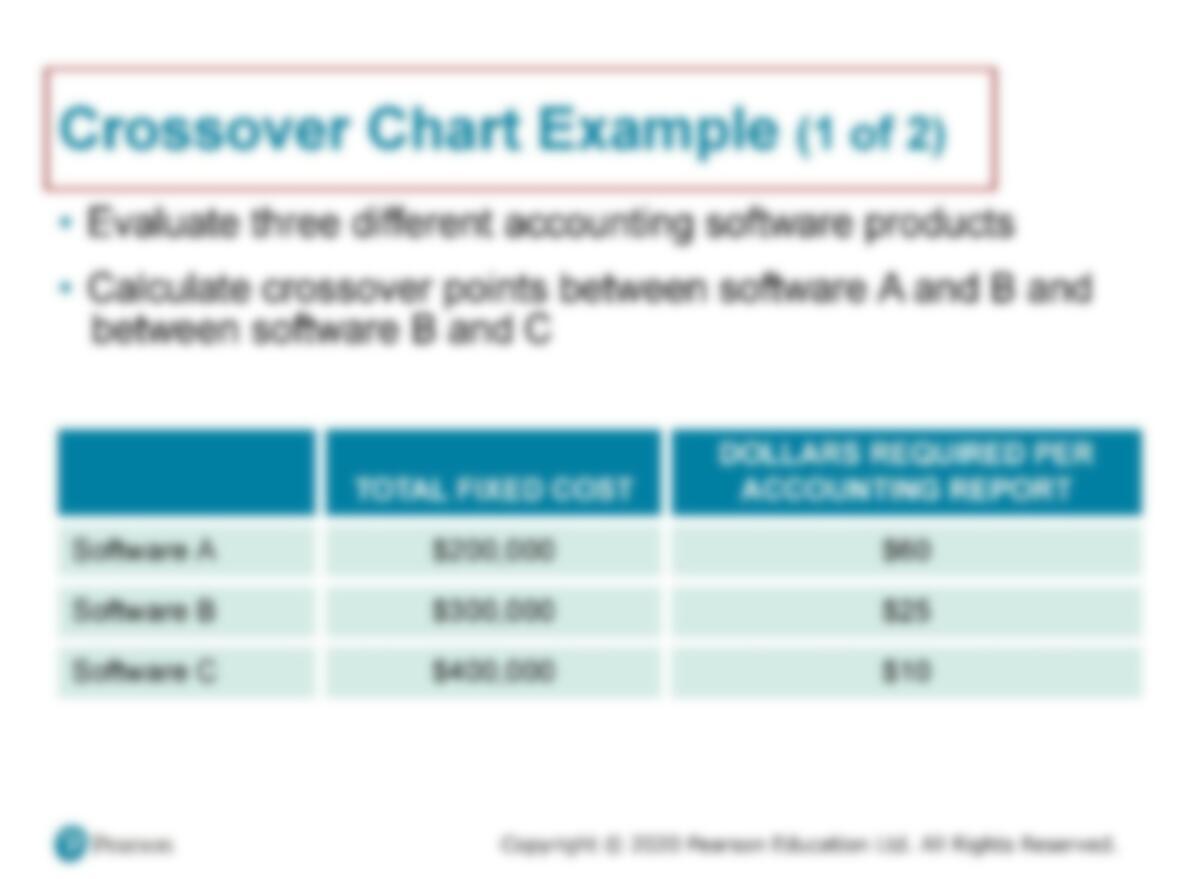
Copyright © 2020 Pearson Education Ltd. All Rights Reserved.
Mass Customization (2 of 4)
Figure 7.2(d)
Copyright © 2020 Pearson Education Ltd. All Rights Reserved.
Mass Customization (3 of 4)
Table 7.1 Mass Customization Provides More Choices Than
Ever
Copyright © 2020 Pearson Education Ltd. All Rights Reserved.
Mass Customization (4 of 4)
•Imaginative product design
•Flexible process design
•Tightly controlled inventory management
•Tight schedules
•Responsive partners in the supply chain
Copyright © 2020 Pearson Education Ltd. All Rights Reserved.
Comparison of Processes (1 of 4)
Table 7.2 Comparison of the Characteristics of Four Types
of Processes
PROCESS FOCUS
(LOW-VOLUME,
HIGH-VARIETY; e.g.,
ARNOLD PALMER
HOSPITAL)
REPETITIVE FOCUS
(MODULAR; e.g.,
HARLEY-DAVIDSON)
PRODUCT FOCUS
(HIGH-VOLUME,
LOW-VARIETY; e.g.,
FRITO-LAY)
MASS
CUSTOMIZATION
(HIGH-VOLUME, HIGH-
VARIETY; e.g.,
DELL COMPUTER)
1. Small quantity
and large variety of
products
1. Long runs, a
standardized product
from modules
1. Large quantity and
small variety of
products
1. Large quantity and
large variety of
products
2. Broadly skilled
operators
2. Moderately trained
employees
2. Less broadly
skilled operators
2. Flexible operators
Copyright © 2020 Pearson Education Ltd. All Rights Reserved.
Comparison of Processes (2 of 4)
Table 7.2 Comparison of the Characteristics of Four Types
of Processes
PROCESS FOCUS
(LOW-VOLUME,
HIGH-VARIETY; e.g.,
ARNOLD PALMER
HOSPITAL)
REPETITIVE FOCUS
(MODULAR; e.g.,
HARLEY-DAVIDSON)
PRODUCT FOCUS
(HIGH-VOLUME,
LOW-VARIETY; e.g.,
FRITO-LAY)
MASS
CUSTOMIZATION
(HIGH-VOLUME, HIGH-
VARIETY; e.g.,
DELL COMPUTER)
3. Instructions for
each job
3. Few changes in
the instructions
3. Standardized job
instructions
3. Custom orders
requiring many job
instructions
4. High inventory 4. Low inventory 4. Low inventory 4. Low inventory
relative to the value of
the product
Comparison of Processes (3 of 4)
Table 7.2 Comparison of the Characteristics of Four Types
of Processes
PROCESS FOCUS
(LOW-VOLUME,
HIGH-VARIETY; e.g.,
ARNOLD PALMER
HOSPITAL)
REPETITIVE FOCUS
(MODULAR; e.g.,
HARLEY-DAVIDSON)
PRODUCT FOCUS
(HIGH-VOLUME,
LOW-VARIETY; e.g.,
FRITO-LAY)
MASS
CUSTOMIZATION
(HIGH-VOLUME, HIGH-
VARIETY; e.g.,
DELL COMPUTER)
5. Finished goods
are made to order
and not stored
5. Finished goods
are made to frequent
forecasts
5. Finished goods
are made to a
forecast and stored
5. Finished goods are
build-to-order (BTO)
6. Scheduling is
complex
6. Scheduling is
routine
6. Scheduling is
routine
6. Sophisticated
scheduling
Copyright © 2020 Pearson Education Ltd. All Rights Reserved.
Crossover Chart Example (2 of 2)
•Software A is most economical from 0 to 2,857 reports
•Software B is most economical from 2,857 to 6,666 reports
Copyright © 2020 Pearson Education Ltd. All Rights Reserved.
Crossover Charts
Figure 7.3
Copyright © 2020 Pearson Education Ltd. All Rights Reserved.
Focused Processes
•Focus brings efficiency
•Focus on depth of product line rather than breadth
•Focus can be
–Customers
–Products
–Service
–Technology
Copyright © 2020 Pearson Education Ltd. All Rights Reserved.
Selection of Equipment
•Decisions can be complex as alternate methods may be
available
•Important factors may be
–Cost
–Cash flow
–Market stability
–Quality
–Capacity
–Flexibility
Copyright © 2020 Pearson Education Ltd. All Rights Reserved.
Flexibility
•Flexibility is the ability to
respond with little penalty in
time, cost, or customer
value
•May be a competitive
advantage
•May be difficult and
expensive
•Without it, change may
mean starting over
Copyright © 2020 Pearson Education Ltd. All Rights Reserved.
Process Analysis and Design (1 of 3)
•Is the process designed to achieve a competitive
advantage?
•Does the process eliminate steps that do not add value?
•Does the process maximize customer value?
•Will the process win orders?
Copyright © 2020 Pearson Education Ltd. All Rights Reserved.
Process Analysis and Design (2 of 3)
•Flowchart
–Shows the movement of materials
–Harley-Davidson flowchart
•Time-Function Mapping
–Shows flows and time frame
Copyright © 2020 Pearson Education Ltd. All Rights Reserved.
“Baseline” Time-Function Map
Figure 7.4(a)
Copyright © 2020 Pearson Education Ltd. All Rights Reserved.
“Target” Time-Function Map
Figure 7.4(b)
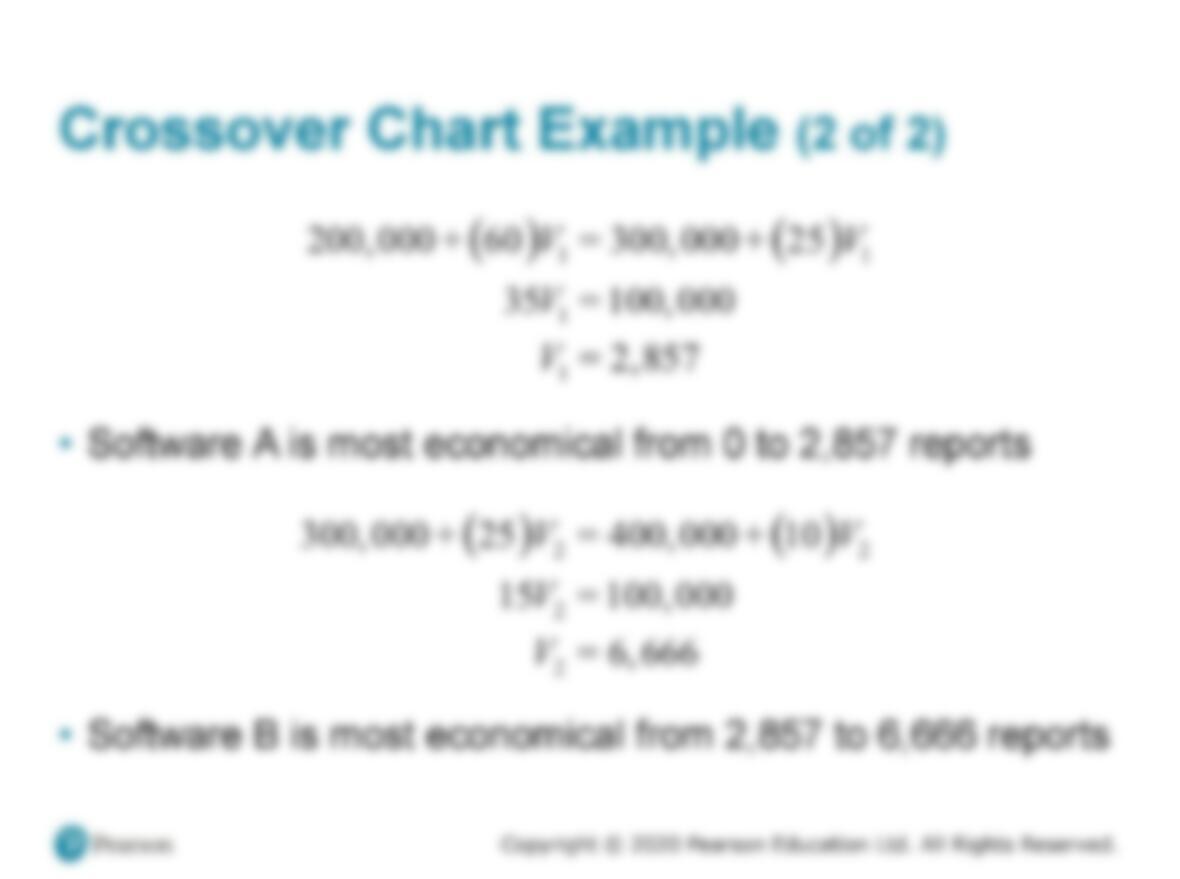
Copyright © 2020 Pearson Education Ltd. All Rights Reserved.
Mass Customization (2 of 4)
Figure 7.2(d)
Copyright © 2020 Pearson Education Ltd. All Rights Reserved.
Mass Customization (3 of 4)
Table 7.1 Mass Customization Provides More Choices Than
Ever
Copyright © 2020 Pearson Education Ltd. All Rights Reserved.
Mass Customization (4 of 4)
•Imaginative product design
•Flexible process design
•Tightly controlled inventory management
•Tight schedules
•Responsive partners in the supply chain
Copyright © 2020 Pearson Education Ltd. All Rights Reserved.
Comparison of Processes (1 of 4)
Table 7.2 Comparison of the Characteristics of Four Types
of Processes
PROCESS FOCUS
(LOW-VOLUME,
HIGH-VARIETY; e.g.,
ARNOLD PALMER
HOSPITAL)
REPETITIVE FOCUS
(MODULAR; e.g.,
HARLEY-DAVIDSON)
PRODUCT FOCUS
(HIGH-VOLUME,
LOW-VARIETY; e.g.,
FRITO-LAY)
MASS
CUSTOMIZATION
(HIGH-VOLUME, HIGH-
VARIETY; e.g.,
DELL COMPUTER)
1. Small quantity
and large variety of
products
1. Long runs, a
standardized product
from modules
1. Large quantity and
small variety of
products
1. Large quantity and
large variety of
products
2. Broadly skilled
operators
2. Moderately trained
employees
2. Less broadly
skilled operators
2. Flexible operators
Copyright © 2020 Pearson Education Ltd. All Rights Reserved.
Comparison of Processes (2 of 4)
Table 7.2 Comparison of the Characteristics of Four Types
of Processes
PROCESS FOCUS
(LOW-VOLUME,
HIGH-VARIETY; e.g.,
ARNOLD PALMER
HOSPITAL)
REPETITIVE FOCUS
(MODULAR; e.g.,
HARLEY-DAVIDSON)
PRODUCT FOCUS
(HIGH-VOLUME,
LOW-VARIETY; e.g.,
FRITO-LAY)
MASS
CUSTOMIZATION
(HIGH-VOLUME, HIGH-
VARIETY; e.g.,
DELL COMPUTER)
3. Instructions for
each job
3. Few changes in
the instructions
3. Standardized job
instructions
3. Custom orders
requiring many job
instructions
4. High inventory 4. Low inventory 4. Low inventory 4. Low inventory
relative to the value of
the product
Copyright © 2020 Pearson Education Ltd. All Rights Reserved.
Comparison of Processes (3 of 4)
Table 7.2 Comparison of the Characteristics of Four Types
of Processes
PROCESS FOCUS
(LOW-VOLUME,
HIGH-VARIETY; e.g.,
ARNOLD PALMER
HOSPITAL)
REPETITIVE FOCUS
(MODULAR; e.g.,
HARLEY-DAVIDSON)
PRODUCT FOCUS
(HIGH-VOLUME,
LOW-VARIETY; e.g.,
FRITO-LAY)
MASS
CUSTOMIZATION
(HIGH-VOLUME, HIGH-
VARIETY; e.g.,
DELL COMPUTER)
5. Finished goods
are made to order
and not stored
5. Finished goods
are made to frequent
forecasts
5. Finished goods
are made to a
forecast and stored
5. Finished goods are
build-to-order (BTO)
6. Scheduling is
complex
6. Scheduling is
routine
6. Scheduling is
routine
6. Sophisticated
scheduling
accommodates
custom orders
Comparison of Processes (4 of 4)
Table 7.2 Comparison of the Characteristics of Four Types
of Processes
PROCESS FOCUS
(LOW-VOLUME,
HIGH-VARIETY; e.g.,
ARNOLD PALMER
HOSPITAL)
REPETITIVE FOCUS
(MODULAR; e.g.,
HARLEY-DAVIDSON)
PRODUCT FOCUS
(HIGH-VOLUME,
LOW-VARIETY; e.g.,
FRITO-LAY)
MASS
CUSTOMIZATION
(HIGH-VOLUME, HIGH-
VARIETY; e.g.,
DELL COMPUTER)
7. Fixed costs are
low and variable
costs high
7. Fixed costs are
dependent on
flexibility of the
facility
7. Fixed costs are
high and variable
costs low
7. Fixed costs tend to
be high and variable
costs low
Copyright © 2020 Pearson Education Ltd. All Rights Reserved.
Crossover Charts
Figure 7.3
Copyright © 2020 Pearson Education Ltd. All Rights Reserved.
Focused Processes
•Focus brings efficiency
•Focus on depth of product line rather than breadth
•Focus can be
–Customers
–Products
–Service
–Technology
Copyright © 2020 Pearson Education Ltd. All Rights Reserved.
Selection of Equipment
•Decisions can be complex as alternate methods may be
available
•Important factors may be
–Cost
–Cash flow
–Market stability
–Quality
–Capacity
–Flexibility
Copyright © 2020 Pearson Education Ltd. All Rights Reserved.
Flexibility
•Flexibility is the ability to
respond with little penalty in
time, cost, or customer
value
•May be a competitive
advantage
•May be difficult and
expensive
•Without it, change may
mean starting over
Copyright © 2020 Pearson Education Ltd. All Rights Reserved.
Process Analysis and Design (1 of 3)
•Is the process designed to achieve a competitive
advantage?
•Does the process eliminate steps that do not add value?
•Does the process maximize customer value?
•Will the process win orders?
Copyright © 2020 Pearson Education Ltd. All Rights Reserved.
Process Analysis and Design (2 of 3)
•Flowchart
–Shows the movement of materials
–Harley-Davidson flowchart
•Time-Function Mapping
–Shows flows and time frame
Copyright © 2020 Pearson Education Ltd. All Rights Reserved.
“Baseline” Time-Function Map
Figure 7.4(a)
Copyright © 2020 Pearson Education Ltd. All Rights Reserved.
“Target” Time-Function Map
Figure 7.4(b)
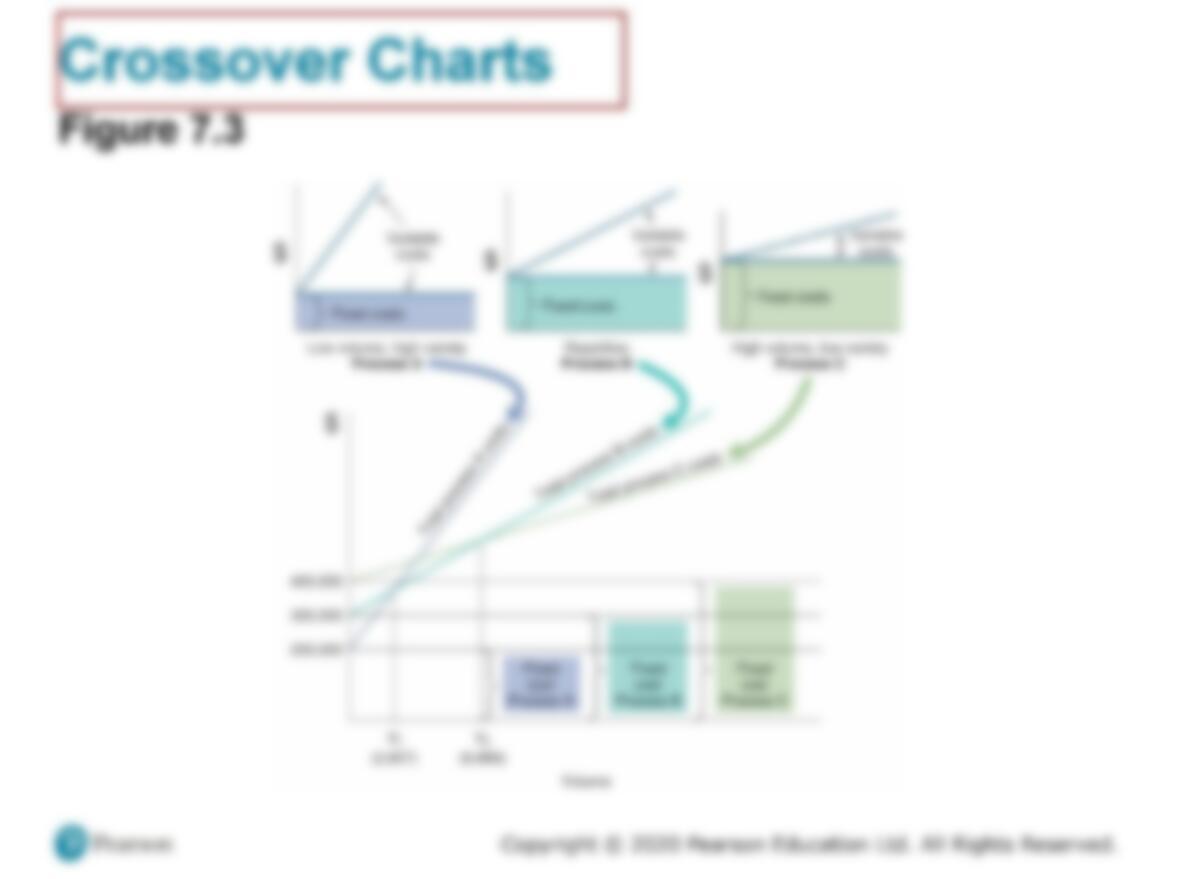
Copyright © 2020 Pearson Education Ltd. All Rights Reserved.
Mass Customization (2 of 4)
Figure 7.2(d)
Copyright © 2020 Pearson Education Ltd. All Rights Reserved.
Mass Customization (3 of 4)
Table 7.1 Mass Customization Provides More Choices Than
Ever
Copyright © 2020 Pearson Education Ltd. All Rights Reserved.
Mass Customization (4 of 4)
•Imaginative product design
•Flexible process design
•Tightly controlled inventory management
•Tight schedules
•Responsive partners in the supply chain
Copyright © 2020 Pearson Education Ltd. All Rights Reserved.
Comparison of Processes (1 of 4)
Table 7.2 Comparison of the Characteristics of Four Types
of Processes
PROCESS FOCUS
(LOW-VOLUME,
HIGH-VARIETY; e.g.,
ARNOLD PALMER
HOSPITAL)
REPETITIVE FOCUS
(MODULAR; e.g.,
HARLEY-DAVIDSON)
PRODUCT FOCUS
(HIGH-VOLUME,
LOW-VARIETY; e.g.,
FRITO-LAY)
MASS
CUSTOMIZATION
(HIGH-VOLUME, HIGH-
VARIETY; e.g.,
DELL COMPUTER)
1. Small quantity
and large variety of
products
1. Long runs, a
standardized product
from modules
1. Large quantity and
small variety of
products
1. Large quantity and
large variety of
products
2. Broadly skilled
operators
2. Moderately trained
employees
2. Less broadly
skilled operators
2. Flexible operators
Copyright © 2020 Pearson Education Ltd. All Rights Reserved.
Comparison of Processes (2 of 4)
Table 7.2 Comparison of the Characteristics of Four Types
of Processes
PROCESS FOCUS
(LOW-VOLUME,
HIGH-VARIETY; e.g.,
ARNOLD PALMER
HOSPITAL)
REPETITIVE FOCUS
(MODULAR; e.g.,
HARLEY-DAVIDSON)
PRODUCT FOCUS
(HIGH-VOLUME,
LOW-VARIETY; e.g.,
FRITO-LAY)
MASS
CUSTOMIZATION
(HIGH-VOLUME, HIGH-
VARIETY; e.g.,
DELL COMPUTER)
3. Instructions for
each job
3. Few changes in
the instructions
3. Standardized job
instructions
3. Custom orders
requiring many job
instructions
4. High inventory 4. Low inventory 4. Low inventory 4. Low inventory
relative to the value of
the product
Copyright © 2020 Pearson Education Ltd. All Rights Reserved.
Comparison of Processes (3 of 4)
Table 7.2 Comparison of the Characteristics of Four Types
of Processes
PROCESS FOCUS
(LOW-VOLUME,
HIGH-VARIETY; e.g.,
ARNOLD PALMER
HOSPITAL)
REPETITIVE FOCUS
(MODULAR; e.g.,
HARLEY-DAVIDSON)
PRODUCT FOCUS
(HIGH-VOLUME,
LOW-VARIETY; e.g.,
FRITO-LAY)
MASS
CUSTOMIZATION
(HIGH-VOLUME, HIGH-
VARIETY; e.g.,
DELL COMPUTER)
5. Finished goods
are made to order
and not stored
5. Finished goods
are made to frequent
forecasts
5. Finished goods
are made to a
forecast and stored
5. Finished goods are
build-to-order (BTO)
6. Scheduling is
complex
6. Scheduling is
routine
6. Scheduling is
routine
6. Sophisticated
scheduling
accommodates
custom orders
Copyright © 2020 Pearson Education Ltd. All Rights Reserved.
Comparison of Processes (4 of 4)
Table 7.2 Comparison of the Characteristics of Four Types
of Processes
PROCESS FOCUS
(LOW-VOLUME,
HIGH-VARIETY; e.g.,
ARNOLD PALMER
HOSPITAL)
REPETITIVE FOCUS
(MODULAR; e.g.,
HARLEY-DAVIDSON)
PRODUCT FOCUS
(HIGH-VOLUME,
LOW-VARIETY; e.g.,
FRITO-LAY)
MASS
CUSTOMIZATION
(HIGH-VOLUME, HIGH-
VARIETY; e.g.,
DELL COMPUTER)
7. Fixed costs are
low and variable
costs high
7. Fixed costs are
dependent on
flexibility of the
facility
7. Fixed costs are
high and variable
costs low
7. Fixed costs tend to
be high and variable
costs low
Crossover Chart Example (1 of 2)
•Evaluate three different accounting software products
•Calculate crossover points between software A and B and
between software B and C
Blank TOTAL FIXED COST
DOLLARS REQUIRED PER
ACCOUNTING REPORT
Software A $200,000 $60
Software B $300,000 $25
Copyright © 2020 Pearson Education Ltd. All Rights Reserved.
Focused Processes
•Focus brings efficiency
•Focus on depth of product line rather than breadth
•Focus can be
–Customers
–Products
–Service
–Technology
Copyright © 2020 Pearson Education Ltd. All Rights Reserved.
Selection of Equipment
•Decisions can be complex as alternate methods may be
available
•Important factors may be
–Cost
–Cash flow
–Market stability
–Quality
–Capacity
–Flexibility
Copyright © 2020 Pearson Education Ltd. All Rights Reserved.
Flexibility
•Flexibility is the ability to
respond with little penalty in
time, cost, or customer
value
•May be a competitive
advantage
•May be difficult and
expensive
•Without it, change may
mean starting over
Copyright © 2020 Pearson Education Ltd. All Rights Reserved.
Process Analysis and Design (1 of 3)
•Is the process designed to achieve a competitive
advantage?
•Does the process eliminate steps that do not add value?
•Does the process maximize customer value?
•Will the process win orders?
Copyright © 2020 Pearson Education Ltd. All Rights Reserved.
Process Analysis and Design (2 of 3)
•Flowchart
–Shows the movement of materials
–Harley-Davidson flowchart
•Time-Function Mapping
–Shows flows and time frame
Copyright © 2020 Pearson Education Ltd. All Rights Reserved.
“Baseline” Time-Function Map
Figure 7.4(a)
Copyright © 2020 Pearson Education Ltd. All Rights Reserved.
“Target” Time-Function Map
Figure 7.4(b)
Copyright © 2020 Pearson Education Ltd. All Rights Reserved.
Mass Customization (2 of 4)
Figure 7.2(d)
Copyright © 2020 Pearson Education Ltd. All Rights Reserved.
Mass Customization (3 of 4)
Table 7.1 Mass Customization Provides More Choices Than
Ever
Copyright © 2020 Pearson Education Ltd. All Rights Reserved.
Mass Customization (4 of 4)
•Imaginative product design
•Flexible process design
•Tightly controlled inventory management
•Tight schedules
•Responsive partners in the supply chain
Copyright © 2020 Pearson Education Ltd. All Rights Reserved.
Comparison of Processes (1 of 4)
Table 7.2 Comparison of the Characteristics of Four Types
of Processes
PROCESS FOCUS
(LOW-VOLUME,
HIGH-VARIETY; e.g.,
ARNOLD PALMER
HOSPITAL)
REPETITIVE FOCUS
(MODULAR; e.g.,
HARLEY-DAVIDSON)
PRODUCT FOCUS
(HIGH-VOLUME,
LOW-VARIETY; e.g.,
FRITO-LAY)
MASS
CUSTOMIZATION
(HIGH-VOLUME, HIGH-
VARIETY; e.g.,
DELL COMPUTER)
1. Small quantity
and large variety of
products
1. Long runs, a
standardized product
from modules
1. Large quantity and
small variety of
products
1. Large quantity and
large variety of
products
2. Broadly skilled
operators
2. Moderately trained
employees
2. Less broadly
skilled operators
2. Flexible operators
Copyright © 2020 Pearson Education Ltd. All Rights Reserved.
Comparison of Processes (2 of 4)
Table 7.2 Comparison of the Characteristics of Four Types
of Processes
PROCESS FOCUS
(LOW-VOLUME,
HIGH-VARIETY; e.g.,
ARNOLD PALMER
HOSPITAL)
REPETITIVE FOCUS
(MODULAR; e.g.,
HARLEY-DAVIDSON)
PRODUCT FOCUS
(HIGH-VOLUME,
LOW-VARIETY; e.g.,
FRITO-LAY)
MASS
CUSTOMIZATION
(HIGH-VOLUME, HIGH-
VARIETY; e.g.,
DELL COMPUTER)
3. Instructions for
each job
3. Few changes in
the instructions
3. Standardized job
instructions
3. Custom orders
requiring many job
instructions
4. High inventory 4. Low inventory 4. Low inventory 4. Low inventory
relative to the value of
the product
Copyright © 2020 Pearson Education Ltd. All Rights Reserved.
Comparison of Processes (3 of 4)
Table 7.2 Comparison of the Characteristics of Four Types
of Processes
PROCESS FOCUS
(LOW-VOLUME,
HIGH-VARIETY; e.g.,
ARNOLD PALMER
HOSPITAL)
REPETITIVE FOCUS
(MODULAR; e.g.,
HARLEY-DAVIDSON)
PRODUCT FOCUS
(HIGH-VOLUME,
LOW-VARIETY; e.g.,
FRITO-LAY)
MASS
CUSTOMIZATION
(HIGH-VOLUME, HIGH-
VARIETY; e.g.,
DELL COMPUTER)
5. Finished goods
are made to order
and not stored
5. Finished goods
are made to frequent
forecasts
5. Finished goods
are made to a
forecast and stored
5. Finished goods are
build-to-order (BTO)
6. Scheduling is
complex
6. Scheduling is
routine
6. Scheduling is
routine
6. Sophisticated
scheduling
accommodates
custom orders
Copyright © 2020 Pearson Education Ltd. All Rights Reserved.
Comparison of Processes (4 of 4)
Table 7.2 Comparison of the Characteristics of Four Types
of Processes
PROCESS FOCUS
(LOW-VOLUME,
HIGH-VARIETY; e.g.,
ARNOLD PALMER
HOSPITAL)
REPETITIVE FOCUS
(MODULAR; e.g.,
HARLEY-DAVIDSON)
PRODUCT FOCUS
(HIGH-VOLUME,
LOW-VARIETY; e.g.,
FRITO-LAY)
MASS
CUSTOMIZATION
(HIGH-VOLUME, HIGH-
VARIETY; e.g.,
DELL COMPUTER)
7. Fixed costs are
low and variable
costs high
7. Fixed costs are
dependent on
flexibility of the
facility
7. Fixed costs are
high and variable
costs low
7. Fixed costs tend to
be high and variable
costs low
Copyright © 2020 Pearson Education Ltd. All Rights Reserved.
Crossover Chart Example (1 of 2)
•Evaluate three different accounting software products
•Calculate crossover points between software A and B and
between software B and C
Blank TOTAL FIXED COST
DOLLARS REQUIRED PER
ACCOUNTING REPORT
Software A $200,000 $60
Software B $300,000 $25
Software C $400,000 $10
Crossover Chart Example (2 of 2)
•Software A is most economical from 0 to 2,857 reports
Copyright © 2020 Pearson Education Ltd. All Rights Reserved.
Selection of Equipment
•Decisions can be complex as alternate methods may be
available
•Important factors may be
–Cost
–Cash flow
–Market stability
–Quality
–Capacity
–Flexibility
Copyright © 2020 Pearson Education Ltd. All Rights Reserved.
Flexibility
•Flexibility is the ability to
respond with little penalty in
time, cost, or customer
value
•May be a competitive
advantage
•May be difficult and
expensive
•Without it, change may
mean starting over
Copyright © 2020 Pearson Education Ltd. All Rights Reserved.
Process Analysis and Design (1 of 3)
•Is the process designed to achieve a competitive
advantage?
•Does the process eliminate steps that do not add value?
•Does the process maximize customer value?
•Will the process win orders?
Copyright © 2020 Pearson Education Ltd. All Rights Reserved.
Process Analysis and Design (2 of 3)
•Flowchart
–Shows the movement of materials
–Harley-Davidson flowchart
•Time-Function Mapping
–Shows flows and time frame
Copyright © 2020 Pearson Education Ltd. All Rights Reserved.
“Baseline” Time-Function Map
Figure 7.4(a)
Copyright © 2020 Pearson Education Ltd. All Rights Reserved.
“Target” Time-Function Map
Figure 7.4(b)
Copyright © 2020 Pearson Education Ltd. All Rights Reserved.
Mass Customization (2 of 4)
Figure 7.2(d)
Copyright © 2020 Pearson Education Ltd. All Rights Reserved.
Mass Customization (3 of 4)
Table 7.1 Mass Customization Provides More Choices Than
Ever
Copyright © 2020 Pearson Education Ltd. All Rights Reserved.
Mass Customization (4 of 4)
•Imaginative product design
•Flexible process design
•Tightly controlled inventory management
•Tight schedules
•Responsive partners in the supply chain
Copyright © 2020 Pearson Education Ltd. All Rights Reserved.
Comparison of Processes (1 of 4)
Table 7.2 Comparison of the Characteristics of Four Types
of Processes
PROCESS FOCUS
(LOW-VOLUME,
HIGH-VARIETY; e.g.,
ARNOLD PALMER
HOSPITAL)
REPETITIVE FOCUS
(MODULAR; e.g.,
HARLEY-DAVIDSON)
PRODUCT FOCUS
(HIGH-VOLUME,
LOW-VARIETY; e.g.,
FRITO-LAY)
MASS
CUSTOMIZATION
(HIGH-VOLUME, HIGH-
VARIETY; e.g.,
DELL COMPUTER)
1. Small quantity
and large variety of
products
1. Long runs, a
standardized product
from modules
1. Large quantity and
small variety of
products
1. Large quantity and
large variety of
products
2. Broadly skilled
operators
2. Moderately trained
employees
2. Less broadly
skilled operators
2. Flexible operators
Copyright © 2020 Pearson Education Ltd. All Rights Reserved.
Comparison of Processes (2 of 4)
Table 7.2 Comparison of the Characteristics of Four Types
of Processes
PROCESS FOCUS
(LOW-VOLUME,
HIGH-VARIETY; e.g.,
ARNOLD PALMER
HOSPITAL)
REPETITIVE FOCUS
(MODULAR; e.g.,
HARLEY-DAVIDSON)
PRODUCT FOCUS
(HIGH-VOLUME,
LOW-VARIETY; e.g.,
FRITO-LAY)
MASS
CUSTOMIZATION
(HIGH-VOLUME, HIGH-
VARIETY; e.g.,
DELL COMPUTER)
3. Instructions for
each job
3. Few changes in
the instructions
3. Standardized job
instructions
3. Custom orders
requiring many job
instructions
4. High inventory 4. Low inventory 4. Low inventory 4. Low inventory
relative to the value of
the product
Copyright © 2020 Pearson Education Ltd. All Rights Reserved.
Comparison of Processes (3 of 4)
Table 7.2 Comparison of the Characteristics of Four Types
of Processes
PROCESS FOCUS
(LOW-VOLUME,
HIGH-VARIETY; e.g.,
ARNOLD PALMER
HOSPITAL)
REPETITIVE FOCUS
(MODULAR; e.g.,
HARLEY-DAVIDSON)
PRODUCT FOCUS
(HIGH-VOLUME,
LOW-VARIETY; e.g.,
FRITO-LAY)
MASS
CUSTOMIZATION
(HIGH-VOLUME, HIGH-
VARIETY; e.g.,
DELL COMPUTER)
5. Finished goods
are made to order
and not stored
5. Finished goods
are made to frequent
forecasts
5. Finished goods
are made to a
forecast and stored
5. Finished goods are
build-to-order (BTO)
6. Scheduling is
complex
6. Scheduling is
routine
6. Scheduling is
routine
6. Sophisticated
scheduling
accommodates
custom orders
Copyright © 2020 Pearson Education Ltd. All Rights Reserved.
Comparison of Processes (4 of 4)
Table 7.2 Comparison of the Characteristics of Four Types
of Processes
PROCESS FOCUS
(LOW-VOLUME,
HIGH-VARIETY; e.g.,
ARNOLD PALMER
HOSPITAL)
REPETITIVE FOCUS
(MODULAR; e.g.,
HARLEY-DAVIDSON)
PRODUCT FOCUS
(HIGH-VOLUME,
LOW-VARIETY; e.g.,
FRITO-LAY)
MASS
CUSTOMIZATION
(HIGH-VOLUME, HIGH-
VARIETY; e.g.,
DELL COMPUTER)
7. Fixed costs are
low and variable
costs high
7. Fixed costs are
dependent on
flexibility of the
facility
7. Fixed costs are
high and variable
costs low
7. Fixed costs tend to
be high and variable
costs low
Copyright © 2020 Pearson Education Ltd. All Rights Reserved.
Crossover Chart Example (1 of 2)
•Evaluate three different accounting software products
•Calculate crossover points between software A and B and
between software B and C
Blank TOTAL FIXED COST
DOLLARS REQUIRED PER
ACCOUNTING REPORT
Software A $200,000 $60
Software B $300,000 $25
Software C $400,000 $10
Copyright © 2020 Pearson Education Ltd. All Rights Reserved.
Crossover Chart Example (2 of 2)
•Software A is most economical from 0 to 2,857 reports
•Software B is most economical from 2,857 to 6,666 reports
Crossover Charts
Figure 7.3
Copyright © 2020 Pearson Education Ltd. All Rights Reserved.
Flexibility
•Flexibility is the ability to
respond with little penalty in
time, cost, or customer
value
•May be a competitive
advantage
•May be difficult and
expensive
•Without it, change may
mean starting over
Copyright © 2020 Pearson Education Ltd. All Rights Reserved.
Process Analysis and Design (1 of 3)
•Is the process designed to achieve a competitive
advantage?
•Does the process eliminate steps that do not add value?
•Does the process maximize customer value?
•Will the process win orders?
Copyright © 2020 Pearson Education Ltd. All Rights Reserved.
Process Analysis and Design (2 of 3)
•Flowchart
–Shows the movement of materials
–Harley-Davidson flowchart
•Time-Function Mapping
–Shows flows and time frame
Copyright © 2020 Pearson Education Ltd. All Rights Reserved.
“Baseline” Time-Function Map
Figure 7.4(a)
Copyright © 2020 Pearson Education Ltd. All Rights Reserved.
“Target” Time-Function Map
Figure 7.4(b)
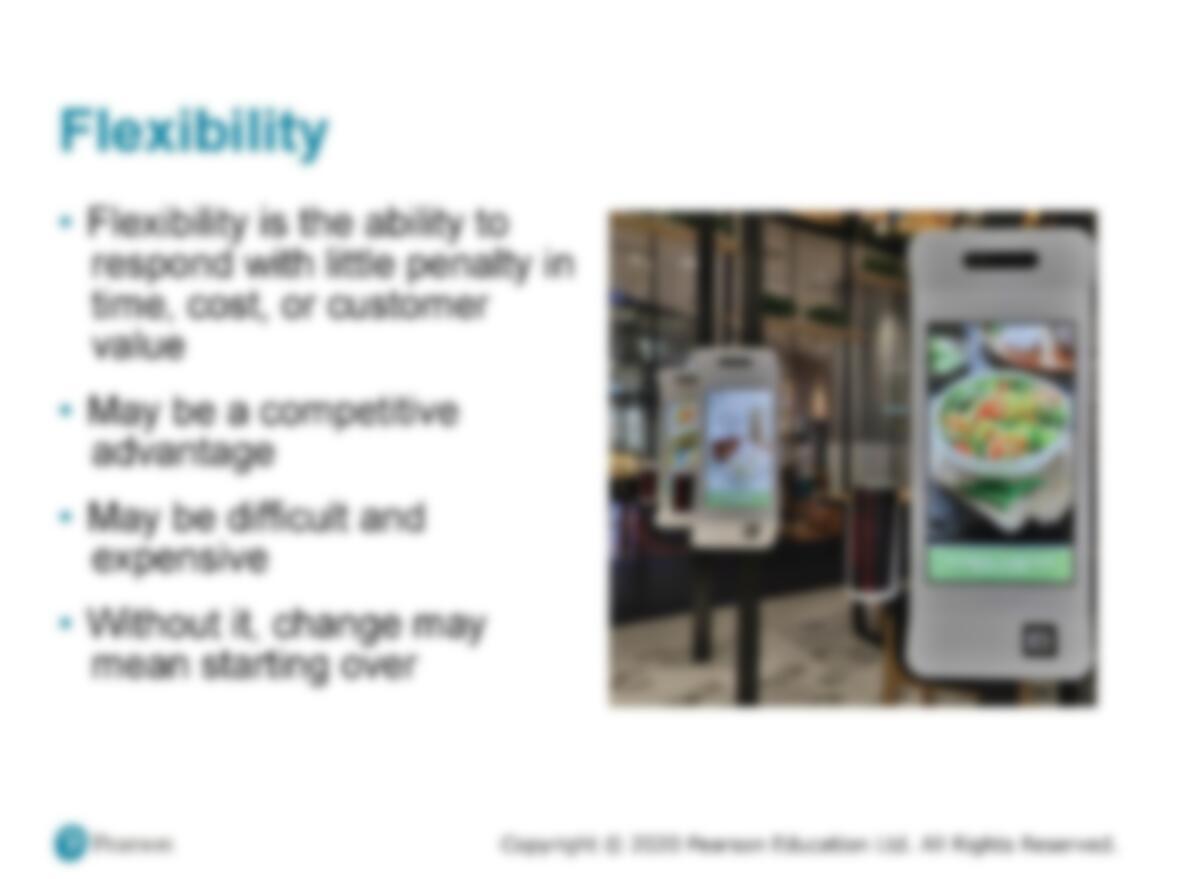
Copyright © 2020 Pearson Education Ltd. All Rights Reserved.
Mass Customization (2 of 4)
Figure 7.2(d)
Copyright © 2020 Pearson Education Ltd. All Rights Reserved.
Mass Customization (3 of 4)
Table 7.1 Mass Customization Provides More Choices Than
Ever
Copyright © 2020 Pearson Education Ltd. All Rights Reserved.
Mass Customization (4 of 4)
•Imaginative product design
•Flexible process design
•Tightly controlled inventory management
•Tight schedules
•Responsive partners in the supply chain
Copyright © 2020 Pearson Education Ltd. All Rights Reserved.
Comparison of Processes (1 of 4)
Table 7.2 Comparison of the Characteristics of Four Types
of Processes
PROCESS FOCUS
(LOW-VOLUME,
HIGH-VARIETY; e.g.,
ARNOLD PALMER
HOSPITAL)
REPETITIVE FOCUS
(MODULAR; e.g.,
HARLEY-DAVIDSON)
PRODUCT FOCUS
(HIGH-VOLUME,
LOW-VARIETY; e.g.,
FRITO-LAY)
MASS
CUSTOMIZATION
(HIGH-VOLUME, HIGH-
VARIETY; e.g.,
DELL COMPUTER)
1. Small quantity
and large variety of
products
1. Long runs, a
standardized product
from modules
1. Large quantity and
small variety of
products
1. Large quantity and
large variety of
products
2. Broadly skilled
operators
2. Moderately trained
employees
2. Less broadly
skilled operators
2. Flexible operators
Copyright © 2020 Pearson Education Ltd. All Rights Reserved.
Comparison of Processes (2 of 4)
Table 7.2 Comparison of the Characteristics of Four Types
of Processes
PROCESS FOCUS
(LOW-VOLUME,
HIGH-VARIETY; e.g.,
ARNOLD PALMER
HOSPITAL)
REPETITIVE FOCUS
(MODULAR; e.g.,
HARLEY-DAVIDSON)
PRODUCT FOCUS
(HIGH-VOLUME,
LOW-VARIETY; e.g.,
FRITO-LAY)
MASS
CUSTOMIZATION
(HIGH-VOLUME, HIGH-
VARIETY; e.g.,
DELL COMPUTER)
3. Instructions for
each job
3. Few changes in
the instructions
3. Standardized job
instructions
3. Custom orders
requiring many job
instructions
4. High inventory 4. Low inventory 4. Low inventory 4. Low inventory
relative to the value of
the product
Copyright © 2020 Pearson Education Ltd. All Rights Reserved.
Comparison of Processes (3 of 4)
Table 7.2 Comparison of the Characteristics of Four Types
of Processes
PROCESS FOCUS
(LOW-VOLUME,
HIGH-VARIETY; e.g.,
ARNOLD PALMER
HOSPITAL)
REPETITIVE FOCUS
(MODULAR; e.g.,
HARLEY-DAVIDSON)
PRODUCT FOCUS
(HIGH-VOLUME,
LOW-VARIETY; e.g.,
FRITO-LAY)
MASS
CUSTOMIZATION
(HIGH-VOLUME, HIGH-
VARIETY; e.g.,
DELL COMPUTER)
5. Finished goods
are made to order
and not stored
5. Finished goods
are made to frequent
forecasts
5. Finished goods
are made to a
forecast and stored
5. Finished goods are
build-to-order (BTO)
6. Scheduling is
complex
6. Scheduling is
routine
6. Scheduling is
routine
6. Sophisticated
scheduling
accommodates
custom orders
Copyright © 2020 Pearson Education Ltd. All Rights Reserved.
Comparison of Processes (4 of 4)
Table 7.2 Comparison of the Characteristics of Four Types
of Processes
PROCESS FOCUS
(LOW-VOLUME,
HIGH-VARIETY; e.g.,
ARNOLD PALMER
HOSPITAL)
REPETITIVE FOCUS
(MODULAR; e.g.,
HARLEY-DAVIDSON)
PRODUCT FOCUS
(HIGH-VOLUME,
LOW-VARIETY; e.g.,
FRITO-LAY)
MASS
CUSTOMIZATION
(HIGH-VOLUME, HIGH-
VARIETY; e.g.,
DELL COMPUTER)
7. Fixed costs are
low and variable
costs high
7. Fixed costs are
dependent on
flexibility of the
facility
7. Fixed costs are
high and variable
costs low
7. Fixed costs tend to
be high and variable
costs low
Copyright © 2020 Pearson Education Ltd. All Rights Reserved.
Crossover Chart Example (1 of 2)
•Evaluate three different accounting software products
•Calculate crossover points between software A and B and
between software B and C
Blank TOTAL FIXED COST
DOLLARS REQUIRED PER
ACCOUNTING REPORT
Software A $200,000 $60
Software B $300,000 $25
Software C $400,000 $10
Copyright © 2020 Pearson Education Ltd. All Rights Reserved.
Crossover Chart Example (2 of 2)
•Software A is most economical from 0 to 2,857 reports
•Software B is most economical from 2,857 to 6,666 reports
Copyright © 2020 Pearson Education Ltd. All Rights Reserved.
Crossover Charts
Figure 7.3
Focused Processes
•Focus brings efficiency
•Focus on depth of product line rather than breadth
•Focus can be
–Customers
–Products
–Service
–Technology
Copyright © 2020 Pearson Education Ltd. All Rights Reserved.
Process Analysis and Design (1 of 3)
•Is the process designed to achieve a competitive
advantage?
•Does the process eliminate steps that do not add value?
•Does the process maximize customer value?
•Will the process win orders?
Copyright © 2020 Pearson Education Ltd. All Rights Reserved.
Process Analysis and Design (2 of 3)
•Flowchart
–Shows the movement of materials
–Harley-Davidson flowchart
•Time-Function Mapping
–Shows flows and time frame
Copyright © 2020 Pearson Education Ltd. All Rights Reserved.
“Baseline” Time-Function Map
Figure 7.4(a)
Copyright © 2020 Pearson Education Ltd. All Rights Reserved.
“Target” Time-Function Map
Figure 7.4(b)
Copyright © 2020 Pearson Education Ltd. All Rights Reserved.
Mass Customization (2 of 4)
Figure 7.2(d)
Copyright © 2020 Pearson Education Ltd. All Rights Reserved.
Mass Customization (3 of 4)
Table 7.1 Mass Customization Provides More Choices Than
Ever
Copyright © 2020 Pearson Education Ltd. All Rights Reserved.
Mass Customization (4 of 4)
•Imaginative product design
•Flexible process design
•Tightly controlled inventory management
•Tight schedules
•Responsive partners in the supply chain
Copyright © 2020 Pearson Education Ltd. All Rights Reserved.
Comparison of Processes (1 of 4)
Table 7.2 Comparison of the Characteristics of Four Types
of Processes
PROCESS FOCUS
(LOW-VOLUME,
HIGH-VARIETY; e.g.,
ARNOLD PALMER
HOSPITAL)
REPETITIVE FOCUS
(MODULAR; e.g.,
HARLEY-DAVIDSON)
PRODUCT FOCUS
(HIGH-VOLUME,
LOW-VARIETY; e.g.,
FRITO-LAY)
MASS
CUSTOMIZATION
(HIGH-VOLUME, HIGH-
VARIETY; e.g.,
DELL COMPUTER)
1. Small quantity
and large variety of
products
1. Long runs, a
standardized product
from modules
1. Large quantity and
small variety of
products
1. Large quantity and
large variety of
products
2. Broadly skilled
operators
2. Moderately trained
employees
2. Less broadly
skilled operators
2. Flexible operators
Copyright © 2020 Pearson Education Ltd. All Rights Reserved.
Comparison of Processes (2 of 4)
Table 7.2 Comparison of the Characteristics of Four Types
of Processes
PROCESS FOCUS
(LOW-VOLUME,
HIGH-VARIETY; e.g.,
ARNOLD PALMER
HOSPITAL)
REPETITIVE FOCUS
(MODULAR; e.g.,
HARLEY-DAVIDSON)
PRODUCT FOCUS
(HIGH-VOLUME,
LOW-VARIETY; e.g.,
FRITO-LAY)
MASS
CUSTOMIZATION
(HIGH-VOLUME, HIGH-
VARIETY; e.g.,
DELL COMPUTER)
3. Instructions for
each job
3. Few changes in
the instructions
3. Standardized job
instructions
3. Custom orders
requiring many job
instructions
4. High inventory 4. Low inventory 4. Low inventory 4. Low inventory
relative to the value of
the product
Copyright © 2020 Pearson Education Ltd. All Rights Reserved.
Comparison of Processes (3 of 4)
Table 7.2 Comparison of the Characteristics of Four Types
of Processes
PROCESS FOCUS
(LOW-VOLUME,
HIGH-VARIETY; e.g.,
ARNOLD PALMER
HOSPITAL)
REPETITIVE FOCUS
(MODULAR; e.g.,
HARLEY-DAVIDSON)
PRODUCT FOCUS
(HIGH-VOLUME,
LOW-VARIETY; e.g.,
FRITO-LAY)
MASS
CUSTOMIZATION
(HIGH-VOLUME, HIGH-
VARIETY; e.g.,
DELL COMPUTER)
5. Finished goods
are made to order
and not stored
5. Finished goods
are made to frequent
forecasts
5. Finished goods
are made to a
forecast and stored
5. Finished goods are
build-to-order (BTO)
6. Scheduling is
complex
6. Scheduling is
routine
6. Scheduling is
routine
6. Sophisticated
scheduling
accommodates
custom orders
Copyright © 2020 Pearson Education Ltd. All Rights Reserved.
Comparison of Processes (4 of 4)
Table 7.2 Comparison of the Characteristics of Four Types
of Processes
PROCESS FOCUS
(LOW-VOLUME,
HIGH-VARIETY; e.g.,
ARNOLD PALMER
HOSPITAL)
REPETITIVE FOCUS
(MODULAR; e.g.,
HARLEY-DAVIDSON)
PRODUCT FOCUS
(HIGH-VOLUME,
LOW-VARIETY; e.g.,
FRITO-LAY)
MASS
CUSTOMIZATION
(HIGH-VOLUME, HIGH-
VARIETY; e.g.,
DELL COMPUTER)
7. Fixed costs are
low and variable
costs high
7. Fixed costs are
dependent on
flexibility of the
facility
7. Fixed costs are
high and variable
costs low
7. Fixed costs tend to
be high and variable
costs low
Copyright © 2020 Pearson Education Ltd. All Rights Reserved.
Crossover Chart Example (1 of 2)
•Evaluate three different accounting software products
•Calculate crossover points between software A and B and
between software B and C
Blank TOTAL FIXED COST
DOLLARS REQUIRED PER
ACCOUNTING REPORT
Software A $200,000 $60
Software B $300,000 $25
Software C $400,000 $10
Copyright © 2020 Pearson Education Ltd. All Rights Reserved.
Crossover Chart Example (2 of 2)
•Software A is most economical from 0 to 2,857 reports
•Software B is most economical from 2,857 to 6,666 reports
Copyright © 2020 Pearson Education Ltd. All Rights Reserved.
Crossover Charts
Figure 7.3
Copyright © 2020 Pearson Education Ltd. All Rights Reserved.
Focused Processes
•Focus brings efficiency
•Focus on depth of product line rather than breadth
•Focus can be
–Customers
–Products
–Service
–Technology
Selection of Equipment
•Decisions can be complex as alternate methods may be
available
•Important factors may be
–Cost
–Cash flow
–Market stability
–Quality
–Capacity
–Flexibility
Copyright © 2020 Pearson Education Ltd. All Rights Reserved.
Process Analysis and Design (2 of 3)
•Flowchart
–Shows the movement of materials
–Harley-Davidson flowchart
•Time-Function Mapping
–Shows flows and time frame
Copyright © 2020 Pearson Education Ltd. All Rights Reserved.
“Baseline” Time-Function Map
Figure 7.4(a)
Copyright © 2020 Pearson Education Ltd. All Rights Reserved.
“Target” Time-Function Map
Figure 7.4(b)
Copyright © 2020 Pearson Education Ltd. All Rights Reserved.
Mass Customization (2 of 4)
Figure 7.2(d)
Copyright © 2020 Pearson Education Ltd. All Rights Reserved.
Mass Customization (3 of 4)
Table 7.1 Mass Customization Provides More Choices Than
Ever
Copyright © 2020 Pearson Education Ltd. All Rights Reserved.
Mass Customization (4 of 4)
•Imaginative product design
•Flexible process design
•Tightly controlled inventory management
•Tight schedules
•Responsive partners in the supply chain
Copyright © 2020 Pearson Education Ltd. All Rights Reserved.
Comparison of Processes (1 of 4)
Table 7.2 Comparison of the Characteristics of Four Types
of Processes
PROCESS FOCUS
(LOW-VOLUME,
HIGH-VARIETY; e.g.,
ARNOLD PALMER
HOSPITAL)
REPETITIVE FOCUS
(MODULAR; e.g.,
HARLEY-DAVIDSON)
PRODUCT FOCUS
(HIGH-VOLUME,
LOW-VARIETY; e.g.,
FRITO-LAY)
MASS
CUSTOMIZATION
(HIGH-VOLUME, HIGH-
VARIETY; e.g.,
DELL COMPUTER)
1. Small quantity
and large variety of
products
1. Long runs, a
standardized product
from modules
1. Large quantity and
small variety of
products
1. Large quantity and
large variety of
products
2. Broadly skilled
operators
2. Moderately trained
employees
2. Less broadly
skilled operators
2. Flexible operators
Copyright © 2020 Pearson Education Ltd. All Rights Reserved.
Comparison of Processes (2 of 4)
Table 7.2 Comparison of the Characteristics of Four Types
of Processes
PROCESS FOCUS
(LOW-VOLUME,
HIGH-VARIETY; e.g.,
ARNOLD PALMER
HOSPITAL)
REPETITIVE FOCUS
(MODULAR; e.g.,
HARLEY-DAVIDSON)
PRODUCT FOCUS
(HIGH-VOLUME,
LOW-VARIETY; e.g.,
FRITO-LAY)
MASS
CUSTOMIZATION
(HIGH-VOLUME, HIGH-
VARIETY; e.g.,
DELL COMPUTER)
3. Instructions for
each job
3. Few changes in
the instructions
3. Standardized job
instructions
3. Custom orders
requiring many job
instructions
4. High inventory 4. Low inventory 4. Low inventory 4. Low inventory
relative to the value of
the product
Copyright © 2020 Pearson Education Ltd. All Rights Reserved.
Comparison of Processes (3 of 4)
Table 7.2 Comparison of the Characteristics of Four Types
of Processes
PROCESS FOCUS
(LOW-VOLUME,
HIGH-VARIETY; e.g.,
ARNOLD PALMER
HOSPITAL)
REPETITIVE FOCUS
(MODULAR; e.g.,
HARLEY-DAVIDSON)
PRODUCT FOCUS
(HIGH-VOLUME,
LOW-VARIETY; e.g.,
FRITO-LAY)
MASS
CUSTOMIZATION
(HIGH-VOLUME, HIGH-
VARIETY; e.g.,
DELL COMPUTER)
5. Finished goods
are made to order
and not stored
5. Finished goods
are made to frequent
forecasts
5. Finished goods
are made to a
forecast and stored
5. Finished goods are
build-to-order (BTO)
6. Scheduling is
complex
6. Scheduling is
routine
6. Scheduling is
routine
6. Sophisticated
scheduling
accommodates
custom orders
Copyright © 2020 Pearson Education Ltd. All Rights Reserved.
Comparison of Processes (4 of 4)
Table 7.2 Comparison of the Characteristics of Four Types
of Processes
PROCESS FOCUS
(LOW-VOLUME,
HIGH-VARIETY; e.g.,
ARNOLD PALMER
HOSPITAL)
REPETITIVE FOCUS
(MODULAR; e.g.,
HARLEY-DAVIDSON)
PRODUCT FOCUS
(HIGH-VOLUME,
LOW-VARIETY; e.g.,
FRITO-LAY)
MASS
CUSTOMIZATION
(HIGH-VOLUME, HIGH-
VARIETY; e.g.,
DELL COMPUTER)
7. Fixed costs are
low and variable
costs high
7. Fixed costs are
dependent on
flexibility of the
facility
7. Fixed costs are
high and variable
costs low
7. Fixed costs tend to
be high and variable
costs low
Copyright © 2020 Pearson Education Ltd. All Rights Reserved.
Crossover Chart Example (1 of 2)
•Evaluate three different accounting software products
•Calculate crossover points between software A and B and
between software B and C
Blank TOTAL FIXED COST
DOLLARS REQUIRED PER
ACCOUNTING REPORT
Software A $200,000 $60
Software B $300,000 $25
Software C $400,000 $10
Copyright © 2020 Pearson Education Ltd. All Rights Reserved.
Crossover Chart Example (2 of 2)
•Software A is most economical from 0 to 2,857 reports
•Software B is most economical from 2,857 to 6,666 reports
Copyright © 2020 Pearson Education Ltd. All Rights Reserved.
Crossover Charts
Figure 7.3
Copyright © 2020 Pearson Education Ltd. All Rights Reserved.
Focused Processes
•Focus brings efficiency
•Focus on depth of product line rather than breadth
•Focus can be
–Customers
–Products
–Service
–Technology
Copyright © 2020 Pearson Education Ltd. All Rights Reserved.
Selection of Equipment
•Decisions can be complex as alternate methods may be
available
•Important factors may be
–Cost
–Cash flow
–Market stability
–Quality
–Capacity
–Flexibility
Flexibility
•Flexibility is the ability to
respond with little penalty in
time, cost, or customer
value
•May be a competitive
advantage
•May be difficult and
expensive
•Without it, change may
Copyright © 2020 Pearson Education Ltd. All Rights Reserved.
“Baseline” Time-Function Map
Figure 7.4(a)
Copyright © 2020 Pearson Education Ltd. All Rights Reserved.
“Target” Time-Function Map
Figure 7.4(b)
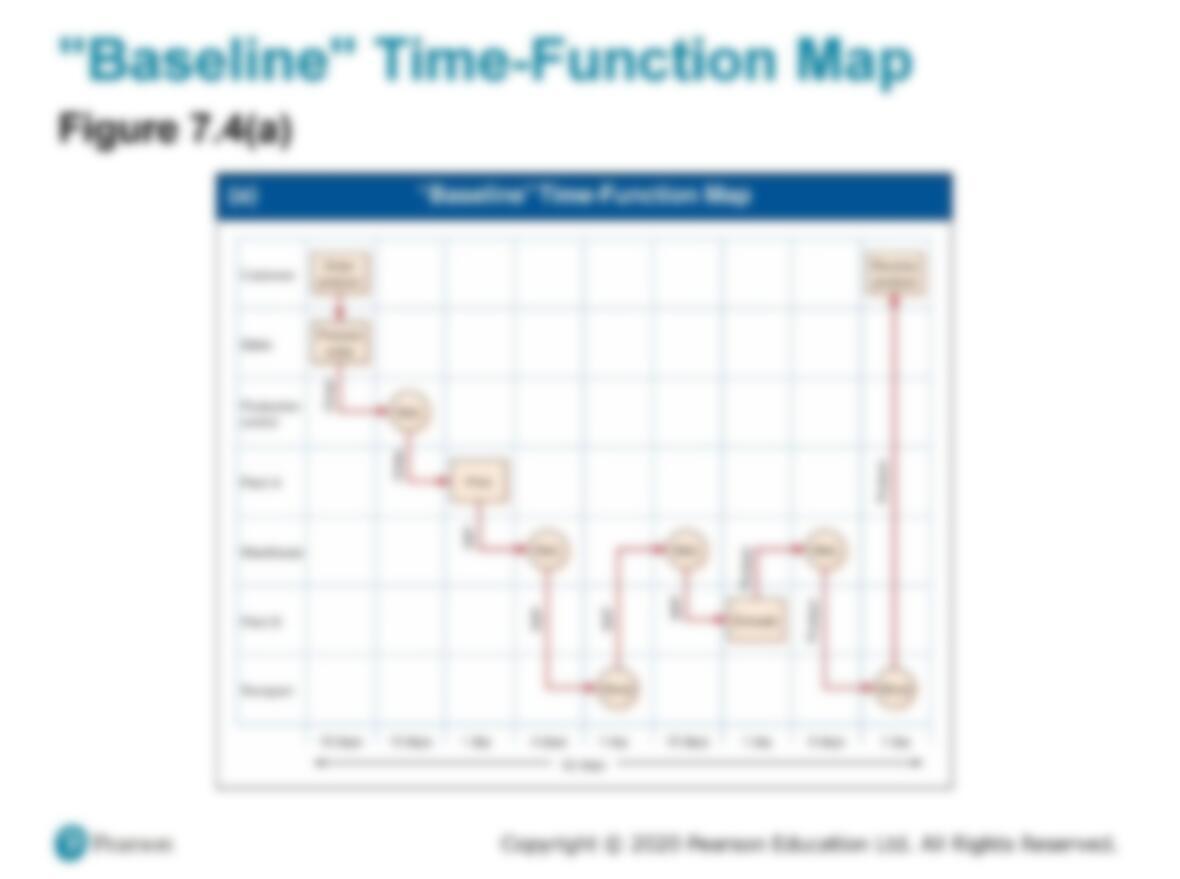
Copyright © 2020 Pearson Education Ltd. All Rights Reserved.
Mass Customization (2 of 4)
Figure 7.2(d)
Copyright © 2020 Pearson Education Ltd. All Rights Reserved.
Mass Customization (3 of 4)
Table 7.1 Mass Customization Provides More Choices Than
Ever
Copyright © 2020 Pearson Education Ltd. All Rights Reserved.
Mass Customization (4 of 4)
•Imaginative product design
•Flexible process design
•Tightly controlled inventory management
•Tight schedules
•Responsive partners in the supply chain
Copyright © 2020 Pearson Education Ltd. All Rights Reserved.
Comparison of Processes (1 of 4)
Table 7.2 Comparison of the Characteristics of Four Types
of Processes
PROCESS FOCUS
(LOW-VOLUME,
HIGH-VARIETY; e.g.,
ARNOLD PALMER
HOSPITAL)
REPETITIVE FOCUS
(MODULAR; e.g.,
HARLEY-DAVIDSON)
PRODUCT FOCUS
(HIGH-VOLUME,
LOW-VARIETY; e.g.,
FRITO-LAY)
MASS
CUSTOMIZATION
(HIGH-VOLUME, HIGH-
VARIETY; e.g.,
DELL COMPUTER)
1. Small quantity
and large variety of
products
1. Long runs, a
standardized product
from modules
1. Large quantity and
small variety of
products
1. Large quantity and
large variety of
products
2. Broadly skilled
operators
2. Moderately trained
employees
2. Less broadly
skilled operators
2. Flexible operators
Copyright © 2020 Pearson Education Ltd. All Rights Reserved.
Comparison of Processes (2 of 4)
Table 7.2 Comparison of the Characteristics of Four Types
of Processes
PROCESS FOCUS
(LOW-VOLUME,
HIGH-VARIETY; e.g.,
ARNOLD PALMER
HOSPITAL)
REPETITIVE FOCUS
(MODULAR; e.g.,
HARLEY-DAVIDSON)
PRODUCT FOCUS
(HIGH-VOLUME,
LOW-VARIETY; e.g.,
FRITO-LAY)
MASS
CUSTOMIZATION
(HIGH-VOLUME, HIGH-
VARIETY; e.g.,
DELL COMPUTER)
3. Instructions for
each job
3. Few changes in
the instructions
3. Standardized job
instructions
3. Custom orders
requiring many job
instructions
4. High inventory 4. Low inventory 4. Low inventory 4. Low inventory
relative to the value of
the product
Copyright © 2020 Pearson Education Ltd. All Rights Reserved.
Comparison of Processes (3 of 4)
Table 7.2 Comparison of the Characteristics of Four Types
of Processes
PROCESS FOCUS
(LOW-VOLUME,
HIGH-VARIETY; e.g.,
ARNOLD PALMER
HOSPITAL)
REPETITIVE FOCUS
(MODULAR; e.g.,
HARLEY-DAVIDSON)
PRODUCT FOCUS
(HIGH-VOLUME,
LOW-VARIETY; e.g.,
FRITO-LAY)
MASS
CUSTOMIZATION
(HIGH-VOLUME, HIGH-
VARIETY; e.g.,
DELL COMPUTER)
5. Finished goods
are made to order
and not stored
5. Finished goods
are made to frequent
forecasts
5. Finished goods
are made to a
forecast and stored
5. Finished goods are
build-to-order (BTO)
6. Scheduling is
complex
6. Scheduling is
routine
6. Scheduling is
routine
6. Sophisticated
scheduling
accommodates
custom orders
Copyright © 2020 Pearson Education Ltd. All Rights Reserved.
Comparison of Processes (4 of 4)
Table 7.2 Comparison of the Characteristics of Four Types
of Processes
PROCESS FOCUS
(LOW-VOLUME,
HIGH-VARIETY; e.g.,
ARNOLD PALMER
HOSPITAL)
REPETITIVE FOCUS
(MODULAR; e.g.,
HARLEY-DAVIDSON)
PRODUCT FOCUS
(HIGH-VOLUME,
LOW-VARIETY; e.g.,
FRITO-LAY)
MASS
CUSTOMIZATION
(HIGH-VOLUME, HIGH-
VARIETY; e.g.,
DELL COMPUTER)
7. Fixed costs are
low and variable
costs high
7. Fixed costs are
dependent on
flexibility of the
facility
7. Fixed costs are
high and variable
costs low
7. Fixed costs tend to
be high and variable
costs low
Copyright © 2020 Pearson Education Ltd. All Rights Reserved.
Crossover Chart Example (1 of 2)
•Evaluate three different accounting software products
•Calculate crossover points between software A and B and
between software B and C
Blank TOTAL FIXED COST
DOLLARS REQUIRED PER
ACCOUNTING REPORT
Software A $200,000 $60
Software B $300,000 $25
Software C $400,000 $10
Copyright © 2020 Pearson Education Ltd. All Rights Reserved.
Crossover Chart Example (2 of 2)
•Software A is most economical from 0 to 2,857 reports
•Software B is most economical from 2,857 to 6,666 reports
Copyright © 2020 Pearson Education Ltd. All Rights Reserved.
Crossover Charts
Figure 7.3
Copyright © 2020 Pearson Education Ltd. All Rights Reserved.
Focused Processes
•Focus brings efficiency
•Focus on depth of product line rather than breadth
•Focus can be
–Customers
–Products
–Service
–Technology
Copyright © 2020 Pearson Education Ltd. All Rights Reserved.
Selection of Equipment
•Decisions can be complex as alternate methods may be
available
•Important factors may be
–Cost
–Cash flow
–Market stability
–Quality
–Capacity
–Flexibility
Copyright © 2020 Pearson Education Ltd. All Rights Reserved.
Flexibility
•Flexibility is the ability to
respond with little penalty in
time, cost, or customer
value
•May be a competitive
advantage
•May be difficult and
expensive
•Without it, change may
mean starting over
Process Analysis and Design (1 of 3)
•Is the process designed to achieve a competitive
advantage?
•Does the process eliminate steps that do not add value?
•Does the process maximize customer value?
•Will the process win orders?
Copyright © 2020 Pearson Education Ltd. All Rights Reserved.
“Target” Time-Function Map
Figure 7.4(b)
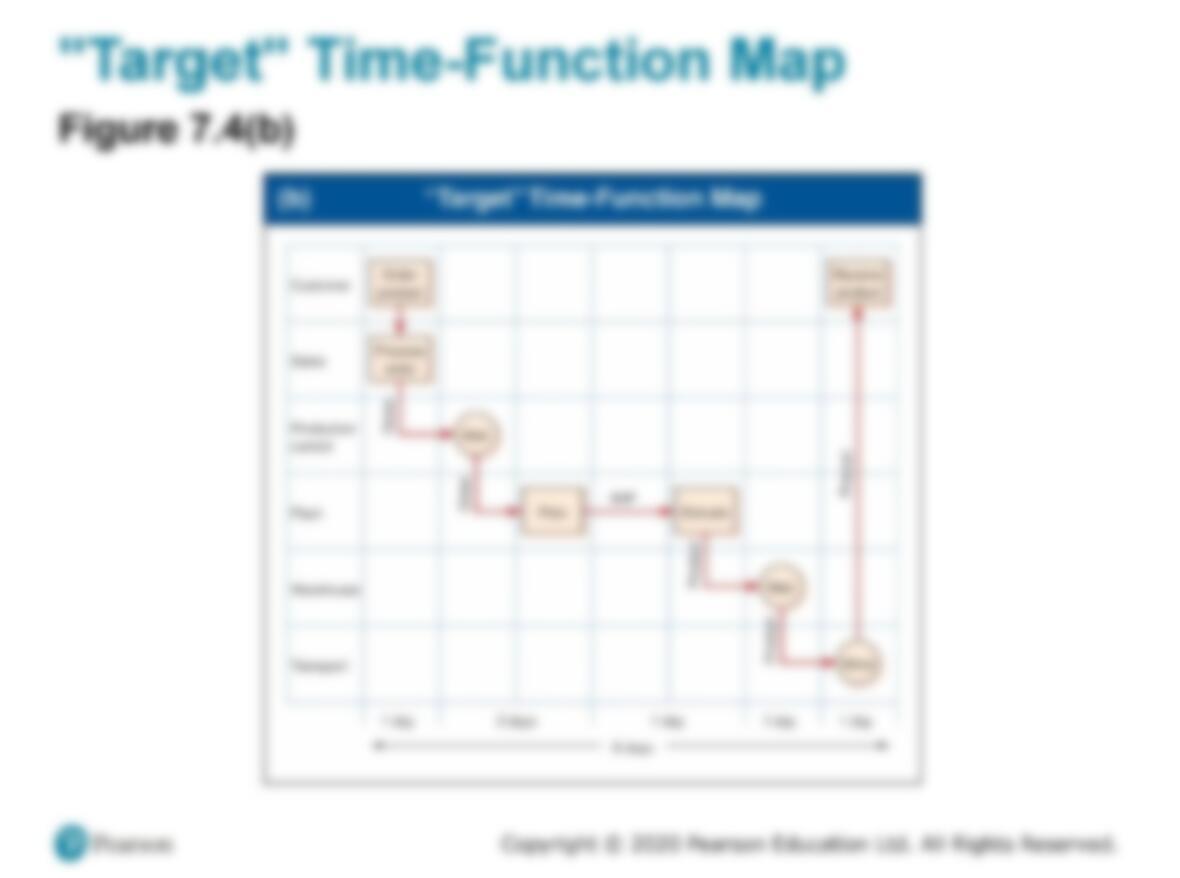
Copyright © 2020 Pearson Education Ltd. All Rights Reserved.
Mass Customization (2 of 4)
Figure 7.2(d)
Copyright © 2020 Pearson Education Ltd. All Rights Reserved.
Mass Customization (3 of 4)
Table 7.1 Mass Customization Provides More Choices Than
Ever
Copyright © 2020 Pearson Education Ltd. All Rights Reserved.
Mass Customization (4 of 4)
•Imaginative product design
•Flexible process design
•Tightly controlled inventory management
•Tight schedules
•Responsive partners in the supply chain
Copyright © 2020 Pearson Education Ltd. All Rights Reserved.
Comparison of Processes (1 of 4)
Table 7.2 Comparison of the Characteristics of Four Types
of Processes
PROCESS FOCUS
(LOW-VOLUME,
HIGH-VARIETY; e.g.,
ARNOLD PALMER
HOSPITAL)
REPETITIVE FOCUS
(MODULAR; e.g.,
HARLEY-DAVIDSON)
PRODUCT FOCUS
(HIGH-VOLUME,
LOW-VARIETY; e.g.,
FRITO-LAY)
MASS
CUSTOMIZATION
(HIGH-VOLUME, HIGH-
VARIETY; e.g.,
DELL COMPUTER)
1. Small quantity
and large variety of
products
1. Long runs, a
standardized product
from modules
1. Large quantity and
small variety of
products
1. Large quantity and
large variety of
products
2. Broadly skilled
operators
2. Moderately trained
employees
2. Less broadly
skilled operators
2. Flexible operators
Copyright © 2020 Pearson Education Ltd. All Rights Reserved.
Comparison of Processes (2 of 4)
Table 7.2 Comparison of the Characteristics of Four Types
of Processes
PROCESS FOCUS
(LOW-VOLUME,
HIGH-VARIETY; e.g.,
ARNOLD PALMER
HOSPITAL)
REPETITIVE FOCUS
(MODULAR; e.g.,
HARLEY-DAVIDSON)
PRODUCT FOCUS
(HIGH-VOLUME,
LOW-VARIETY; e.g.,
FRITO-LAY)
MASS
CUSTOMIZATION
(HIGH-VOLUME, HIGH-
VARIETY; e.g.,
DELL COMPUTER)
3. Instructions for
each job
3. Few changes in
the instructions
3. Standardized job
instructions
3. Custom orders
requiring many job
instructions
4. High inventory 4. Low inventory 4. Low inventory 4. Low inventory
relative to the value of
the product
Copyright © 2020 Pearson Education Ltd. All Rights Reserved.
Comparison of Processes (3 of 4)
Table 7.2 Comparison of the Characteristics of Four Types
of Processes
PROCESS FOCUS
(LOW-VOLUME,
HIGH-VARIETY; e.g.,
ARNOLD PALMER
HOSPITAL)
REPETITIVE FOCUS
(MODULAR; e.g.,
HARLEY-DAVIDSON)
PRODUCT FOCUS
(HIGH-VOLUME,
LOW-VARIETY; e.g.,
FRITO-LAY)
MASS
CUSTOMIZATION
(HIGH-VOLUME, HIGH-
VARIETY; e.g.,
DELL COMPUTER)
5. Finished goods
are made to order
and not stored
5. Finished goods
are made to frequent
forecasts
5. Finished goods
are made to a
forecast and stored
5. Finished goods are
build-to-order (BTO)
6. Scheduling is
complex
6. Scheduling is
routine
6. Scheduling is
routine
6. Sophisticated
scheduling
accommodates
custom orders
Copyright © 2020 Pearson Education Ltd. All Rights Reserved.
Comparison of Processes (4 of 4)
Table 7.2 Comparison of the Characteristics of Four Types
of Processes
PROCESS FOCUS
(LOW-VOLUME,
HIGH-VARIETY; e.g.,
ARNOLD PALMER
HOSPITAL)
REPETITIVE FOCUS
(MODULAR; e.g.,
HARLEY-DAVIDSON)
PRODUCT FOCUS
(HIGH-VOLUME,
LOW-VARIETY; e.g.,
FRITO-LAY)
MASS
CUSTOMIZATION
(HIGH-VOLUME, HIGH-
VARIETY; e.g.,
DELL COMPUTER)
7. Fixed costs are
low and variable
costs high
7. Fixed costs are
dependent on
flexibility of the
facility
7. Fixed costs are
high and variable
costs low
7. Fixed costs tend to
be high and variable
costs low
Copyright © 2020 Pearson Education Ltd. All Rights Reserved.
Crossover Chart Example (1 of 2)
•Evaluate three different accounting software products
•Calculate crossover points between software A and B and
between software B and C
Blank TOTAL FIXED COST
DOLLARS REQUIRED PER
ACCOUNTING REPORT
Software A $200,000 $60
Software B $300,000 $25
Software C $400,000 $10
Copyright © 2020 Pearson Education Ltd. All Rights Reserved.
Crossover Chart Example (2 of 2)
•Software A is most economical from 0 to 2,857 reports
•Software B is most economical from 2,857 to 6,666 reports
Copyright © 2020 Pearson Education Ltd. All Rights Reserved.
Crossover Charts
Figure 7.3
Copyright © 2020 Pearson Education Ltd. All Rights Reserved.
Focused Processes
•Focus brings efficiency
•Focus on depth of product line rather than breadth
•Focus can be
–Customers
–Products
–Service
–Technology
Copyright © 2020 Pearson Education Ltd. All Rights Reserved.
Selection of Equipment
•Decisions can be complex as alternate methods may be
available
•Important factors may be
–Cost
–Cash flow
–Market stability
–Quality
–Capacity
–Flexibility
Copyright © 2020 Pearson Education Ltd. All Rights Reserved.
Flexibility
•Flexibility is the ability to
respond with little penalty in
time, cost, or customer
value
•May be a competitive
advantage
•May be difficult and
expensive
•Without it, change may
mean starting over
Copyright © 2020 Pearson Education Ltd. All Rights Reserved.
Process Analysis and Design (1 of 3)
•Is the process designed to achieve a competitive
advantage?
•Does the process eliminate steps that do not add value?
•Does the process maximize customer value?
•Will the process win orders?
Process Analysis and Design (2 of 3)
•Flowchart
–Shows the movement of materials
–Harley-Davidson flowchart
•Time-Function Mapping
–Shows flows and time frame
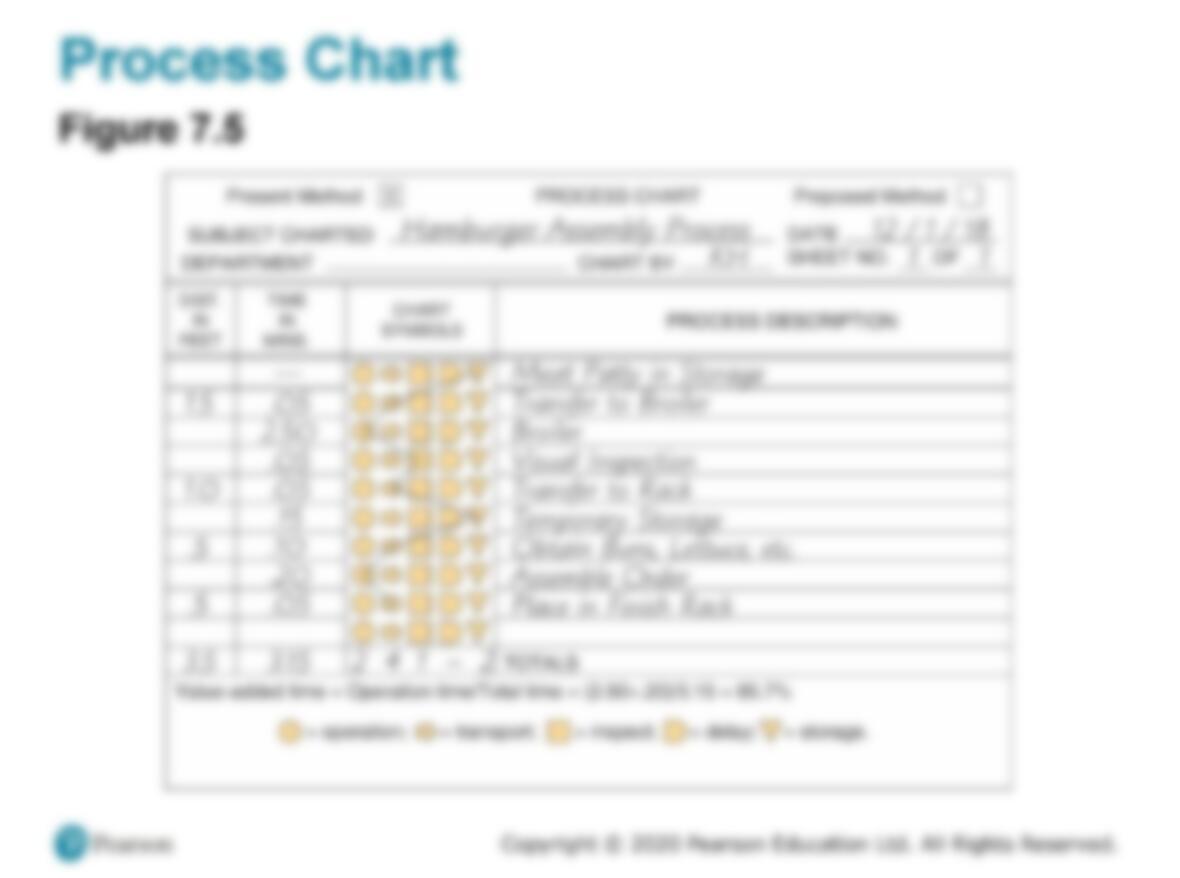
Copyright © 2020 Pearson Education Ltd. All Rights Reserved.
Mass Customization (2 of 4)
Figure 7.2(d)
Copyright © 2020 Pearson Education Ltd. All Rights Reserved.
Mass Customization (3 of 4)
Table 7.1 Mass Customization Provides More Choices Than
Ever
Copyright © 2020 Pearson Education Ltd. All Rights Reserved.
Mass Customization (4 of 4)
•Imaginative product design
•Flexible process design
•Tightly controlled inventory management
•Tight schedules
•Responsive partners in the supply chain
Copyright © 2020 Pearson Education Ltd. All Rights Reserved.
Comparison of Processes (1 of 4)
Table 7.2 Comparison of the Characteristics of Four Types
of Processes
PROCESS FOCUS
(LOW-VOLUME,
HIGH-VARIETY; e.g.,
ARNOLD PALMER
HOSPITAL)
REPETITIVE FOCUS
(MODULAR; e.g.,
HARLEY-DAVIDSON)
PRODUCT FOCUS
(HIGH-VOLUME,
LOW-VARIETY; e.g.,
FRITO-LAY)
MASS
CUSTOMIZATION
(HIGH-VOLUME, HIGH-
VARIETY; e.g.,
DELL COMPUTER)
1. Small quantity
and large variety of
products
1. Long runs, a
standardized product
from modules
1. Large quantity and
small variety of
products
1. Large quantity and
large variety of
products
2. Broadly skilled
operators
2. Moderately trained
employees
2. Less broadly
skilled operators
2. Flexible operators
Copyright © 2020 Pearson Education Ltd. All Rights Reserved.
Comparison of Processes (2 of 4)
Table 7.2 Comparison of the Characteristics of Four Types
of Processes
PROCESS FOCUS
(LOW-VOLUME,
HIGH-VARIETY; e.g.,
ARNOLD PALMER
HOSPITAL)
REPETITIVE FOCUS
(MODULAR; e.g.,
HARLEY-DAVIDSON)
PRODUCT FOCUS
(HIGH-VOLUME,
LOW-VARIETY; e.g.,
FRITO-LAY)
MASS
CUSTOMIZATION
(HIGH-VOLUME, HIGH-
VARIETY; e.g.,
DELL COMPUTER)
3. Instructions for
each job
3. Few changes in
the instructions
3. Standardized job
instructions
3. Custom orders
requiring many job
instructions
4. High inventory 4. Low inventory 4. Low inventory 4. Low inventory
relative to the value of
the product
Copyright © 2020 Pearson Education Ltd. All Rights Reserved.
Comparison of Processes (3 of 4)
Table 7.2 Comparison of the Characteristics of Four Types
of Processes
PROCESS FOCUS
(LOW-VOLUME,
HIGH-VARIETY; e.g.,
ARNOLD PALMER
HOSPITAL)
REPETITIVE FOCUS
(MODULAR; e.g.,
HARLEY-DAVIDSON)
PRODUCT FOCUS
(HIGH-VOLUME,
LOW-VARIETY; e.g.,
FRITO-LAY)
MASS
CUSTOMIZATION
(HIGH-VOLUME, HIGH-
VARIETY; e.g.,
DELL COMPUTER)
5. Finished goods
are made to order
and not stored
5. Finished goods
are made to frequent
forecasts
5. Finished goods
are made to a
forecast and stored
5. Finished goods are
build-to-order (BTO)
6. Scheduling is
complex
6. Scheduling is
routine
6. Scheduling is
routine
6. Sophisticated
scheduling
accommodates
custom orders
Copyright © 2020 Pearson Education Ltd. All Rights Reserved.
Comparison of Processes (4 of 4)
Table 7.2 Comparison of the Characteristics of Four Types
of Processes
PROCESS FOCUS
(LOW-VOLUME,
HIGH-VARIETY; e.g.,
ARNOLD PALMER
HOSPITAL)
REPETITIVE FOCUS
(MODULAR; e.g.,
HARLEY-DAVIDSON)
PRODUCT FOCUS
(HIGH-VOLUME,
LOW-VARIETY; e.g.,
FRITO-LAY)
MASS
CUSTOMIZATION
(HIGH-VOLUME, HIGH-
VARIETY; e.g.,
DELL COMPUTER)
7. Fixed costs are
low and variable
costs high
7. Fixed costs are
dependent on
flexibility of the
facility
7. Fixed costs are
high and variable
costs low
7. Fixed costs tend to
be high and variable
costs low
Copyright © 2020 Pearson Education Ltd. All Rights Reserved.
Crossover Chart Example (1 of 2)
•Evaluate three different accounting software products
•Calculate crossover points between software A and B and
between software B and C
Blank TOTAL FIXED COST
DOLLARS REQUIRED PER
ACCOUNTING REPORT
Software A $200,000 $60
Software B $300,000 $25
Software C $400,000 $10
Copyright © 2020 Pearson Education Ltd. All Rights Reserved.
Crossover Chart Example (2 of 2)
•Software A is most economical from 0 to 2,857 reports
•Software B is most economical from 2,857 to 6,666 reports
Copyright © 2020 Pearson Education Ltd. All Rights Reserved.
Crossover Charts
Figure 7.3
Copyright © 2020 Pearson Education Ltd. All Rights Reserved.
Focused Processes
•Focus brings efficiency
•Focus on depth of product line rather than breadth
•Focus can be
–Customers
–Products
–Service
–Technology
Copyright © 2020 Pearson Education Ltd. All Rights Reserved.
Selection of Equipment
•Decisions can be complex as alternate methods may be
available
•Important factors may be
–Cost
–Cash flow
–Market stability
–Quality
–Capacity
–Flexibility
Copyright © 2020 Pearson Education Ltd. All Rights Reserved.
Flexibility
•Flexibility is the ability to
respond with little penalty in
time, cost, or customer
value
•May be a competitive
advantage
•May be difficult and
expensive
•Without it, change may
mean starting over
Copyright © 2020 Pearson Education Ltd. All Rights Reserved.
Process Analysis and Design (1 of 3)
•Is the process designed to achieve a competitive
advantage?
•Does the process eliminate steps that do not add value?
•Does the process maximize customer value?
•Will the process win orders?
Copyright © 2020 Pearson Education Ltd. All Rights Reserved.
Process Analysis and Design (2 of 3)
•Flowchart
–Shows the movement of materials
–Harley-Davidson flowchart
•Time-Function Mapping
–Shows flows and time frame
Copyright © 2020 Pearson Education Ltd. All Rights Reserved.
“Baseline” Time-Function Map
Figure 7.4(a)
“Target” Time-Function Map
Figure 7.4(b)
Copyright © 2020 Pearson Education Ltd. All Rights Reserved.
Process Analysis and Design (3 of 3)
•Value-Stream Mapping (V SM)
–Where value is added in the entire production process,
including the supply chain
–Extends from the customer back to the suppliers
Copyright © 2020 Pearson Education Ltd. All Rights Reserved.
Value-Stream Mapping (1 of 3)
1. Begin with symbols for customer, supplier, and
production to ensure the big picture
2. Enter customer order requirements
3. Calculate the daily production requirements
4. Enter the outbound shipping requirements and delivery
frequency
5. Determine inbound shipping method and delivery
frequency
Copyright © 2020 Pearson Education Ltd. All Rights Reserved.
Value-Stream Mapping (2 of 3)
1. Add the process steps (i.e., machine, assemble) in
sequence, left to right
2. Add communication methods, add their frequency, and
show the direction with arrows
3. Add inventory quantities between every step of the
entire flow
4. Determine total working time (value-added time) and
delay (non-value-added time)
Copyright © 2020 Pearson Education Ltd. All Rights Reserved.
Value-Stream Mapping (3 of 3)
Figure 7.6
Copyright © 2020 Pearson Education Ltd. All Rights Reserved.
Service Blueprinting
•Focuses on the customer and provider interaction
•Defines three levels of interaction
•Each level has different management issues
•Identifies potential failure points
Copyright © 2020 Pearson Education Ltd. All Rights Reserved.
Service Blueprint (1 of 2)
Figure 7.7
Copyright © 2020 Pearson Education Ltd. All Rights Reserved.
Service Blueprint (2 of 2)
Figure 7.7
Copyright © 2020 Pearson Education Ltd. All Rights Reserved.
Special Considerations for Service
Process Strategies
•Some interaction with customer is necessary, but this often
affects performance adversely
•The better these interactions are accommodated in the
process design, the more efficient and effective the
process
•Find the right combination of cost and customer interaction
Copyright © 2020 Pearson Education Ltd. All Rights Reserved.
Service Process Matrix (1 of 3)
Figure 7.8
Copyright © 2020 Pearson Education Ltd. All Rights Reserved.
Service Process Matrix (2 of 3)
Mass Service and
Professional Service
•Labor involvement is high
•Focus on human resources
•Selection and training highly
important
•Personalized services
Copyright © 2020 Pearson Education Ltd. All Rights Reserved.
Service Process Matrix (3 of 3)
Service Factory and Service
Shop
•Automation of standardized
services
•Restricted offerings
•Low labor intensity responds
well to process technology
and scheduling
•Tight control required to
maintain standards
Copyright © 2020 Pearson Education Ltd. All Rights Reserved.
Improving Service Productivity (1 of 2)
Table 7.3 Techniques for Improving Service Productivity
STRATEGY TECHNIQUE EXAMPLE
Separation Structuring service so
customers must go where
the service is offered
Bank customers go to a
manager to open a new
account, to loan officers
for loans, and to tellers
for deposits
Self-service Self-service so customers
examine, compare, and
evaluate at their own
pace
Supermarkets and
department stores
Internet ordering
Postponement Customizing at delivery Customizing vans at
delivery rather than at
production
Focus Restricting the offerings Limited-menu restaurant
Copyright © 2020 Pearson Education Ltd. All Rights Reserved.
Improving Service Productivity (2 of 2)
Table 7.3 Techniques for Improving Service Productivity
STRATEGY TECHNIQUE EXAMPLE
Modules Modular selection of
service
Modular production
Investment and insurance
selection
Prepackaged food
modules in restaurants
Automation Separating services that
may lend themselves to
some type of automation
Automatic teller machines
Ordering via an app
Scheduling Precise personnel
scheduling
Scheduling airline ticket-
counter personnel at 15-
minute intervals
Training Clarifying the service
options
Explaining how to avoid
problems
Investment counselor,
funeral directors
After-sale maintenance
personnel
Copyright © 2020 Pearson Education Ltd. All Rights Reserved.
Production Technology
1. Machine technology
2. Automatic identification systems (AIS s)
3. Process control
4. Vision systems
5. Robots
6. Automated storage and retrieval systems (ASRSs)
7. Automated guided vehicles (AGVs)
8. Flexible manufacturing systems (F MSs)
9. Computer-integrated manufacturing (CIM)
Copyright © 2020 Pearson Education Ltd. All Rights Reserved.
Machine Technology
•Increased precision, productivity,
and flexibility
•Reduced environmental impact
•Additive manufacturing
produces products by adding
material, not removing it
•Supports innovative product
design, minimal custom tooling
required, minimal assembly time,
low inventory, and reduced time
to market
Computer numerical
control (C NC)
Copyright © 2020 Pearson Education Ltd. All Rights Reserved.
Automatic Identification Systems
(AI Ss) and RFID
•Improved data acquisition
•Reduced data entry errors
•Increased speed
•Increased scope of process
automation
Bar codes and R F I D
Copyright © 2020 Pearson Education Ltd. All Rights Reserved.
Value-Stream Mapping (1 of 3)
1. Begin with symbols for customer, supplier, and
production to ensure the big picture
2. Enter customer order requirements
3. Calculate the daily production requirements
4. Enter the outbound shipping requirements and delivery
frequency
5. Determine inbound shipping method and delivery
frequency
Copyright © 2020 Pearson Education Ltd. All Rights Reserved.
Value-Stream Mapping (2 of 3)
1. Add the process steps (i.e., machine, assemble) in
sequence, left to right
2. Add communication methods, add their frequency, and
show the direction with arrows
3. Add inventory quantities between every step of the
entire flow
4. Determine total working time (value-added time) and
delay (non-value-added time)
Copyright © 2020 Pearson Education Ltd. All Rights Reserved.
Value-Stream Mapping (3 of 3)
Figure 7.6
Copyright © 2020 Pearson Education Ltd. All Rights Reserved.
Service Blueprinting
•Focuses on the customer and provider interaction
•Defines three levels of interaction
•Each level has different management issues
•Identifies potential failure points
Copyright © 2020 Pearson Education Ltd. All Rights Reserved.
Service Blueprint (1 of 2)
Figure 7.7
Copyright © 2020 Pearson Education Ltd. All Rights Reserved.
Service Blueprint (2 of 2)
Figure 7.7
Copyright © 2020 Pearson Education Ltd. All Rights Reserved.
Special Considerations for Service
Process Strategies
•Some interaction with customer is necessary, but this often
affects performance adversely
•The better these interactions are accommodated in the
process design, the more efficient and effective the
process
•Find the right combination of cost and customer interaction
Copyright © 2020 Pearson Education Ltd. All Rights Reserved.
Service Process Matrix (1 of 3)
Figure 7.8
Copyright © 2020 Pearson Education Ltd. All Rights Reserved.
Service Process Matrix (2 of 3)
Mass Service and
Professional Service
•Labor involvement is high
•Focus on human resources
•Selection and training highly
important
•Personalized services
Copyright © 2020 Pearson Education Ltd. All Rights Reserved.
Service Process Matrix (3 of 3)
Service Factory and Service
Shop
•Automation of standardized
services
•Restricted offerings
•Low labor intensity responds
well to process technology
and scheduling
•Tight control required to
maintain standards
Copyright © 2020 Pearson Education Ltd. All Rights Reserved.
Improving Service Productivity (1 of 2)
Table 7.3 Techniques for Improving Service Productivity
STRATEGY TECHNIQUE EXAMPLE
Separation Structuring service so
customers must go where
the service is offered
Bank customers go to a
manager to open a new
account, to loan officers
for loans, and to tellers
for deposits
Self-service Self-service so customers
examine, compare, and
evaluate at their own
pace
Supermarkets and
department stores
Internet ordering
Postponement Customizing at delivery Customizing vans at
delivery rather than at
production
Focus Restricting the offerings Limited-menu restaurant
Copyright © 2020 Pearson Education Ltd. All Rights Reserved.
Improving Service Productivity (2 of 2)
Table 7.3 Techniques for Improving Service Productivity
STRATEGY TECHNIQUE EXAMPLE
Modules Modular selection of
service
Modular production
Investment and insurance
selection
Prepackaged food
modules in restaurants
Automation Separating services that
may lend themselves to
some type of automation
Automatic teller machines
Ordering via an app
Scheduling Precise personnel
scheduling
Scheduling airline ticket-
counter personnel at 15-
minute intervals
Training Clarifying the service
options
Explaining how to avoid
problems
Investment counselor,
funeral directors
After-sale maintenance
personnel
Copyright © 2020 Pearson Education Ltd. All Rights Reserved.
Production Technology
1. Machine technology
2. Automatic identification systems (AIS s)
3. Process control
4. Vision systems
5. Robots
6. Automated storage and retrieval systems (ASRSs)
7. Automated guided vehicles (AGVs)
8. Flexible manufacturing systems (F MSs)
9. Computer-integrated manufacturing (CIM)
Copyright © 2020 Pearson Education Ltd. All Rights Reserved.
Machine Technology
•Increased precision, productivity,
and flexibility
•Reduced environmental impact
•Additive manufacturing
produces products by adding
material, not removing it
•Supports innovative product
design, minimal custom tooling
required, minimal assembly time,
low inventory, and reduced time
to market
Computer numerical
control (C NC)
Copyright © 2020 Pearson Education Ltd. All Rights Reserved.
Automatic Identification Systems
(AI Ss) and RFID
•Improved data acquisition
•Reduced data entry errors
•Increased speed
•Increased scope of process
automation
Bar codes and R F I D
Process Chart
Figure 7.5
Copyright © 2020 Pearson Education Ltd. All Rights Reserved.
Value-Stream Mapping (2 of 3)
1. Add the process steps (i.e., machine, assemble) in
sequence, left to right
2. Add communication methods, add their frequency, and
show the direction with arrows
3. Add inventory quantities between every step of the
entire flow
4. Determine total working time (value-added time) and
delay (non-value-added time)
Copyright © 2020 Pearson Education Ltd. All Rights Reserved.
Value-Stream Mapping (3 of 3)
Figure 7.6
Copyright © 2020 Pearson Education Ltd. All Rights Reserved.
Service Blueprinting
•Focuses on the customer and provider interaction
•Defines three levels of interaction
•Each level has different management issues
•Identifies potential failure points
Copyright © 2020 Pearson Education Ltd. All Rights Reserved.
Service Blueprint (1 of 2)
Figure 7.7
Copyright © 2020 Pearson Education Ltd. All Rights Reserved.
Service Blueprint (2 of 2)
Figure 7.7
Copyright © 2020 Pearson Education Ltd. All Rights Reserved.
Special Considerations for Service
Process Strategies
•Some interaction with customer is necessary, but this often
affects performance adversely
•The better these interactions are accommodated in the
process design, the more efficient and effective the
process
•Find the right combination of cost and customer interaction
Copyright © 2020 Pearson Education Ltd. All Rights Reserved.
Service Process Matrix (1 of 3)
Figure 7.8
Copyright © 2020 Pearson Education Ltd. All Rights Reserved.
Service Process Matrix (2 of 3)
Mass Service and
Professional Service
•Labor involvement is high
•Focus on human resources
•Selection and training highly
important
•Personalized services
Copyright © 2020 Pearson Education Ltd. All Rights Reserved.
Service Process Matrix (3 of 3)
Service Factory and Service
Shop
•Automation of standardized
services
•Restricted offerings
•Low labor intensity responds
well to process technology
and scheduling
•Tight control required to
maintain standards
Copyright © 2020 Pearson Education Ltd. All Rights Reserved.
Improving Service Productivity (1 of 2)
Table 7.3 Techniques for Improving Service Productivity
STRATEGY TECHNIQUE EXAMPLE
Separation Structuring service so
customers must go where
the service is offered
Bank customers go to a
manager to open a new
account, to loan officers
for loans, and to tellers
for deposits
Self-service Self-service so customers
examine, compare, and
evaluate at their own
pace
Supermarkets and
department stores
Internet ordering
Postponement Customizing at delivery Customizing vans at
delivery rather than at
production
Focus Restricting the offerings Limited-menu restaurant
Copyright © 2020 Pearson Education Ltd. All Rights Reserved.
Improving Service Productivity (2 of 2)
Table 7.3 Techniques for Improving Service Productivity
STRATEGY TECHNIQUE EXAMPLE
Modules Modular selection of
service
Modular production
Investment and insurance
selection
Prepackaged food
modules in restaurants
Automation Separating services that
may lend themselves to
some type of automation
Automatic teller machines
Ordering via an app
Scheduling Precise personnel
scheduling
Scheduling airline ticket-
counter personnel at 15-
minute intervals
Training Clarifying the service
options
Explaining how to avoid
problems
Investment counselor,
funeral directors
After-sale maintenance
personnel
Copyright © 2020 Pearson Education Ltd. All Rights Reserved.
Production Technology
1. Machine technology
2. Automatic identification systems (AIS s)
3. Process control
4. Vision systems
5. Robots
6. Automated storage and retrieval systems (ASRSs)
7. Automated guided vehicles (AGVs)
8. Flexible manufacturing systems (F MSs)
9. Computer-integrated manufacturing (CIM)
Copyright © 2020 Pearson Education Ltd. All Rights Reserved.
Machine Technology
•Increased precision, productivity,
and flexibility
•Reduced environmental impact
•Additive manufacturing
produces products by adding
material, not removing it
•Supports innovative product
design, minimal custom tooling
required, minimal assembly time,
low inventory, and reduced time
to market
Computer numerical
control (C NC)
Copyright © 2020 Pearson Education Ltd. All Rights Reserved.
Automatic Identification Systems
(AI Ss) and RFID
•Improved data acquisition
•Reduced data entry errors
•Increased speed
•Increased scope of process
automation
Bar codes and R F I D
Copyright © 2020 Pearson Education Ltd. All Rights Reserved.
Process Chart
Figure 7.5
Process Analysis and Design (3 of 3)
•Value-Stream Mapping (V SM)
–Where value is added in the entire production process,
including the supply chain
–Extends from the customer back to the suppliers
Copyright © 2020 Pearson Education Ltd. All Rights Reserved.
Value-Stream Mapping (3 of 3)
Figure 7.6
Copyright © 2020 Pearson Education Ltd. All Rights Reserved.
Service Blueprinting
•Focuses on the customer and provider interaction
•Defines three levels of interaction
•Each level has different management issues
•Identifies potential failure points
Copyright © 2020 Pearson Education Ltd. All Rights Reserved.
Service Blueprint (1 of 2)
Figure 7.7
Copyright © 2020 Pearson Education Ltd. All Rights Reserved.
Service Blueprint (2 of 2)
Figure 7.7
Copyright © 2020 Pearson Education Ltd. All Rights Reserved.
Special Considerations for Service
Process Strategies
•Some interaction with customer is necessary, but this often
affects performance adversely
•The better these interactions are accommodated in the
process design, the more efficient and effective the
process
•Find the right combination of cost and customer interaction
Copyright © 2020 Pearson Education Ltd. All Rights Reserved.
Service Process Matrix (1 of 3)
Figure 7.8
Copyright © 2020 Pearson Education Ltd. All Rights Reserved.
Service Process Matrix (2 of 3)
Mass Service and
Professional Service
•Labor involvement is high
•Focus on human resources
•Selection and training highly
important
•Personalized services
Copyright © 2020 Pearson Education Ltd. All Rights Reserved.
Service Process Matrix (3 of 3)
Service Factory and Service
Shop
•Automation of standardized
services
•Restricted offerings
•Low labor intensity responds
well to process technology
and scheduling
•Tight control required to
maintain standards
Copyright © 2020 Pearson Education Ltd. All Rights Reserved.
Improving Service Productivity (1 of 2)
Table 7.3 Techniques for Improving Service Productivity
STRATEGY TECHNIQUE EXAMPLE
Separation Structuring service so
customers must go where
the service is offered
Bank customers go to a
manager to open a new
account, to loan officers
for loans, and to tellers
for deposits
Self-service Self-service so customers
examine, compare, and
evaluate at their own
pace
Supermarkets and
department stores
Internet ordering
Postponement Customizing at delivery Customizing vans at
delivery rather than at
production
Focus Restricting the offerings Limited-menu restaurant
Copyright © 2020 Pearson Education Ltd. All Rights Reserved.
Improving Service Productivity (2 of 2)
Table 7.3 Techniques for Improving Service Productivity
STRATEGY TECHNIQUE EXAMPLE
Modules Modular selection of
service
Modular production
Investment and insurance
selection
Prepackaged food
modules in restaurants
Automation Separating services that
may lend themselves to
some type of automation
Automatic teller machines
Ordering via an app
Scheduling Precise personnel
scheduling
Scheduling airline ticket-
counter personnel at 15-
minute intervals
Training Clarifying the service
options
Explaining how to avoid
problems
Investment counselor,
funeral directors
After-sale maintenance
personnel
Copyright © 2020 Pearson Education Ltd. All Rights Reserved.
Production Technology
1. Machine technology
2. Automatic identification systems (AIS s)
3. Process control
4. Vision systems
5. Robots
6. Automated storage and retrieval systems (ASRSs)
7. Automated guided vehicles (AGVs)
8. Flexible manufacturing systems (F MSs)
9. Computer-integrated manufacturing (CIM)
Copyright © 2020 Pearson Education Ltd. All Rights Reserved.
Machine Technology
•Increased precision, productivity,
and flexibility
•Reduced environmental impact
•Additive manufacturing
produces products by adding
material, not removing it
•Supports innovative product
design, minimal custom tooling
required, minimal assembly time,
low inventory, and reduced time
to market
Computer numerical
control (C NC)
Copyright © 2020 Pearson Education Ltd. All Rights Reserved.
Automatic Identification Systems
(AI Ss) and RFID
•Improved data acquisition
•Reduced data entry errors
•Increased speed
•Increased scope of process
automation
Bar codes and R F I D
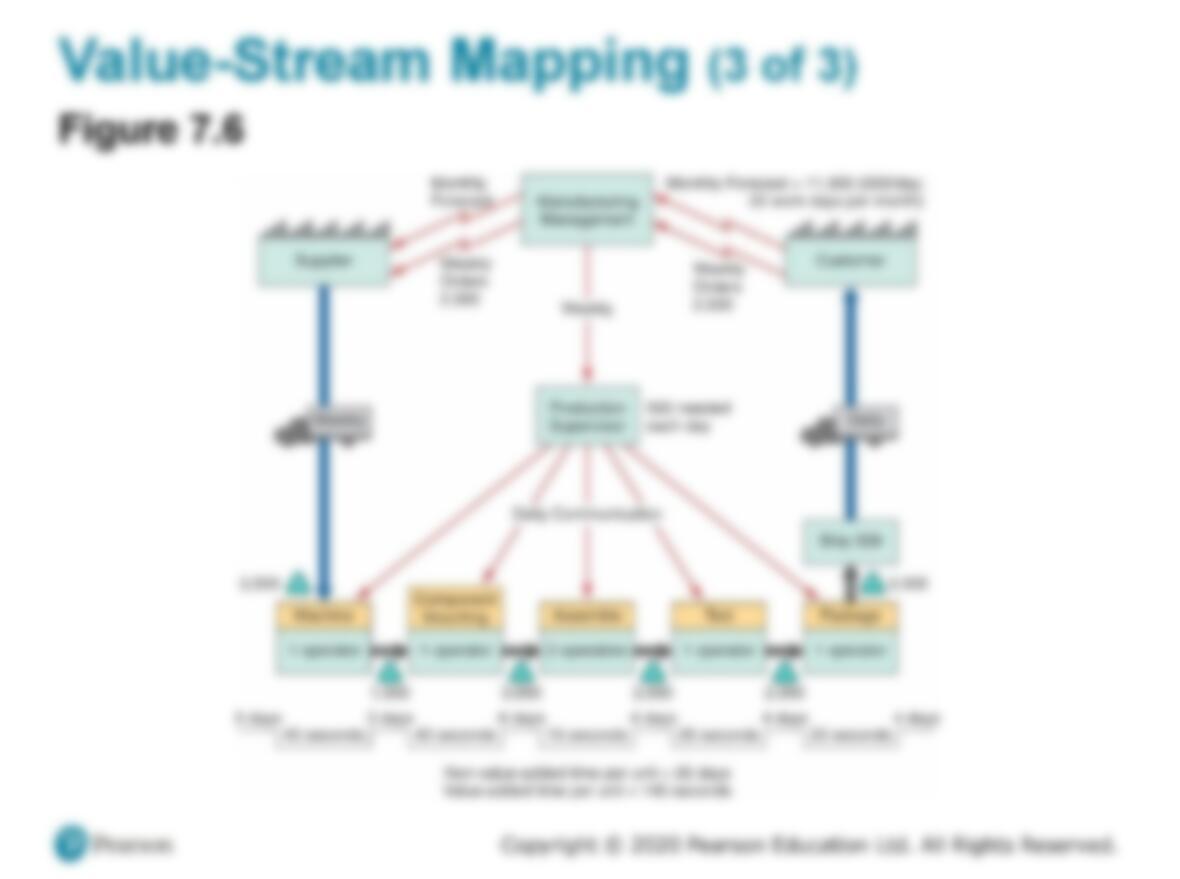
Copyright © 2020 Pearson Education Ltd. All Rights Reserved.
Process Chart
Figure 7.5
Copyright © 2020 Pearson Education Ltd. All Rights Reserved.
Process Analysis and Design (3 of 3)
•Value-Stream Mapping (V SM)
–Where value is added in the entire production process,
including the supply chain
–Extends from the customer back to the suppliers
Value-Stream Mapping (1 of 3)
1. Begin with symbols for customer, supplier, and
production to ensure the big picture
2. Enter customer order requirements
3. Calculate the daily production requirements
4. Enter the outbound shipping requirements and delivery
frequency
5. Determine inbound shipping method and delivery
frequency
Copyright © 2020 Pearson Education Ltd. All Rights Reserved.
Service Blueprinting
•Focuses on the customer and provider interaction
•Defines three levels of interaction
•Each level has different management issues
•Identifies potential failure points
Copyright © 2020 Pearson Education Ltd. All Rights Reserved.
Service Blueprint (1 of 2)
Figure 7.7
Copyright © 2020 Pearson Education Ltd. All Rights Reserved.
Service Blueprint (2 of 2)
Figure 7.7
Copyright © 2020 Pearson Education Ltd. All Rights Reserved.
Special Considerations for Service
Process Strategies
•Some interaction with customer is necessary, but this often
affects performance adversely
•The better these interactions are accommodated in the
process design, the more efficient and effective the
process
•Find the right combination of cost and customer interaction
Copyright © 2020 Pearson Education Ltd. All Rights Reserved.
Service Process Matrix (1 of 3)
Figure 7.8
Copyright © 2020 Pearson Education Ltd. All Rights Reserved.
Service Process Matrix (2 of 3)
Mass Service and
Professional Service
•Labor involvement is high
•Focus on human resources
•Selection and training highly
important
•Personalized services
Copyright © 2020 Pearson Education Ltd. All Rights Reserved.
Service Process Matrix (3 of 3)
Service Factory and Service
Shop
•Automation of standardized
services
•Restricted offerings
•Low labor intensity responds
well to process technology
and scheduling
•Tight control required to
maintain standards
Copyright © 2020 Pearson Education Ltd. All Rights Reserved.
Improving Service Productivity (1 of 2)
Table 7.3 Techniques for Improving Service Productivity
STRATEGY TECHNIQUE EXAMPLE
Separation Structuring service so
customers must go where
the service is offered
Bank customers go to a
manager to open a new
account, to loan officers
for loans, and to tellers
for deposits
Self-service Self-service so customers
examine, compare, and
evaluate at their own
pace
Supermarkets and
department stores
Internet ordering
Postponement Customizing at delivery Customizing vans at
delivery rather than at
production
Focus Restricting the offerings Limited-menu restaurant
Copyright © 2020 Pearson Education Ltd. All Rights Reserved.
Improving Service Productivity (2 of 2)
Table 7.3 Techniques for Improving Service Productivity
STRATEGY TECHNIQUE EXAMPLE
Modules Modular selection of
service
Modular production
Investment and insurance
selection
Prepackaged food
modules in restaurants
Automation Separating services that
may lend themselves to
some type of automation
Automatic teller machines
Ordering via an app
Scheduling Precise personnel
scheduling
Scheduling airline ticket-
counter personnel at 15-
minute intervals
Training Clarifying the service
options
Explaining how to avoid
problems
Investment counselor,
funeral directors
After-sale maintenance
personnel
Copyright © 2020 Pearson Education Ltd. All Rights Reserved.
Production Technology
1. Machine technology
2. Automatic identification systems (AIS s)
3. Process control
4. Vision systems
5. Robots
6. Automated storage and retrieval systems (ASRSs)
7. Automated guided vehicles (AGVs)
8. Flexible manufacturing systems (F MSs)
9. Computer-integrated manufacturing (CIM)
Copyright © 2020 Pearson Education Ltd. All Rights Reserved.
Machine Technology
•Increased precision, productivity,
and flexibility
•Reduced environmental impact
•Additive manufacturing
produces products by adding
material, not removing it
•Supports innovative product
design, minimal custom tooling
required, minimal assembly time,
low inventory, and reduced time
to market
Computer numerical
control (C NC)
Copyright © 2020 Pearson Education Ltd. All Rights Reserved.
Automatic Identification Systems
(AI Ss) and RFID
•Improved data acquisition
•Reduced data entry errors
•Increased speed
•Increased scope of process
automation
Bar codes and R F I D
Copyright © 2020 Pearson Education Ltd. All Rights Reserved.
Process Chart
Figure 7.5
Copyright © 2020 Pearson Education Ltd. All Rights Reserved.
Process Analysis and Design (3 of 3)
•Value-Stream Mapping (V SM)
–Where value is added in the entire production process,
including the supply chain
–Extends from the customer back to the suppliers
Copyright © 2020 Pearson Education Ltd. All Rights Reserved.
Value-Stream Mapping (1 of 3)
1. Begin with symbols for customer, supplier, and
production to ensure the big picture
2. Enter customer order requirements
3. Calculate the daily production requirements
4. Enter the outbound shipping requirements and delivery
frequency
5. Determine inbound shipping method and delivery
frequency
Value-Stream Mapping (2 of 3)
1. Add the process steps (i.e., machine, assemble) in
sequence, left to right
2. Add communication methods, add their frequency, and
show the direction with arrows
3. Add inventory quantities between every step of the
entire flow
4. Determine total working time (value-added time) and
delay (non-value-added time)
Copyright © 2020 Pearson Education Ltd. All Rights Reserved.
Service Blueprint (1 of 2)
Figure 7.7
Copyright © 2020 Pearson Education Ltd. All Rights Reserved.
Service Blueprint (2 of 2)
Figure 7.7
Copyright © 2020 Pearson Education Ltd. All Rights Reserved.
Special Considerations for Service
Process Strategies
•Some interaction with customer is necessary, but this often
affects performance adversely
•The better these interactions are accommodated in the
process design, the more efficient and effective the
process
•Find the right combination of cost and customer interaction
Copyright © 2020 Pearson Education Ltd. All Rights Reserved.
Service Process Matrix (1 of 3)
Figure 7.8
Copyright © 2020 Pearson Education Ltd. All Rights Reserved.
Service Process Matrix (2 of 3)
Mass Service and
Professional Service
•Labor involvement is high
•Focus on human resources
•Selection and training highly
important
•Personalized services
Copyright © 2020 Pearson Education Ltd. All Rights Reserved.
Service Process Matrix (3 of 3)
Service Factory and Service
Shop
•Automation of standardized
services
•Restricted offerings
•Low labor intensity responds
well to process technology
and scheduling
•Tight control required to
maintain standards
Copyright © 2020 Pearson Education Ltd. All Rights Reserved.
Improving Service Productivity (1 of 2)
Table 7.3 Techniques for Improving Service Productivity
STRATEGY TECHNIQUE EXAMPLE
Separation Structuring service so
customers must go where
the service is offered
Bank customers go to a
manager to open a new
account, to loan officers
for loans, and to tellers
for deposits
Self-service Self-service so customers
examine, compare, and
evaluate at their own
pace
Supermarkets and
department stores
Internet ordering
Postponement Customizing at delivery Customizing vans at
delivery rather than at
production
Focus Restricting the offerings Limited-menu restaurant
Copyright © 2020 Pearson Education Ltd. All Rights Reserved.
Improving Service Productivity (2 of 2)
Table 7.3 Techniques for Improving Service Productivity
STRATEGY TECHNIQUE EXAMPLE
Modules Modular selection of
service
Modular production
Investment and insurance
selection
Prepackaged food
modules in restaurants
Automation Separating services that
may lend themselves to
some type of automation
Automatic teller machines
Ordering via an app
Scheduling Precise personnel
scheduling
Scheduling airline ticket-
counter personnel at 15-
minute intervals
Training Clarifying the service
options
Explaining how to avoid
problems
Investment counselor,
funeral directors
After-sale maintenance
personnel
Copyright © 2020 Pearson Education Ltd. All Rights Reserved.
Production Technology
1. Machine technology
2. Automatic identification systems (AIS s)
3. Process control
4. Vision systems
5. Robots
6. Automated storage and retrieval systems (ASRSs)
7. Automated guided vehicles (AGVs)
8. Flexible manufacturing systems (F MSs)
9. Computer-integrated manufacturing (CIM)
Copyright © 2020 Pearson Education Ltd. All Rights Reserved.
Machine Technology
•Increased precision, productivity,
and flexibility
•Reduced environmental impact
•Additive manufacturing
produces products by adding
material, not removing it
•Supports innovative product
design, minimal custom tooling
required, minimal assembly time,
low inventory, and reduced time
to market
Computer numerical
control (C NC)
Copyright © 2020 Pearson Education Ltd. All Rights Reserved.
Automatic Identification Systems
(AI Ss) and RFID
•Improved data acquisition
•Reduced data entry errors
•Increased speed
•Increased scope of process
automation
Bar codes and R F I D
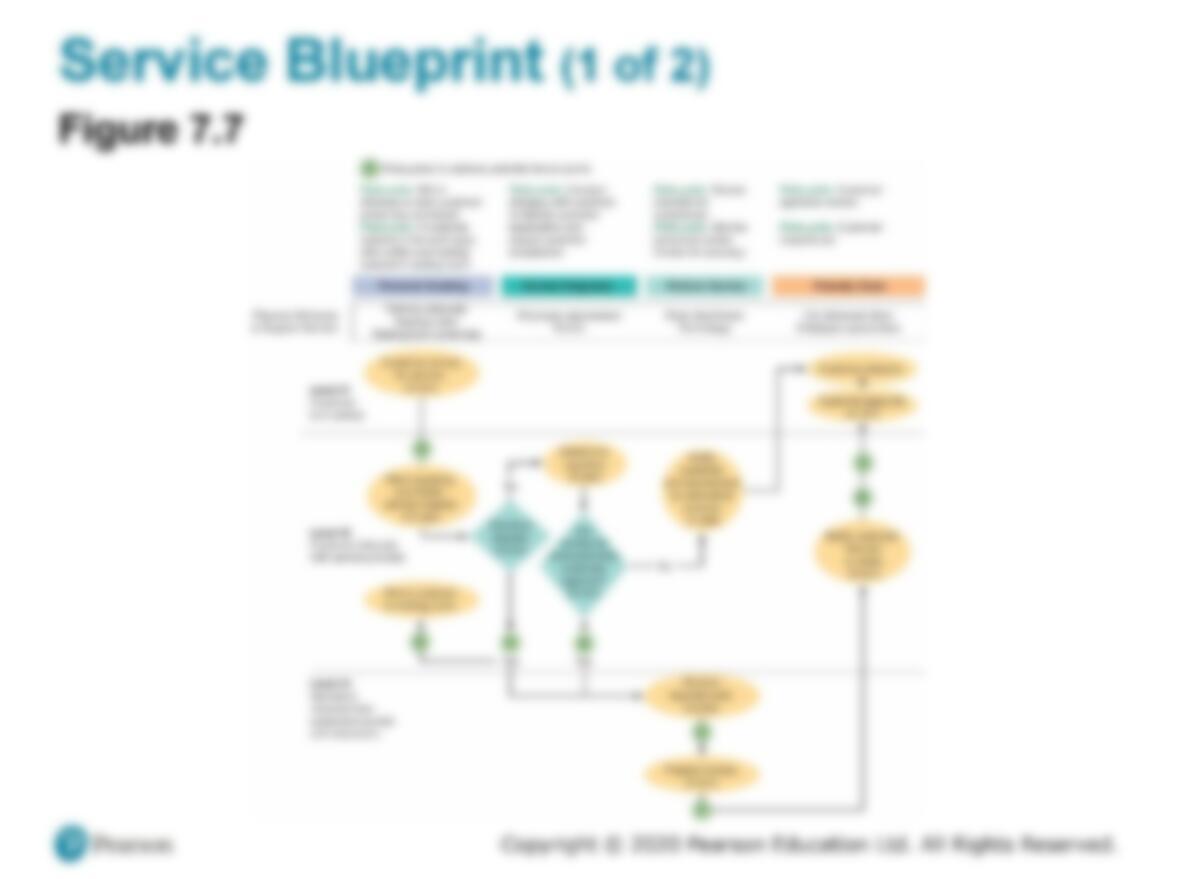
Copyright © 2020 Pearson Education Ltd. All Rights Reserved.
Process Chart
Figure 7.5
Copyright © 2020 Pearson Education Ltd. All Rights Reserved.
Process Analysis and Design (3 of 3)
•Value-Stream Mapping (V SM)
–Where value is added in the entire production process,
including the supply chain
–Extends from the customer back to the suppliers
Copyright © 2020 Pearson Education Ltd. All Rights Reserved.
Value-Stream Mapping (1 of 3)
1. Begin with symbols for customer, supplier, and
production to ensure the big picture
2. Enter customer order requirements
3. Calculate the daily production requirements
4. Enter the outbound shipping requirements and delivery
frequency
5. Determine inbound shipping method and delivery
frequency
Copyright © 2020 Pearson Education Ltd. All Rights Reserved.
Value-Stream Mapping (2 of 3)
1. Add the process steps (i.e., machine, assemble) in
sequence, left to right
2. Add communication methods, add their frequency, and
show the direction with arrows
3. Add inventory quantities between every step of the
entire flow
4. Determine total working time (value-added time) and
delay (non-value-added time)
Value-Stream Mapping (3 of 3)
Figure 7.6
Copyright © 2020 Pearson Education Ltd. All Rights Reserved.
Service Blueprint (2 of 2)
Figure 7.7
Copyright © 2020 Pearson Education Ltd. All Rights Reserved.
Special Considerations for Service
Process Strategies
•Some interaction with customer is necessary, but this often
affects performance adversely
•The better these interactions are accommodated in the
process design, the more efficient and effective the
process
•Find the right combination of cost and customer interaction
Copyright © 2020 Pearson Education Ltd. All Rights Reserved.
Service Process Matrix (1 of 3)
Figure 7.8
Copyright © 2020 Pearson Education Ltd. All Rights Reserved.
Service Process Matrix (2 of 3)
Mass Service and
Professional Service
•Labor involvement is high
•Focus on human resources
•Selection and training highly
important
•Personalized services
Copyright © 2020 Pearson Education Ltd. All Rights Reserved.
Service Process Matrix (3 of 3)
Service Factory and Service
Shop
•Automation of standardized
services
•Restricted offerings
•Low labor intensity responds
well to process technology
and scheduling
•Tight control required to
maintain standards
Copyright © 2020 Pearson Education Ltd. All Rights Reserved.
Improving Service Productivity (1 of 2)
Table 7.3 Techniques for Improving Service Productivity
STRATEGY TECHNIQUE EXAMPLE
Separation Structuring service so
customers must go where
the service is offered
Bank customers go to a
manager to open a new
account, to loan officers
for loans, and to tellers
for deposits
Self-service Self-service so customers
examine, compare, and
evaluate at their own
pace
Supermarkets and
department stores
Internet ordering
Postponement Customizing at delivery Customizing vans at
delivery rather than at
production
Focus Restricting the offerings Limited-menu restaurant
Copyright © 2020 Pearson Education Ltd. All Rights Reserved.
Improving Service Productivity (2 of 2)
Table 7.3 Techniques for Improving Service Productivity
STRATEGY TECHNIQUE EXAMPLE
Modules Modular selection of
service
Modular production
Investment and insurance
selection
Prepackaged food
modules in restaurants
Automation Separating services that
may lend themselves to
some type of automation
Automatic teller machines
Ordering via an app
Scheduling Precise personnel
scheduling
Scheduling airline ticket-
counter personnel at 15-
minute intervals
Training Clarifying the service
options
Explaining how to avoid
problems
Investment counselor,
funeral directors
After-sale maintenance
personnel
Copyright © 2020 Pearson Education Ltd. All Rights Reserved.
Production Technology
1. Machine technology
2. Automatic identification systems (AIS s)
3. Process control
4. Vision systems
5. Robots
6. Automated storage and retrieval systems (ASRSs)
7. Automated guided vehicles (AGVs)
8. Flexible manufacturing systems (F MSs)
9. Computer-integrated manufacturing (CIM)
Copyright © 2020 Pearson Education Ltd. All Rights Reserved.
Machine Technology
•Increased precision, productivity,
and flexibility
•Reduced environmental impact
•Additive manufacturing
produces products by adding
material, not removing it
•Supports innovative product
design, minimal custom tooling
required, minimal assembly time,
low inventory, and reduced time
to market
Computer numerical
control (C NC)
Copyright © 2020 Pearson Education Ltd. All Rights Reserved.
Automatic Identification Systems
(AI Ss) and RFID
•Improved data acquisition
•Reduced data entry errors
•Increased speed
•Increased scope of process
automation
Bar codes and R F I D
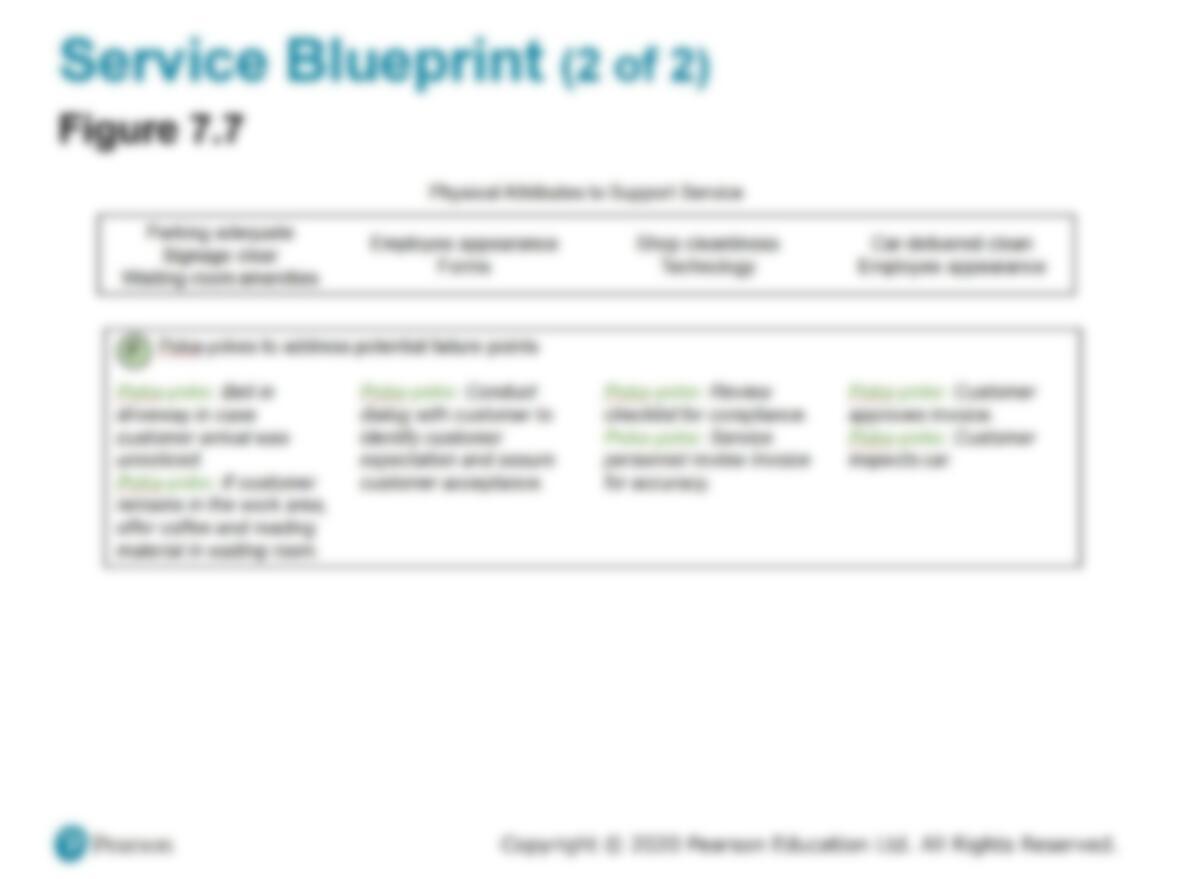
Copyright © 2020 Pearson Education Ltd. All Rights Reserved.
Process Chart
Figure 7.5
Copyright © 2020 Pearson Education Ltd. All Rights Reserved.
Process Analysis and Design (3 of 3)
•Value-Stream Mapping (V SM)
–Where value is added in the entire production process,
including the supply chain
–Extends from the customer back to the suppliers
Copyright © 2020 Pearson Education Ltd. All Rights Reserved.
Value-Stream Mapping (1 of 3)
1. Begin with symbols for customer, supplier, and
production to ensure the big picture
2. Enter customer order requirements
3. Calculate the daily production requirements
4. Enter the outbound shipping requirements and delivery
frequency
5. Determine inbound shipping method and delivery
frequency
Copyright © 2020 Pearson Education Ltd. All Rights Reserved.
Value-Stream Mapping (2 of 3)
1. Add the process steps (i.e., machine, assemble) in
sequence, left to right
2. Add communication methods, add their frequency, and
show the direction with arrows
3. Add inventory quantities between every step of the
entire flow
4. Determine total working time (value-added time) and
delay (non-value-added time)
Copyright © 2020 Pearson Education Ltd. All Rights Reserved.
Value-Stream Mapping (3 of 3)
Figure 7.6
Service Blueprinting
•Focuses on the customer and provider interaction
•Defines three levels of interaction
•Each level has different management issues
•Identifies potential failure points
Copyright © 2020 Pearson Education Ltd. All Rights Reserved.
Special Considerations for Service
Process Strategies
•Some interaction with customer is necessary, but this often
affects performance adversely
•The better these interactions are accommodated in the
process design, the more efficient and effective the
process
•Find the right combination of cost and customer interaction
Copyright © 2020 Pearson Education Ltd. All Rights Reserved.
Service Process Matrix (1 of 3)
Figure 7.8
Copyright © 2020 Pearson Education Ltd. All Rights Reserved.
Service Process Matrix (2 of 3)
Mass Service and
Professional Service
•Labor involvement is high
•Focus on human resources
•Selection and training highly
important
•Personalized services
Copyright © 2020 Pearson Education Ltd. All Rights Reserved.
Service Process Matrix (3 of 3)
Service Factory and Service
Shop
•Automation of standardized
services
•Restricted offerings
•Low labor intensity responds
well to process technology
and scheduling
•Tight control required to
maintain standards
Copyright © 2020 Pearson Education Ltd. All Rights Reserved.
Improving Service Productivity (1 of 2)
Table 7.3 Techniques for Improving Service Productivity
STRATEGY TECHNIQUE EXAMPLE
Separation Structuring service so
customers must go where
the service is offered
Bank customers go to a
manager to open a new
account, to loan officers
for loans, and to tellers
for deposits
Self-service Self-service so customers
examine, compare, and
evaluate at their own
pace
Supermarkets and
department stores
Internet ordering
Postponement Customizing at delivery Customizing vans at
delivery rather than at
production
Focus Restricting the offerings Limited-menu restaurant
Copyright © 2020 Pearson Education Ltd. All Rights Reserved.
Improving Service Productivity (2 of 2)
Table 7.3 Techniques for Improving Service Productivity
STRATEGY TECHNIQUE EXAMPLE
Modules Modular selection of
service
Modular production
Investment and insurance
selection
Prepackaged food
modules in restaurants
Automation Separating services that
may lend themselves to
some type of automation
Automatic teller machines
Ordering via an app
Scheduling Precise personnel
scheduling
Scheduling airline ticket-
counter personnel at 15-
minute intervals
Training Clarifying the service
options
Explaining how to avoid
problems
Investment counselor,
funeral directors
After-sale maintenance
personnel
Copyright © 2020 Pearson Education Ltd. All Rights Reserved.
Production Technology
1. Machine technology
2. Automatic identification systems (AIS s)
3. Process control
4. Vision systems
5. Robots
6. Automated storage and retrieval systems (ASRSs)
7. Automated guided vehicles (AGVs)
8. Flexible manufacturing systems (F MSs)
9. Computer-integrated manufacturing (CIM)
Copyright © 2020 Pearson Education Ltd. All Rights Reserved.
Machine Technology
•Increased precision, productivity,
and flexibility
•Reduced environmental impact
•Additive manufacturing
produces products by adding
material, not removing it
•Supports innovative product
design, minimal custom tooling
required, minimal assembly time,
low inventory, and reduced time
to market
Computer numerical
control (C NC)
Copyright © 2020 Pearson Education Ltd. All Rights Reserved.
Automatic Identification Systems
(AI Ss) and RFID
•Improved data acquisition
•Reduced data entry errors
•Increased speed
•Increased scope of process
automation
Bar codes and R F I D
Copyright © 2020 Pearson Education Ltd. All Rights Reserved.
Process Chart
Figure 7.5
Copyright © 2020 Pearson Education Ltd. All Rights Reserved.
Process Analysis and Design (3 of 3)
•Value-Stream Mapping (V SM)
–Where value is added in the entire production process,
including the supply chain
–Extends from the customer back to the suppliers
Copyright © 2020 Pearson Education Ltd. All Rights Reserved.
Value-Stream Mapping (1 of 3)
1. Begin with symbols for customer, supplier, and
production to ensure the big picture
2. Enter customer order requirements
3. Calculate the daily production requirements
4. Enter the outbound shipping requirements and delivery
frequency
5. Determine inbound shipping method and delivery
frequency
Copyright © 2020 Pearson Education Ltd. All Rights Reserved.
Value-Stream Mapping (2 of 3)
1. Add the process steps (i.e., machine, assemble) in
sequence, left to right
2. Add communication methods, add their frequency, and
show the direction with arrows
3. Add inventory quantities between every step of the
entire flow
4. Determine total working time (value-added time) and
delay (non-value-added time)
Copyright © 2020 Pearson Education Ltd. All Rights Reserved.
Value-Stream Mapping (3 of 3)
Figure 7.6
Copyright © 2020 Pearson Education Ltd. All Rights Reserved.
Service Blueprinting
•Focuses on the customer and provider interaction
•Defines three levels of interaction
•Each level has different management issues
•Identifies potential failure points
Service Blueprint (1 of 2)
Figure 7.7
Copyright © 2020 Pearson Education Ltd. All Rights Reserved.
Service Process Matrix (1 of 3)
Figure 7.8
Copyright © 2020 Pearson Education Ltd. All Rights Reserved.
Service Process Matrix (2 of 3)
Mass Service and
Professional Service
•Labor involvement is high
•Focus on human resources
•Selection and training highly
important
•Personalized services
Copyright © 2020 Pearson Education Ltd. All Rights Reserved.
Service Process Matrix (3 of 3)
Service Factory and Service
Shop
•Automation of standardized
services
•Restricted offerings
•Low labor intensity responds
well to process technology
and scheduling
•Tight control required to
maintain standards
Copyright © 2020 Pearson Education Ltd. All Rights Reserved.
Improving Service Productivity (1 of 2)
Table 7.3 Techniques for Improving Service Productivity
STRATEGY TECHNIQUE EXAMPLE
Separation Structuring service so
customers must go where
the service is offered
Bank customers go to a
manager to open a new
account, to loan officers
for loans, and to tellers
for deposits
Self-service Self-service so customers
examine, compare, and
evaluate at their own
pace
Supermarkets and
department stores
Internet ordering
Postponement Customizing at delivery Customizing vans at
delivery rather than at
production
Focus Restricting the offerings Limited-menu restaurant
Copyright © 2020 Pearson Education Ltd. All Rights Reserved.
Improving Service Productivity (2 of 2)
Table 7.3 Techniques for Improving Service Productivity
STRATEGY TECHNIQUE EXAMPLE
Modules Modular selection of
service
Modular production
Investment and insurance
selection
Prepackaged food
modules in restaurants
Automation Separating services that
may lend themselves to
some type of automation
Automatic teller machines
Ordering via an app
Scheduling Precise personnel
scheduling
Scheduling airline ticket-
counter personnel at 15-
minute intervals
Training Clarifying the service
options
Explaining how to avoid
problems
Investment counselor,
funeral directors
After-sale maintenance
personnel
Copyright © 2020 Pearson Education Ltd. All Rights Reserved.
Production Technology
1. Machine technology
2. Automatic identification systems (AIS s)
3. Process control
4. Vision systems
5. Robots
6. Automated storage and retrieval systems (ASRSs)
7. Automated guided vehicles (AGVs)
8. Flexible manufacturing systems (F MSs)
9. Computer-integrated manufacturing (CIM)
Copyright © 2020 Pearson Education Ltd. All Rights Reserved.
Machine Technology
•Increased precision, productivity,
and flexibility
•Reduced environmental impact
•Additive manufacturing
produces products by adding
material, not removing it
•Supports innovative product
design, minimal custom tooling
required, minimal assembly time,
low inventory, and reduced time
to market
Computer numerical
control (C NC)
Copyright © 2020 Pearson Education Ltd. All Rights Reserved.
Automatic Identification Systems
(AI Ss) and RFID
•Improved data acquisition
•Reduced data entry errors
•Increased speed
•Increased scope of process
automation
Bar codes and R F I D
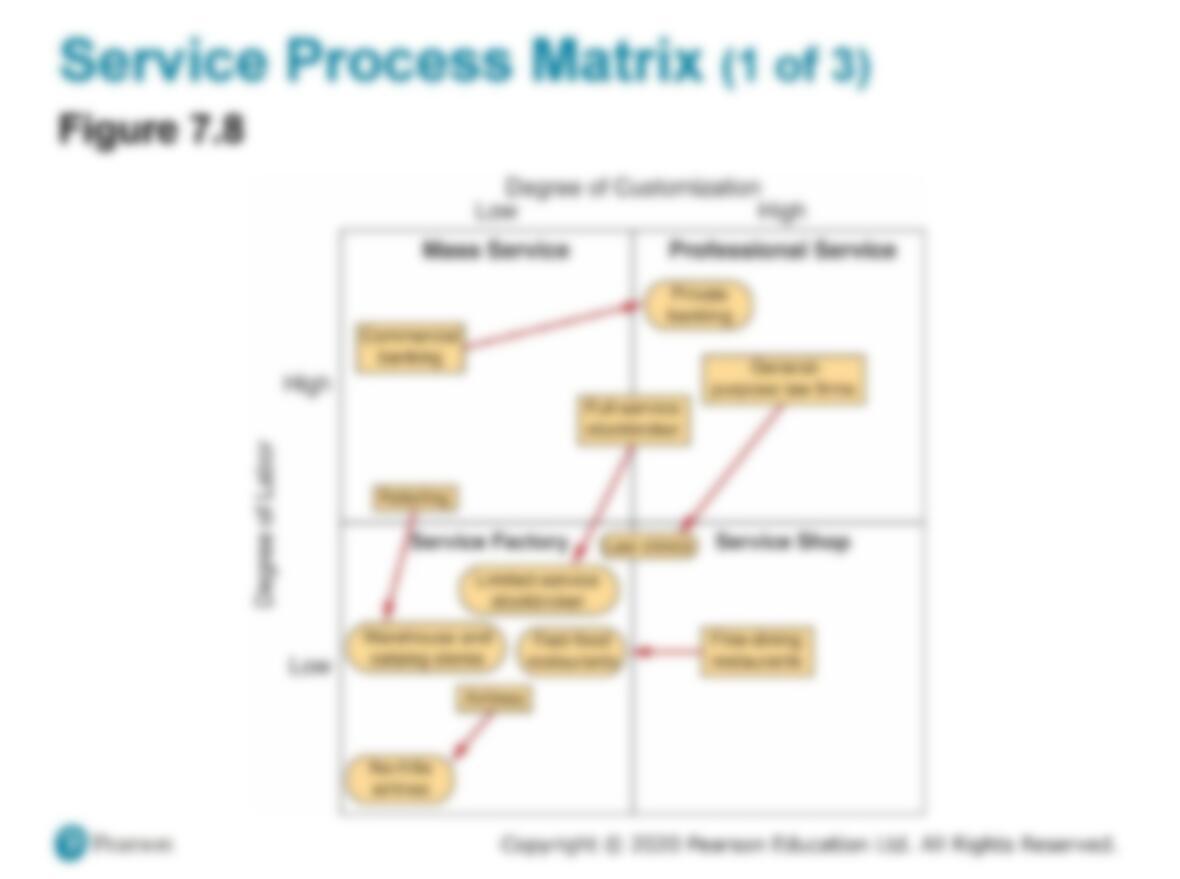
Copyright © 2020 Pearson Education Ltd. All Rights Reserved.
Process Chart
Figure 7.5
Copyright © 2020 Pearson Education Ltd. All Rights Reserved.
Process Analysis and Design (3 of 3)
•Value-Stream Mapping (V SM)
–Where value is added in the entire production process,
including the supply chain
–Extends from the customer back to the suppliers
Copyright © 2020 Pearson Education Ltd. All Rights Reserved.
Value-Stream Mapping (1 of 3)
1. Begin with symbols for customer, supplier, and
production to ensure the big picture
2. Enter customer order requirements
3. Calculate the daily production requirements
4. Enter the outbound shipping requirements and delivery
frequency
5. Determine inbound shipping method and delivery
frequency
Copyright © 2020 Pearson Education Ltd. All Rights Reserved.
Value-Stream Mapping (2 of 3)
1. Add the process steps (i.e., machine, assemble) in
sequence, left to right
2. Add communication methods, add their frequency, and
show the direction with arrows
3. Add inventory quantities between every step of the
entire flow
4. Determine total working time (value-added time) and
delay (non-value-added time)
Copyright © 2020 Pearson Education Ltd. All Rights Reserved.
Value-Stream Mapping (3 of 3)
Figure 7.6
Copyright © 2020 Pearson Education Ltd. All Rights Reserved.
Service Blueprinting
•Focuses on the customer and provider interaction
•Defines three levels of interaction
•Each level has different management issues
•Identifies potential failure points
Copyright © 2020 Pearson Education Ltd. All Rights Reserved.
Service Blueprint (1 of 2)
Figure 7.7
Service Blueprint (2 of 2)
Figure 7.7
Copyright © 2020 Pearson Education Ltd. All Rights Reserved.
Service Process Matrix (2 of 3)
Mass Service and
Professional Service
•Labor involvement is high
•Focus on human resources
•Selection and training highly
important
•Personalized services
Copyright © 2020 Pearson Education Ltd. All Rights Reserved.
Service Process Matrix (3 of 3)
Service Factory and Service
Shop
•Automation of standardized
services
•Restricted offerings
•Low labor intensity responds
well to process technology
and scheduling
•Tight control required to
maintain standards
Copyright © 2020 Pearson Education Ltd. All Rights Reserved.
Improving Service Productivity (1 of 2)
Table 7.3 Techniques for Improving Service Productivity
STRATEGY TECHNIQUE EXAMPLE
Separation Structuring service so
customers must go where
the service is offered
Bank customers go to a
manager to open a new
account, to loan officers
for loans, and to tellers
for deposits
Self-service Self-service so customers
examine, compare, and
evaluate at their own
pace
Supermarkets and
department stores
Internet ordering
Postponement Customizing at delivery Customizing vans at
delivery rather than at
production
Focus Restricting the offerings Limited-menu restaurant
Copyright © 2020 Pearson Education Ltd. All Rights Reserved.
Improving Service Productivity (2 of 2)
Table 7.3 Techniques for Improving Service Productivity
STRATEGY TECHNIQUE EXAMPLE
Modules Modular selection of
service
Modular production
Investment and insurance
selection
Prepackaged food
modules in restaurants
Automation Separating services that
may lend themselves to
some type of automation
Automatic teller machines
Ordering via an app
Scheduling Precise personnel
scheduling
Scheduling airline ticket-
counter personnel at 15-
minute intervals
Training Clarifying the service
options
Explaining how to avoid
problems
Investment counselor,
funeral directors
After-sale maintenance
personnel
Copyright © 2020 Pearson Education Ltd. All Rights Reserved.
Production Technology
1. Machine technology
2. Automatic identification systems (AIS s)
3. Process control
4. Vision systems
5. Robots
6. Automated storage and retrieval systems (ASRSs)
7. Automated guided vehicles (AGVs)
8. Flexible manufacturing systems (F MSs)
9. Computer-integrated manufacturing (CIM)
Copyright © 2020 Pearson Education Ltd. All Rights Reserved.
Machine Technology
•Increased precision, productivity,
and flexibility
•Reduced environmental impact
•Additive manufacturing
produces products by adding
material, not removing it
•Supports innovative product
design, minimal custom tooling
required, minimal assembly time,
low inventory, and reduced time
to market
Computer numerical
control (C NC)
Copyright © 2020 Pearson Education Ltd. All Rights Reserved.
Automatic Identification Systems
(AI Ss) and RFID
•Improved data acquisition
•Reduced data entry errors
•Increased speed
•Increased scope of process
automation
Bar codes and R F I D
Copyright © 2020 Pearson Education Ltd. All Rights Reserved.
Process Chart
Figure 7.5
Copyright © 2020 Pearson Education Ltd. All Rights Reserved.
Process Analysis and Design (3 of 3)
•Value-Stream Mapping (V SM)
–Where value is added in the entire production process,
including the supply chain
–Extends from the customer back to the suppliers
Copyright © 2020 Pearson Education Ltd. All Rights Reserved.
Value-Stream Mapping (1 of 3)
1. Begin with symbols for customer, supplier, and
production to ensure the big picture
2. Enter customer order requirements
3. Calculate the daily production requirements
4. Enter the outbound shipping requirements and delivery
frequency
5. Determine inbound shipping method and delivery
frequency
Copyright © 2020 Pearson Education Ltd. All Rights Reserved.
Value-Stream Mapping (2 of 3)
1. Add the process steps (i.e., machine, assemble) in
sequence, left to right
2. Add communication methods, add their frequency, and
show the direction with arrows
3. Add inventory quantities between every step of the
entire flow
4. Determine total working time (value-added time) and
delay (non-value-added time)
Copyright © 2020 Pearson Education Ltd. All Rights Reserved.
Value-Stream Mapping (3 of 3)
Figure 7.6
Copyright © 2020 Pearson Education Ltd. All Rights Reserved.
Service Blueprinting
•Focuses on the customer and provider interaction
•Defines three levels of interaction
•Each level has different management issues
•Identifies potential failure points
Copyright © 2020 Pearson Education Ltd. All Rights Reserved.
Service Blueprint (1 of 2)
Figure 7.7
Copyright © 2020 Pearson Education Ltd. All Rights Reserved.
Service Blueprint (2 of 2)
Figure 7.7
Special Considerations for Service
Process Strategies
•Some interaction with customer is necessary, but this often
affects performance adversely
•The better these interactions are accommodated in the
process design, the more efficient and effective the
process
•Find the right combination of cost and customer interaction
Copyright © 2020 Pearson Education Ltd. All Rights Reserved.
Service Process Matrix (3 of 3)
Service Factory and Service
Shop
•Automation of standardized
services
•Restricted offerings
•Low labor intensity responds
well to process technology
and scheduling
•Tight control required to
maintain standards
Copyright © 2020 Pearson Education Ltd. All Rights Reserved.
Improving Service Productivity (1 of 2)
Table 7.3 Techniques for Improving Service Productivity
STRATEGY TECHNIQUE EXAMPLE
Separation Structuring service so
customers must go where
the service is offered
Bank customers go to a
manager to open a new
account, to loan officers
for loans, and to tellers
for deposits
Self-service Self-service so customers
examine, compare, and
evaluate at their own
pace
Supermarkets and
department stores
Internet ordering
Postponement Customizing at delivery Customizing vans at
delivery rather than at
production
Focus Restricting the offerings Limited-menu restaurant
Copyright © 2020 Pearson Education Ltd. All Rights Reserved.
Improving Service Productivity (2 of 2)
Table 7.3 Techniques for Improving Service Productivity
STRATEGY TECHNIQUE EXAMPLE
Modules Modular selection of
service
Modular production
Investment and insurance
selection
Prepackaged food
modules in restaurants
Automation Separating services that
may lend themselves to
some type of automation
Automatic teller machines
Ordering via an app
Scheduling Precise personnel
scheduling
Scheduling airline ticket-
counter personnel at 15-
minute intervals
Training Clarifying the service
options
Explaining how to avoid
problems
Investment counselor,
funeral directors
After-sale maintenance
personnel
Copyright © 2020 Pearson Education Ltd. All Rights Reserved.
Production Technology
1. Machine technology
2. Automatic identification systems (AIS s)
3. Process control
4. Vision systems
5. Robots
6. Automated storage and retrieval systems (ASRSs)
7. Automated guided vehicles (AGVs)
8. Flexible manufacturing systems (F MSs)
9. Computer-integrated manufacturing (CIM)
Copyright © 2020 Pearson Education Ltd. All Rights Reserved.
Machine Technology
•Increased precision, productivity,
and flexibility
•Reduced environmental impact
•Additive manufacturing
produces products by adding
material, not removing it
•Supports innovative product
design, minimal custom tooling
required, minimal assembly time,
low inventory, and reduced time
to market
Computer numerical
control (C NC)
Copyright © 2020 Pearson Education Ltd. All Rights Reserved.
Automatic Identification Systems
(AI Ss) and RFID
•Improved data acquisition
•Reduced data entry errors
•Increased speed
•Increased scope of process
automation
Bar codes and R F I D
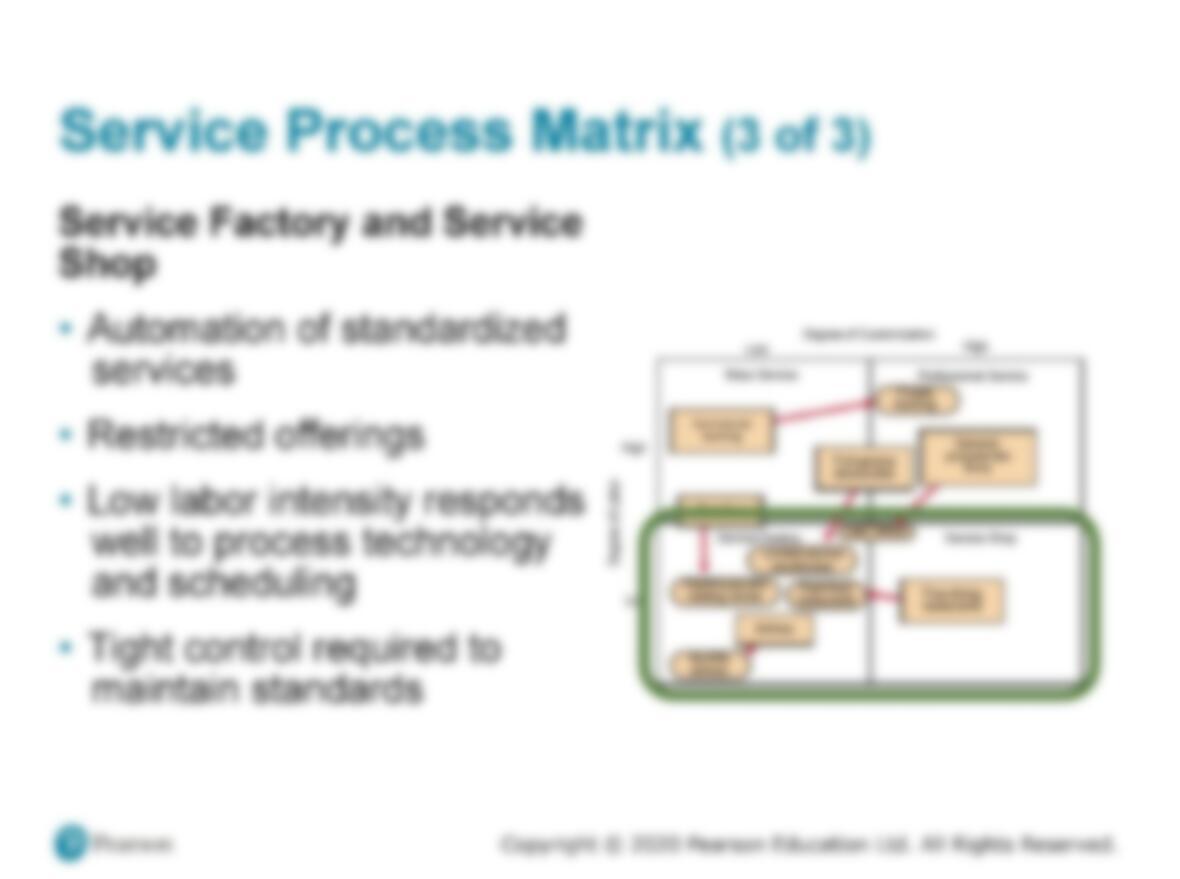
Copyright © 2020 Pearson Education Ltd. All Rights Reserved.
Process Chart
Figure 7.5
Copyright © 2020 Pearson Education Ltd. All Rights Reserved.
Process Analysis and Design (3 of 3)
•Value-Stream Mapping (V SM)
–Where value is added in the entire production process,
including the supply chain
–Extends from the customer back to the suppliers
Copyright © 2020 Pearson Education Ltd. All Rights Reserved.
Value-Stream Mapping (1 of 3)
1. Begin with symbols for customer, supplier, and
production to ensure the big picture
2. Enter customer order requirements
3. Calculate the daily production requirements
4. Enter the outbound shipping requirements and delivery
frequency
5. Determine inbound shipping method and delivery
frequency
Copyright © 2020 Pearson Education Ltd. All Rights Reserved.
Value-Stream Mapping (2 of 3)
1. Add the process steps (i.e., machine, assemble) in
sequence, left to right
2. Add communication methods, add their frequency, and
show the direction with arrows
3. Add inventory quantities between every step of the
entire flow
4. Determine total working time (value-added time) and
delay (non-value-added time)
Copyright © 2020 Pearson Education Ltd. All Rights Reserved.
Value-Stream Mapping (3 of 3)
Figure 7.6
Copyright © 2020 Pearson Education Ltd. All Rights Reserved.
Service Blueprinting
•Focuses on the customer and provider interaction
•Defines three levels of interaction
•Each level has different management issues
•Identifies potential failure points
Copyright © 2020 Pearson Education Ltd. All Rights Reserved.
Service Blueprint (1 of 2)
Figure 7.7
Copyright © 2020 Pearson Education Ltd. All Rights Reserved.
Service Blueprint (2 of 2)
Figure 7.7
Copyright © 2020 Pearson Education Ltd. All Rights Reserved.
Special Considerations for Service
Process Strategies
•Some interaction with customer is necessary, but this often
affects performance adversely
•The better these interactions are accommodated in the
process design, the more efficient and effective the
process
•Find the right combination of cost and customer interaction
Service Process Matrix (1 of 3)
Figure 7.8
Copyright © 2020 Pearson Education Ltd. All Rights Reserved.
Improving Service Productivity (1 of 2)
Table 7.3 Techniques for Improving Service Productivity
STRATEGY TECHNIQUE EXAMPLE
Separation Structuring service so
customers must go where
the service is offered
Bank customers go to a
manager to open a new
account, to loan officers
for loans, and to tellers
for deposits
Self-service Self-service so customers
examine, compare, and
evaluate at their own
pace
Supermarkets and
department stores
Internet ordering
Postponement Customizing at delivery Customizing vans at
delivery rather than at
production
Focus Restricting the offerings Limited-menu restaurant
Copyright © 2020 Pearson Education Ltd. All Rights Reserved.
Improving Service Productivity (2 of 2)
Table 7.3 Techniques for Improving Service Productivity
STRATEGY TECHNIQUE EXAMPLE
Modules Modular selection of
service
Modular production
Investment and insurance
selection
Prepackaged food
modules in restaurants
Automation Separating services that
may lend themselves to
some type of automation
Automatic teller machines
Ordering via an app
Scheduling Precise personnel
scheduling
Scheduling airline ticket-
counter personnel at 15-
minute intervals
Training Clarifying the service
options
Explaining how to avoid
problems
Investment counselor,
funeral directors
After-sale maintenance
personnel
Copyright © 2020 Pearson Education Ltd. All Rights Reserved.
Production Technology
1. Machine technology
2. Automatic identification systems (AIS s)
3. Process control
4. Vision systems
5. Robots
6. Automated storage and retrieval systems (ASRSs)
7. Automated guided vehicles (AGVs)
8. Flexible manufacturing systems (F MSs)
9. Computer-integrated manufacturing (CIM)
Copyright © 2020 Pearson Education Ltd. All Rights Reserved.
Machine Technology
•Increased precision, productivity,
and flexibility
•Reduced environmental impact
•Additive manufacturing
produces products by adding
material, not removing it
•Supports innovative product
design, minimal custom tooling
required, minimal assembly time,
low inventory, and reduced time
to market
Computer numerical
control (C NC)
Copyright © 2020 Pearson Education Ltd. All Rights Reserved.
Automatic Identification Systems
(AI Ss) and RFID
•Improved data acquisition
•Reduced data entry errors
•Increased speed
•Increased scope of process
automation
Bar codes and R F I D
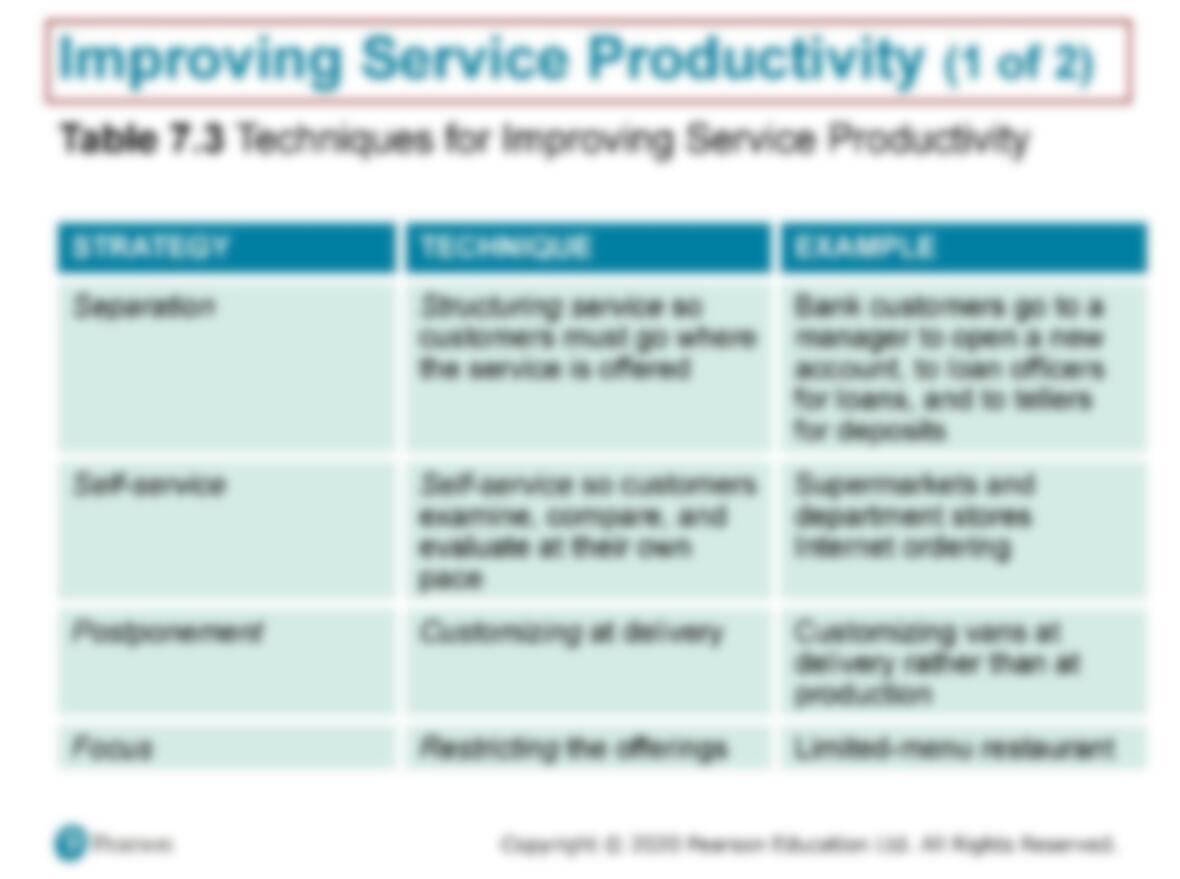
Copyright © 2020 Pearson Education Ltd. All Rights Reserved.
Process Chart
Figure 7.5
Copyright © 2020 Pearson Education Ltd. All Rights Reserved.
Process Analysis and Design (3 of 3)
•Value-Stream Mapping (V SM)
–Where value is added in the entire production process,
including the supply chain
–Extends from the customer back to the suppliers
Copyright © 2020 Pearson Education Ltd. All Rights Reserved.
Value-Stream Mapping (1 of 3)
1. Begin with symbols for customer, supplier, and
production to ensure the big picture
2. Enter customer order requirements
3. Calculate the daily production requirements
4. Enter the outbound shipping requirements and delivery
frequency
5. Determine inbound shipping method and delivery
frequency
Copyright © 2020 Pearson Education Ltd. All Rights Reserved.
Value-Stream Mapping (2 of 3)
1. Add the process steps (i.e., machine, assemble) in
sequence, left to right
2. Add communication methods, add their frequency, and
show the direction with arrows
3. Add inventory quantities between every step of the
entire flow
4. Determine total working time (value-added time) and
delay (non-value-added time)
Copyright © 2020 Pearson Education Ltd. All Rights Reserved.
Value-Stream Mapping (3 of 3)
Figure 7.6
Copyright © 2020 Pearson Education Ltd. All Rights Reserved.
Service Blueprinting
•Focuses on the customer and provider interaction
•Defines three levels of interaction
•Each level has different management issues
•Identifies potential failure points
Copyright © 2020 Pearson Education Ltd. All Rights Reserved.
Service Blueprint (1 of 2)
Figure 7.7
Copyright © 2020 Pearson Education Ltd. All Rights Reserved.
Service Blueprint (2 of 2)
Figure 7.7
Copyright © 2020 Pearson Education Ltd. All Rights Reserved.
Special Considerations for Service
Process Strategies
•Some interaction with customer is necessary, but this often
affects performance adversely
•The better these interactions are accommodated in the
process design, the more efficient and effective the
process
•Find the right combination of cost and customer interaction
Copyright © 2020 Pearson Education Ltd. All Rights Reserved.
Service Process Matrix (1 of 3)
Figure 7.8
Service Process Matrix (2 of 3)
Mass Service and
Professional Service
•Labor involvement is high
•Focus on human resources
•Selection and training highly
important
•Personalized services
Copyright © 2020 Pearson Education Ltd. All Rights Reserved.
Improving Service Productivity (2 of 2)
Table 7.3 Techniques for Improving Service Productivity
STRATEGY TECHNIQUE EXAMPLE
Modules Modular selection of
service
Modular production
Investment and insurance
selection
Prepackaged food
modules in restaurants
Automation Separating services that
may lend themselves to
some type of automation
Automatic teller machines
Ordering via an app
Scheduling Precise personnel
scheduling
Scheduling airline ticket-
counter personnel at 15-
minute intervals
Training Clarifying the service
options
Explaining how to avoid
problems
Investment counselor,
funeral directors
After-sale maintenance
personnel
Copyright © 2020 Pearson Education Ltd. All Rights Reserved.
Production Technology
1. Machine technology
2. Automatic identification systems (AIS s)
3. Process control
4. Vision systems
5. Robots
6. Automated storage and retrieval systems (ASRSs)
7. Automated guided vehicles (AGVs)
8. Flexible manufacturing systems (F MSs)
9. Computer-integrated manufacturing (CIM)
Copyright © 2020 Pearson Education Ltd. All Rights Reserved.
Machine Technology
•Increased precision, productivity,
and flexibility
•Reduced environmental impact
•Additive manufacturing
produces products by adding
material, not removing it
•Supports innovative product
design, minimal custom tooling
required, minimal assembly time,
low inventory, and reduced time
to market
Computer numerical
control (C NC)
Copyright © 2020 Pearson Education Ltd. All Rights Reserved.
Automatic Identification Systems
(AI Ss) and RFID
•Improved data acquisition
•Reduced data entry errors
•Increased speed
•Increased scope of process
automation
Bar codes and R F I D
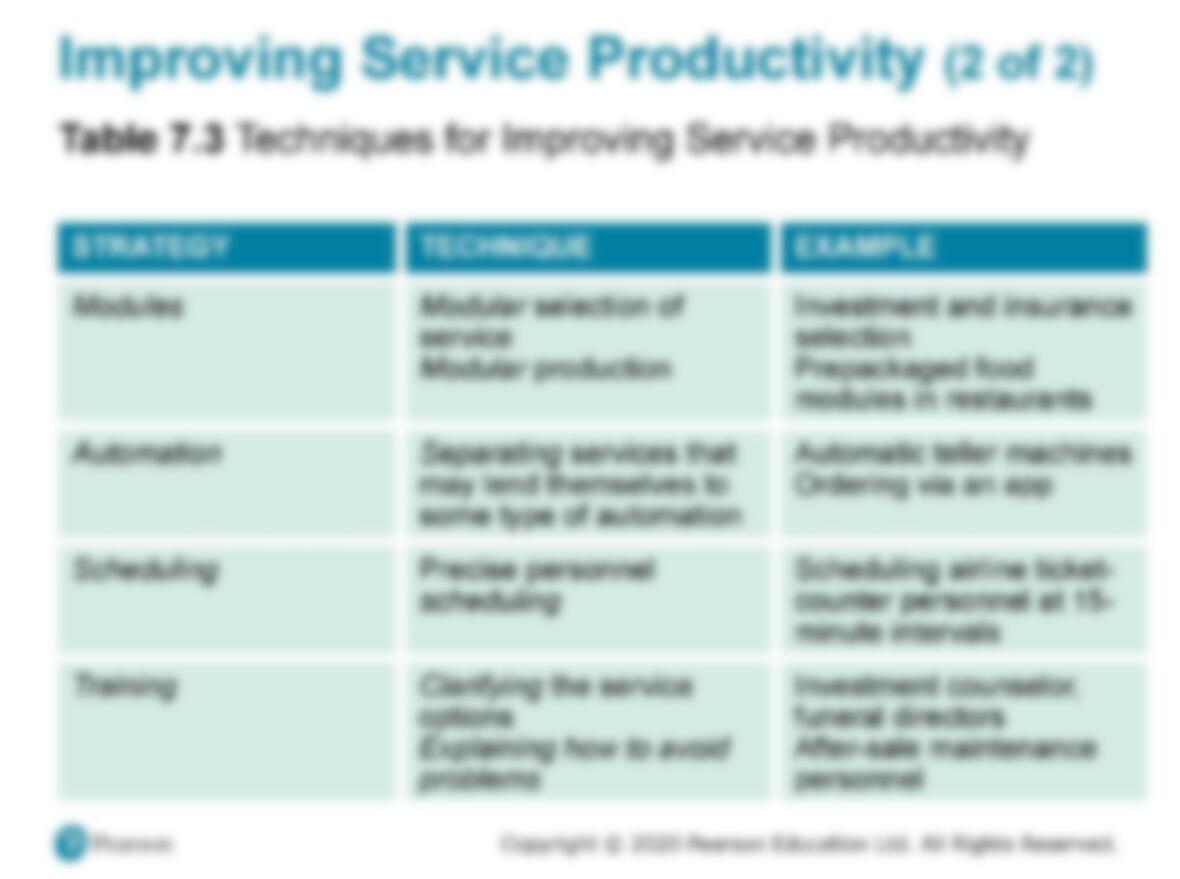
Copyright © 2020 Pearson Education Ltd. All Rights Reserved.
Process Chart
Figure 7.5
Copyright © 2020 Pearson Education Ltd. All Rights Reserved.
Process Analysis and Design (3 of 3)
•Value-Stream Mapping (V SM)
–Where value is added in the entire production process,
including the supply chain
–Extends from the customer back to the suppliers
Copyright © 2020 Pearson Education Ltd. All Rights Reserved.
Value-Stream Mapping (1 of 3)
1. Begin with symbols for customer, supplier, and
production to ensure the big picture
2. Enter customer order requirements
3. Calculate the daily production requirements
4. Enter the outbound shipping requirements and delivery
frequency
5. Determine inbound shipping method and delivery
frequency
Copyright © 2020 Pearson Education Ltd. All Rights Reserved.
Value-Stream Mapping (2 of 3)
1. Add the process steps (i.e., machine, assemble) in
sequence, left to right
2. Add communication methods, add their frequency, and
show the direction with arrows
3. Add inventory quantities between every step of the
entire flow
4. Determine total working time (value-added time) and
delay (non-value-added time)
Copyright © 2020 Pearson Education Ltd. All Rights Reserved.
Value-Stream Mapping (3 of 3)
Figure 7.6
Copyright © 2020 Pearson Education Ltd. All Rights Reserved.
Service Blueprinting
•Focuses on the customer and provider interaction
•Defines three levels of interaction
•Each level has different management issues
•Identifies potential failure points
Copyright © 2020 Pearson Education Ltd. All Rights Reserved.
Service Blueprint (1 of 2)
Figure 7.7
Copyright © 2020 Pearson Education Ltd. All Rights Reserved.
Service Blueprint (2 of 2)
Figure 7.7
Copyright © 2020 Pearson Education Ltd. All Rights Reserved.
Special Considerations for Service
Process Strategies
•Some interaction with customer is necessary, but this often
affects performance adversely
•The better these interactions are accommodated in the
process design, the more efficient and effective the
process
•Find the right combination of cost and customer interaction
Copyright © 2020 Pearson Education Ltd. All Rights Reserved.
Service Process Matrix (1 of 3)
Figure 7.8
Copyright © 2020 Pearson Education Ltd. All Rights Reserved.
Service Process Matrix (2 of 3)
Mass Service and
Professional Service
•Labor involvement is high
•Focus on human resources
•Selection and training highly
important
•Personalized services
Service Process Matrix (3 of 3)
Service Factory and Service
Shop
•Automation of standardized
services
•Restricted offerings
•Low labor intensity responds
well to process technology
and scheduling
•Tight control required to
Copyright © 2020 Pearson Education Ltd. All Rights Reserved.
Production Technology
1. Machine technology
2. Automatic identification systems (AIS s)
3. Process control
4. Vision systems
5. Robots
6. Automated storage and retrieval systems (ASRSs)
7. Automated guided vehicles (AGVs)
8. Flexible manufacturing systems (F MSs)
9. Computer-integrated manufacturing (CIM)
Copyright © 2020 Pearson Education Ltd. All Rights Reserved.
Machine Technology
•Increased precision, productivity,
and flexibility
•Reduced environmental impact
•Additive manufacturing
produces products by adding
material, not removing it
•Supports innovative product
design, minimal custom tooling
required, minimal assembly time,
low inventory, and reduced time
to market
Computer numerical
control (C NC)
Copyright © 2020 Pearson Education Ltd. All Rights Reserved.
Automatic Identification Systems
(AI Ss) and RFID
•Improved data acquisition
•Reduced data entry errors
•Increased speed
•Increased scope of process
automation
Bar codes and R F I D
Copyright © 2020 Pearson Education Ltd. All Rights Reserved.
Process Chart
Figure 7.5
Copyright © 2020 Pearson Education Ltd. All Rights Reserved.
Process Analysis and Design (3 of 3)
•Value-Stream Mapping (V SM)
–Where value is added in the entire production process,
including the supply chain
–Extends from the customer back to the suppliers
Copyright © 2020 Pearson Education Ltd. All Rights Reserved.
Value-Stream Mapping (1 of 3)
1. Begin with symbols for customer, supplier, and
production to ensure the big picture
2. Enter customer order requirements
3. Calculate the daily production requirements
4. Enter the outbound shipping requirements and delivery
frequency
5. Determine inbound shipping method and delivery
frequency
Copyright © 2020 Pearson Education Ltd. All Rights Reserved.
Value-Stream Mapping (2 of 3)
1. Add the process steps (i.e., machine, assemble) in
sequence, left to right
2. Add communication methods, add their frequency, and
show the direction with arrows
3. Add inventory quantities between every step of the
entire flow
4. Determine total working time (value-added time) and
delay (non-value-added time)
Copyright © 2020 Pearson Education Ltd. All Rights Reserved.
Value-Stream Mapping (3 of 3)
Figure 7.6
Copyright © 2020 Pearson Education Ltd. All Rights Reserved.
Service Blueprinting
•Focuses on the customer and provider interaction
•Defines three levels of interaction
•Each level has different management issues
•Identifies potential failure points
Copyright © 2020 Pearson Education Ltd. All Rights Reserved.
Service Blueprint (1 of 2)
Figure 7.7
Copyright © 2020 Pearson Education Ltd. All Rights Reserved.
Service Blueprint (2 of 2)
Figure 7.7
Copyright © 2020 Pearson Education Ltd. All Rights Reserved.
Special Considerations for Service
Process Strategies
•Some interaction with customer is necessary, but this often
affects performance adversely
•The better these interactions are accommodated in the
process design, the more efficient and effective the
process
•Find the right combination of cost and customer interaction
Copyright © 2020 Pearson Education Ltd. All Rights Reserved.
Service Process Matrix (1 of 3)
Figure 7.8
Copyright © 2020 Pearson Education Ltd. All Rights Reserved.
Service Process Matrix (2 of 3)
Mass Service and
Professional Service
•Labor involvement is high
•Focus on human resources
•Selection and training highly
important
•Personalized services
Copyright © 2020 Pearson Education Ltd. All Rights Reserved.
Service Process Matrix (3 of 3)
Service Factory and Service
Shop
•Automation of standardized
services
•Restricted offerings
•Low labor intensity responds
well to process technology
and scheduling
•Tight control required to
maintain standards
Improving Service Productivity (1 of 2)
Table 7.3 Techniques for Improving Service Productivity
STRATEGY TECHNIQUE EXAMPLE
Separation Structuring service so
customers must go where
the service is offered
Bank customers go to a
manager to open a new
account, to loan officers
for loans, and to tellers
for deposits
Self-service Self-service so customers
examine, compare, and
evaluate at their own
pace
Supermarkets and
department stores
Internet ordering
Postponement Customizing at delivery Customizing vans at
Copyright © 2020 Pearson Education Ltd. All Rights Reserved.
Machine Technology
•Increased precision, productivity,
and flexibility
•Reduced environmental impact
•Additive manufacturing
produces products by adding
material, not removing it
•Supports innovative product
design, minimal custom tooling
required, minimal assembly time,
low inventory, and reduced time
to market
Computer numerical
control (C NC)
Copyright © 2020 Pearson Education Ltd. All Rights Reserved.
Automatic Identification Systems
(AI Ss) and RFID
•Improved data acquisition
•Reduced data entry errors
•Increased speed
•Increased scope of process
automation
Bar codes and R F I D
Copyright © 2020 Pearson Education Ltd. All Rights Reserved.
Process Chart
Figure 7.5
Copyright © 2020 Pearson Education Ltd. All Rights Reserved.
Process Analysis and Design (3 of 3)
•Value-Stream Mapping (V SM)
–Where value is added in the entire production process,
including the supply chain
–Extends from the customer back to the suppliers
Copyright © 2020 Pearson Education Ltd. All Rights Reserved.
Value-Stream Mapping (1 of 3)
1. Begin with symbols for customer, supplier, and
production to ensure the big picture
2. Enter customer order requirements
3. Calculate the daily production requirements
4. Enter the outbound shipping requirements and delivery
frequency
5. Determine inbound shipping method and delivery
frequency
Copyright © 2020 Pearson Education Ltd. All Rights Reserved.
Value-Stream Mapping (2 of 3)
1. Add the process steps (i.e., machine, assemble) in
sequence, left to right
2. Add communication methods, add their frequency, and
show the direction with arrows
3. Add inventory quantities between every step of the
entire flow
4. Determine total working time (value-added time) and
delay (non-value-added time)
Copyright © 2020 Pearson Education Ltd. All Rights Reserved.
Value-Stream Mapping (3 of 3)
Figure 7.6
Copyright © 2020 Pearson Education Ltd. All Rights Reserved.
Service Blueprinting
•Focuses on the customer and provider interaction
•Defines three levels of interaction
•Each level has different management issues
•Identifies potential failure points
Copyright © 2020 Pearson Education Ltd. All Rights Reserved.
Service Blueprint (1 of 2)
Figure 7.7
Copyright © 2020 Pearson Education Ltd. All Rights Reserved.
Service Blueprint (2 of 2)
Figure 7.7
Copyright © 2020 Pearson Education Ltd. All Rights Reserved.
Special Considerations for Service
Process Strategies
•Some interaction with customer is necessary, but this often
affects performance adversely
•The better these interactions are accommodated in the
process design, the more efficient and effective the
process
•Find the right combination of cost and customer interaction
Copyright © 2020 Pearson Education Ltd. All Rights Reserved.
Service Process Matrix (1 of 3)
Figure 7.8
Copyright © 2020 Pearson Education Ltd. All Rights Reserved.
Service Process Matrix (2 of 3)
Mass Service and
Professional Service
•Labor involvement is high
•Focus on human resources
•Selection and training highly
important
•Personalized services
Copyright © 2020 Pearson Education Ltd. All Rights Reserved.
Service Process Matrix (3 of 3)
Service Factory and Service
Shop
•Automation of standardized
services
•Restricted offerings
•Low labor intensity responds
well to process technology
and scheduling
•Tight control required to
maintain standards
Copyright © 2020 Pearson Education Ltd. All Rights Reserved.
Improving Service Productivity (1 of 2)
Table 7.3 Techniques for Improving Service Productivity
STRATEGY TECHNIQUE EXAMPLE
Separation Structuring service so
customers must go where
the service is offered
Bank customers go to a
manager to open a new
account, to loan officers
for loans, and to tellers
for deposits
Self-service Self-service so customers
examine, compare, and
evaluate at their own
pace
Supermarkets and
department stores
Internet ordering
Postponement Customizing at delivery Customizing vans at
delivery rather than at
production
Focus Restricting the offerings Limited-menu restaurant
Improving Service Productivity (2 of 2)
Table 7.3 Techniques for Improving Service Productivity
STRATEGY TECHNIQUE EXAMPLE
Modules Modular selection of
service
Modular production
Investment and insurance
selection
Prepackaged food
modules in restaurants
Automation Separating services that
may lend themselves to
some type of automation
Automatic teller machines
Ordering via an app
Scheduling Precise personnel
scheduling
Scheduling airline ticket-
counter personnel at 15-
minute intervals
Copyright © 2020 Pearson Education Ltd. All Rights Reserved.
Automatic Identification Systems
(AI Ss) and RFID
•Improved data acquisition
•Reduced data entry errors
•Increased speed
•Increased scope of process
automation
Bar codes and R F I D
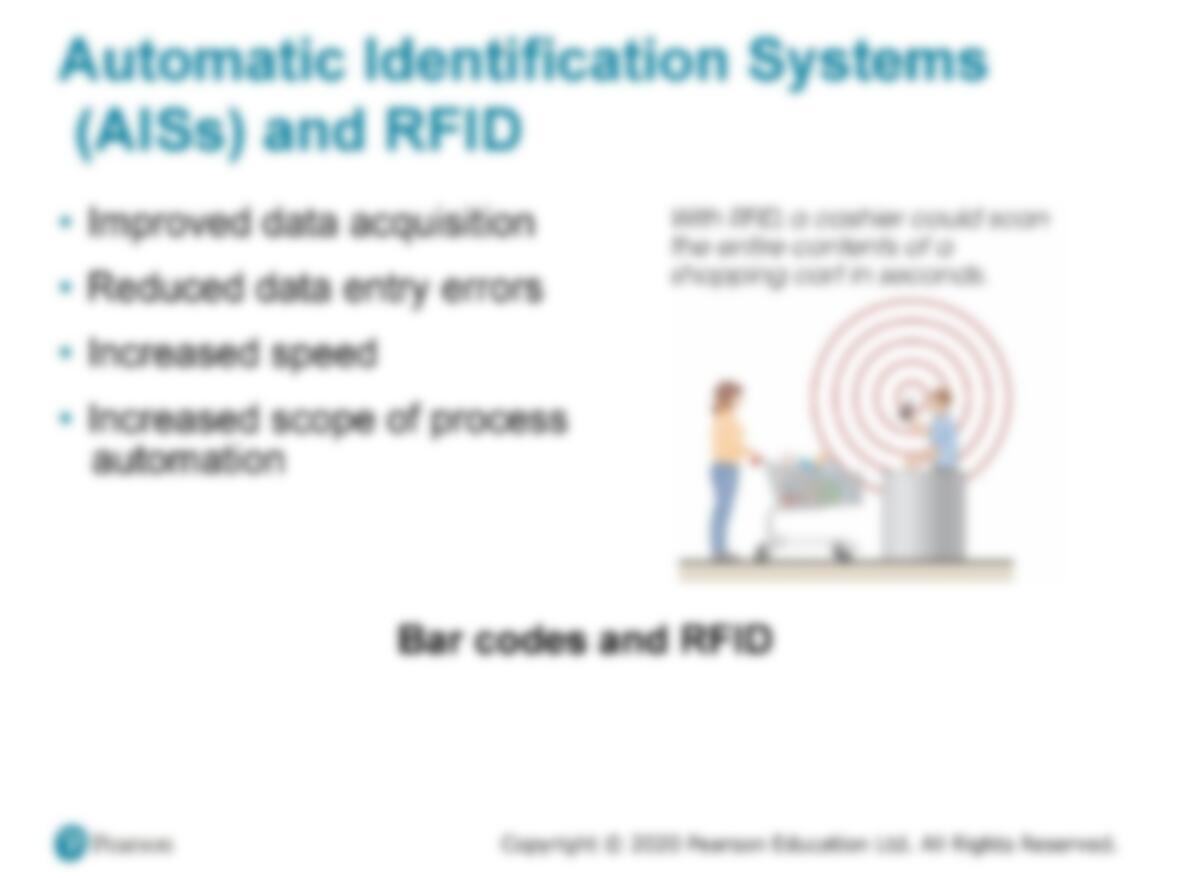
Copyright © 2020 Pearson Education Ltd. All Rights Reserved.
Process Chart
Figure 7.5
Copyright © 2020 Pearson Education Ltd. All Rights Reserved.
Process Analysis and Design (3 of 3)
•Value-Stream Mapping (V SM)
–Where value is added in the entire production process,
including the supply chain
–Extends from the customer back to the suppliers
Copyright © 2020 Pearson Education Ltd. All Rights Reserved.
Value-Stream Mapping (1 of 3)
1. Begin with symbols for customer, supplier, and
production to ensure the big picture
2. Enter customer order requirements
3. Calculate the daily production requirements
4. Enter the outbound shipping requirements and delivery
frequency
5. Determine inbound shipping method and delivery
frequency
Copyright © 2020 Pearson Education Ltd. All Rights Reserved.
Value-Stream Mapping (2 of 3)
1. Add the process steps (i.e., machine, assemble) in
sequence, left to right
2. Add communication methods, add their frequency, and
show the direction with arrows
3. Add inventory quantities between every step of the
entire flow
4. Determine total working time (value-added time) and
delay (non-value-added time)
Copyright © 2020 Pearson Education Ltd. All Rights Reserved.
Value-Stream Mapping (3 of 3)
Figure 7.6
Copyright © 2020 Pearson Education Ltd. All Rights Reserved.
Service Blueprinting
•Focuses on the customer and provider interaction
•Defines three levels of interaction
•Each level has different management issues
•Identifies potential failure points
Copyright © 2020 Pearson Education Ltd. All Rights Reserved.
Service Blueprint (1 of 2)
Figure 7.7
Copyright © 2020 Pearson Education Ltd. All Rights Reserved.
Service Blueprint (2 of 2)
Figure 7.7
Copyright © 2020 Pearson Education Ltd. All Rights Reserved.
Special Considerations for Service
Process Strategies
•Some interaction with customer is necessary, but this often
affects performance adversely
•The better these interactions are accommodated in the
process design, the more efficient and effective the
process
•Find the right combination of cost and customer interaction
Copyright © 2020 Pearson Education Ltd. All Rights Reserved.
Service Process Matrix (1 of 3)
Figure 7.8
Copyright © 2020 Pearson Education Ltd. All Rights Reserved.
Service Process Matrix (2 of 3)
Mass Service and
Professional Service
•Labor involvement is high
•Focus on human resources
•Selection and training highly
important
•Personalized services
Copyright © 2020 Pearson Education Ltd. All Rights Reserved.
Service Process Matrix (3 of 3)
Service Factory and Service
Shop
•Automation of standardized
services
•Restricted offerings
•Low labor intensity responds
well to process technology
and scheduling
•Tight control required to
maintain standards
Copyright © 2020 Pearson Education Ltd. All Rights Reserved.
Improving Service Productivity (1 of 2)
Table 7.3 Techniques for Improving Service Productivity
STRATEGY TECHNIQUE EXAMPLE
Separation Structuring service so
customers must go where
the service is offered
Bank customers go to a
manager to open a new
account, to loan officers
for loans, and to tellers
for deposits
Self-service Self-service so customers
examine, compare, and
evaluate at their own
pace
Supermarkets and
department stores
Internet ordering
Postponement Customizing at delivery Customizing vans at
delivery rather than at
production
Focus Restricting the offerings Limited-menu restaurant
Copyright © 2020 Pearson Education Ltd. All Rights Reserved.
Improving Service Productivity (2 of 2)
Table 7.3 Techniques for Improving Service Productivity
STRATEGY TECHNIQUE EXAMPLE
Modules Modular selection of
service
Modular production
Investment and insurance
selection
Prepackaged food
modules in restaurants
Automation Separating services that
may lend themselves to
some type of automation
Automatic teller machines
Ordering via an app
Scheduling Precise personnel
scheduling
Scheduling airline ticket-
counter personnel at 15-
minute intervals
Training Clarifying the service
options
Explaining how to avoid
problems
Investment counselor,
funeral directors
After-sale maintenance
personnel
Production Technology
1. Machine technology
2. Automatic identification systems (AIS s)
3. Process control
4. Vision systems
5. Robots
6. Automated storage and retrieval systems (ASRSs)
7. Automated guided vehicles (AGVs)
Copyright © 2020 Pearson Education Ltd. All Rights Reserved.
Process Chart
Figure 7.5
Copyright © 2020 Pearson Education Ltd. All Rights Reserved.
Process Analysis and Design (3 of 3)
•Value-Stream Mapping (V SM)
–Where value is added in the entire production process,
including the supply chain
–Extends from the customer back to the suppliers
Copyright © 2020 Pearson Education Ltd. All Rights Reserved.
Value-Stream Mapping (1 of 3)
1. Begin with symbols for customer, supplier, and
production to ensure the big picture
2. Enter customer order requirements
3. Calculate the daily production requirements
4. Enter the outbound shipping requirements and delivery
frequency
5. Determine inbound shipping method and delivery
frequency
Copyright © 2020 Pearson Education Ltd. All Rights Reserved.
Value-Stream Mapping (2 of 3)
1. Add the process steps (i.e., machine, assemble) in
sequence, left to right
2. Add communication methods, add their frequency, and
show the direction with arrows
3. Add inventory quantities between every step of the
entire flow
4. Determine total working time (value-added time) and
delay (non-value-added time)
Copyright © 2020 Pearson Education Ltd. All Rights Reserved.
Value-Stream Mapping (3 of 3)
Figure 7.6
Copyright © 2020 Pearson Education Ltd. All Rights Reserved.
Service Blueprinting
•Focuses on the customer and provider interaction
•Defines three levels of interaction
•Each level has different management issues
•Identifies potential failure points
Copyright © 2020 Pearson Education Ltd. All Rights Reserved.
Service Blueprint (1 of 2)
Figure 7.7
Copyright © 2020 Pearson Education Ltd. All Rights Reserved.
Service Blueprint (2 of 2)
Figure 7.7
Copyright © 2020 Pearson Education Ltd. All Rights Reserved.
Special Considerations for Service
Process Strategies
•Some interaction with customer is necessary, but this often
affects performance adversely
•The better these interactions are accommodated in the
process design, the more efficient and effective the
process
•Find the right combination of cost and customer interaction
Copyright © 2020 Pearson Education Ltd. All Rights Reserved.
Service Process Matrix (1 of 3)
Figure 7.8
Copyright © 2020 Pearson Education Ltd. All Rights Reserved.
Service Process Matrix (2 of 3)
Mass Service and
Professional Service
•Labor involvement is high
•Focus on human resources
•Selection and training highly
important
•Personalized services
Copyright © 2020 Pearson Education Ltd. All Rights Reserved.
Service Process Matrix (3 of 3)
Service Factory and Service
Shop
•Automation of standardized
services
•Restricted offerings
•Low labor intensity responds
well to process technology
and scheduling
•Tight control required to
maintain standards
Copyright © 2020 Pearson Education Ltd. All Rights Reserved.
Improving Service Productivity (1 of 2)
Table 7.3 Techniques for Improving Service Productivity
STRATEGY TECHNIQUE EXAMPLE
Separation Structuring service so
customers must go where
the service is offered
Bank customers go to a
manager to open a new
account, to loan officers
for loans, and to tellers
for deposits
Self-service Self-service so customers
examine, compare, and
evaluate at their own
pace
Supermarkets and
department stores
Internet ordering
Postponement Customizing at delivery Customizing vans at
delivery rather than at
production
Focus Restricting the offerings Limited-menu restaurant
Copyright © 2020 Pearson Education Ltd. All Rights Reserved.
Improving Service Productivity (2 of 2)
Table 7.3 Techniques for Improving Service Productivity
STRATEGY TECHNIQUE EXAMPLE
Modules Modular selection of
service
Modular production
Investment and insurance
selection
Prepackaged food
modules in restaurants
Automation Separating services that
may lend themselves to
some type of automation
Automatic teller machines
Ordering via an app
Scheduling Precise personnel
scheduling
Scheduling airline ticket-
counter personnel at 15-
minute intervals
Training Clarifying the service
options
Explaining how to avoid
problems
Investment counselor,
funeral directors
After-sale maintenance
personnel
Copyright © 2020 Pearson Education Ltd. All Rights Reserved.
Production Technology
1. Machine technology
2. Automatic identification systems (AIS s)
3. Process control
4. Vision systems
5. Robots
6. Automated storage and retrieval systems (ASRSs)
7. Automated guided vehicles (AGVs)
8. Flexible manufacturing systems (F MSs)
9. Computer-integrated manufacturing (CIM)
Copyright © 2020 Pearson Education Ltd. All Rights Reserved.
Machine Technology
•Increased precision, productivity,
and flexibility
•Reduced environmental impact
•Additive manufacturing
produces products by adding
material, not removing it
•Supports innovative product
design, minimal custom tooling
required, minimal assembly time,
low inventory, and reduced time
to market
Computer numerical
control (C NC)
Automatic Identification Systems
(AI Ss) and RFID
•Improved data acquisition
•Reduced data entry errors
•Increased speed
•Increased scope of process
automation
Copyright © 2020 Pearson Education Ltd. All Rights Reserved.
Vision Systems
•Particular aid to inspection
•Consistently accurate
•Never bored
•Modest cost
•Superior to individuals performing the same tasks
Copyright © 2020 Pearson Education Ltd. All Rights Reserved.
Robots
•Perform monotonous or
dangerous tasks
•Perform tasks requiring
significant strength or
endurance
•Generally enhanced
consistency and accuracy
Copyright © 2020 Pearson Education Ltd. All Rights Reserved.
Automated Storage and Retrieval
Systems (AS RSs)
•Automated placement and
withdrawal of parts and
products
•Reduced errors and labor
•Particularly useful in
inventory and test areas of
manufacturing firms
Copyright © 2020 Pearson Education Ltd. All Rights Reserved.
Automated Guided Vehicle (AG Vs)
•Electronically guided and controlled carts
•Used for movement of products and/or individuals
Copyright © 2020 Pearson Education Ltd. All Rights Reserved.
Flexible Manufacturing Systems (F
MSs)
•Computer controls both the workstation and the material
handling equipment
•Enhanced flexibility and reduced waste
•Can economically produce low volume but high variety
•Reduced changeover time and increased utilization
•Stringent communication requirement between
components
Copyright © 2020 Pearson Education Ltd. All Rights Reserved.
Computer-Integrated Manufacturing
(CI M) (1 of 2)
•Extend flexible manufacturing
–Backward to engineering and inventory control
–Forward into warehousing and shipping
–Can also include financial and customer service areas
–Reducing the distinction between low-volume/high-
variety, and high-volume/low-variety production
Copyright © 2020 Pearson Education Ltd. All Rights Reserved.
Computer-Integrated Manufacturing
(CI M) (2 of 2)
Figure 7.9
Copyright © 2020 Pearson Education Ltd. All Rights Reserved.
Technology in Services (1 of 3)
Table 7.4 Examples of Technology’s Impact on Services
SERVICE INDUSTRY EXAMPLE
Financial Services
Debit cards, electronic funds transfer, ATMs,
Internet stock trading, online banking via cell
phone, Apple pay
Education
Online newspapers and journals, interactive
assignments via WebCT, Blackboard, and
smartphones
Utilities and government
Automated one-person garbage trucks, optical mail
scanners, flood-warning systems, meters that allow
homeowners to control energy usage and costs
Restaurants and foods
Wireless orders from waiters to kitchen, robot
butchering, transponders on cars that track sales at
drive-throughs
Copyright © 2020 Pearson Education Ltd. All Rights Reserved.
Technology in Services (2 of 3)
Table 7.4 Examples of Technology’s Impact on Services
SERVICE INDUSTRY EXAMPLE
Communications Interactive TV, e-books via Kindle, speech
recognition
Hotels Electronic check-in/check-out, electronic key/lock
systems, mobile Web bookings
Wholesale/retail trade Point-of-sale (POS) terminals, e-commerce,
electronic communication between store and
supplier, bar-coded data, RFID, self-checkout, pay
via facial recognition
Transportation Automatic toll booths, satellite-directed navigation
systems, Wi-Fi in automobiles
Copyright © 2020 Pearson Education Ltd. All Rights Reserved.
Technology in Services (3 of 3)
Table 7.4 Examples of Technology’s Impact on Services
SERVICE INDUSTRY EXAMPLE
Health care Online patient-monitoring systems, online medical
information systems, robotic surgery, artificial
intelligence for medical diagnoses
Airlines Ticketless travel, scheduling, Internet purchases,
boarding passes downloaded as two-dimensional
bar codes on smart phones
Copyright © 2020 Pearson Education Ltd. All Rights Reserved.
Process Redesign
•The fundamental rethinking of business processes to bring
about dramatic improvements in performance
•Relies on reevaluating the purpose of the process and
questioning both the purpose and the underlying
assumptions
•Requires reexamination of the basic process and its
objectives
•Focuses on activities that cross functional lines
•Any process is a candidate for redesign
Copyright © 2020 Pearson Education Ltd. All Rights Reserved.
Copyright
This work is protected by United States copyright laws and is
provided solely for the use of instructors in teaching their courses
and assessing student learning. Dissemination or sale of any part of
this work (including on the World Wide Web) will destroy the integrity
of the work and is not permitted. The work and materials from it
should never be made available to students except by instructors
using the accompanying text in their classes. All recipients of this
work are expected to abide by these restrictions and to honor the
intended pedagogical purposes and the needs of other instructors
who rely on these materials.
Copyright © 2020 Pearson Education Ltd. All Rights Reserved.
Robots
•Perform monotonous or
dangerous tasks
•Perform tasks requiring
significant strength or
endurance
•Generally enhanced
consistency and accuracy
Copyright © 2020 Pearson Education Ltd. All Rights Reserved.
Automated Storage and Retrieval
Systems (AS RSs)
•Automated placement and
withdrawal of parts and
products
•Reduced errors and labor
•Particularly useful in
inventory and test areas of
manufacturing firms
Copyright © 2020 Pearson Education Ltd. All Rights Reserved.
Automated Guided Vehicle (AG Vs)
•Electronically guided and controlled carts
•Used for movement of products and/or individuals
Copyright © 2020 Pearson Education Ltd. All Rights Reserved.
Flexible Manufacturing Systems (F
MSs)
•Computer controls both the workstation and the material
handling equipment
•Enhanced flexibility and reduced waste
•Can economically produce low volume but high variety
•Reduced changeover time and increased utilization
•Stringent communication requirement between
components
Copyright © 2020 Pearson Education Ltd. All Rights Reserved.
Computer-Integrated Manufacturing
(CI M) (1 of 2)
•Extend flexible manufacturing
–Backward to engineering and inventory control
–Forward into warehousing and shipping
–Can also include financial and customer service areas
–Reducing the distinction between low-volume/high-
variety, and high-volume/low-variety production
Copyright © 2020 Pearson Education Ltd. All Rights Reserved.
Computer-Integrated Manufacturing
(CI M) (2 of 2)
Figure 7.9
Copyright © 2020 Pearson Education Ltd. All Rights Reserved.
Technology in Services (1 of 3)
Table 7.4 Examples of Technology’s Impact on Services
SERVICE INDUSTRY EXAMPLE
Financial Services
Debit cards, electronic funds transfer, ATMs,
Internet stock trading, online banking via cell
phone, Apple pay
Education
Online newspapers and journals, interactive
assignments via WebCT, Blackboard, and
smartphones
Utilities and government
Automated one-person garbage trucks, optical mail
scanners, flood-warning systems, meters that allow
homeowners to control energy usage and costs
Restaurants and foods
Wireless orders from waiters to kitchen, robot
butchering, transponders on cars that track sales at
drive-throughs
Copyright © 2020 Pearson Education Ltd. All Rights Reserved.
Technology in Services (2 of 3)
Table 7.4 Examples of Technology’s Impact on Services
SERVICE INDUSTRY EXAMPLE
Communications Interactive TV, e-books via Kindle, speech
recognition
Hotels Electronic check-in/check-out, electronic key/lock
systems, mobile Web bookings
Wholesale/retail trade Point-of-sale (POS) terminals, e-commerce,
electronic communication between store and
supplier, bar-coded data, RFID, self-checkout, pay
via facial recognition
Transportation Automatic toll booths, satellite-directed navigation
systems, Wi-Fi in automobiles
Copyright © 2020 Pearson Education Ltd. All Rights Reserved.
Technology in Services (3 of 3)
Table 7.4 Examples of Technology’s Impact on Services
SERVICE INDUSTRY EXAMPLE
Health care Online patient-monitoring systems, online medical
information systems, robotic surgery, artificial
intelligence for medical diagnoses
Airlines Ticketless travel, scheduling, Internet purchases,
boarding passes downloaded as two-dimensional
bar codes on smart phones
Copyright © 2020 Pearson Education Ltd. All Rights Reserved.
Process Redesign
•The fundamental rethinking of business processes to bring
about dramatic improvements in performance
•Relies on reevaluating the purpose of the process and
questioning both the purpose and the underlying
assumptions
•Requires reexamination of the basic process and its
objectives
•Focuses on activities that cross functional lines
•Any process is a candidate for redesign
Copyright © 2020 Pearson Education Ltd. All Rights Reserved.
Copyright
This work is protected by United States copyright laws and is
provided solely for the use of instructors in teaching their courses
and assessing student learning. Dissemination or sale of any part of
this work (including on the World Wide Web) will destroy the integrity
of the work and is not permitted. The work and materials from it
should never be made available to students except by instructors
using the accompanying text in their classes. All recipients of this
work are expected to abide by these restrictions and to honor the
intended pedagogical purposes and the needs of other instructors
who rely on these materials.
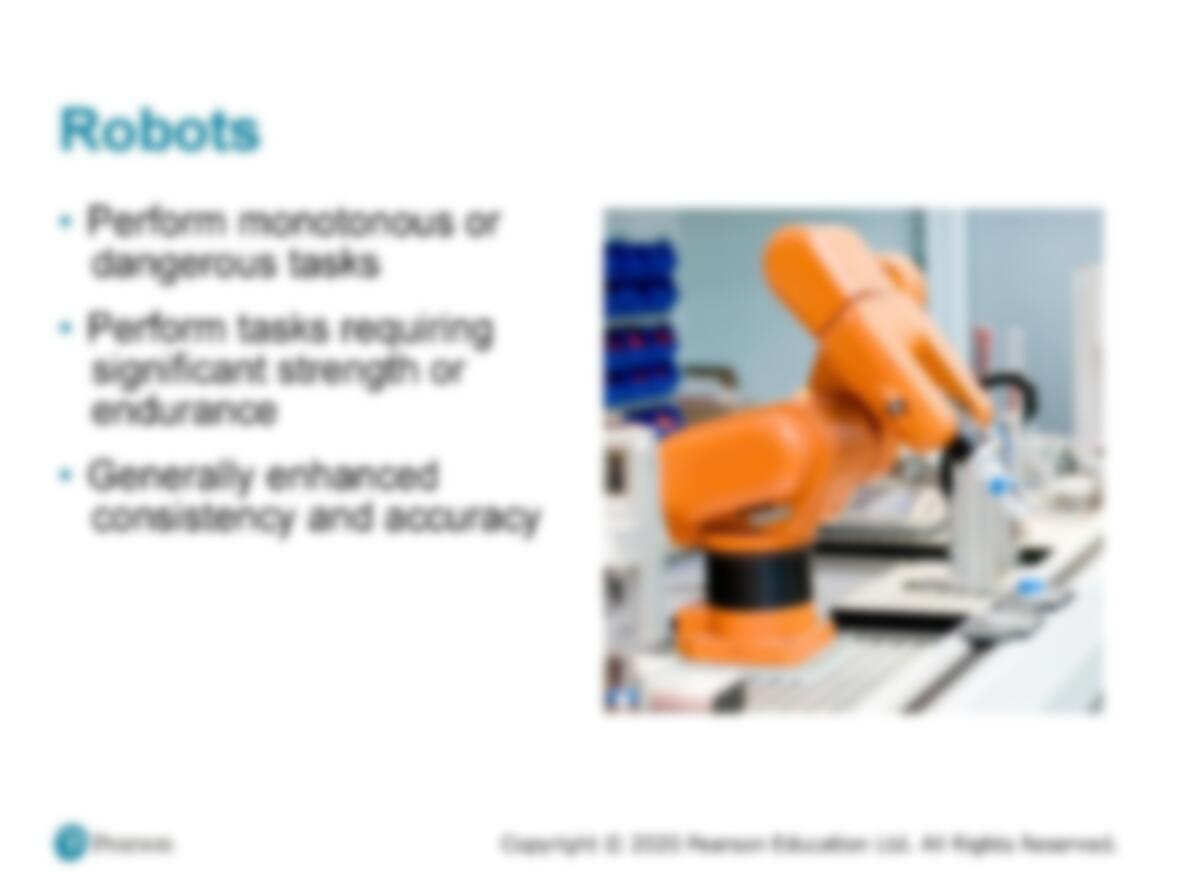
Process Control
•Real-time monitoring and
control of processes
–Sensors collect data
–Devices read data on
periodic basis
–Measurements
translated into digital
signals, then sent to a
computer
–Computer programs
Copyright © 2020 Pearson Education Ltd. All Rights Reserved.
Automated Storage and Retrieval
Systems (AS RSs)
•Automated placement and
withdrawal of parts and
products
•Reduced errors and labor
•Particularly useful in
inventory and test areas of
manufacturing firms
Copyright © 2020 Pearson Education Ltd. All Rights Reserved.
Automated Guided Vehicle (AG Vs)
•Electronically guided and controlled carts
•Used for movement of products and/or individuals
Copyright © 2020 Pearson Education Ltd. All Rights Reserved.
Flexible Manufacturing Systems (F
MSs)
•Computer controls both the workstation and the material
handling equipment
•Enhanced flexibility and reduced waste
•Can economically produce low volume but high variety
•Reduced changeover time and increased utilization
•Stringent communication requirement between
components
Copyright © 2020 Pearson Education Ltd. All Rights Reserved.
Computer-Integrated Manufacturing
(CI M) (1 of 2)
•Extend flexible manufacturing
–Backward to engineering and inventory control
–Forward into warehousing and shipping
–Can also include financial and customer service areas
–Reducing the distinction between low-volume/high-
variety, and high-volume/low-variety production
Copyright © 2020 Pearson Education Ltd. All Rights Reserved.
Computer-Integrated Manufacturing
(CI M) (2 of 2)
Figure 7.9
Copyright © 2020 Pearson Education Ltd. All Rights Reserved.
Technology in Services (1 of 3)
Table 7.4 Examples of Technology’s Impact on Services
SERVICE INDUSTRY EXAMPLE
Financial Services
Debit cards, electronic funds transfer, ATMs,
Internet stock trading, online banking via cell
phone, Apple pay
Education
Online newspapers and journals, interactive
assignments via WebCT, Blackboard, and
smartphones
Utilities and government
Automated one-person garbage trucks, optical mail
scanners, flood-warning systems, meters that allow
homeowners to control energy usage and costs
Restaurants and foods
Wireless orders from waiters to kitchen, robot
butchering, transponders on cars that track sales at
drive-throughs
Copyright © 2020 Pearson Education Ltd. All Rights Reserved.
Technology in Services (2 of 3)
Table 7.4 Examples of Technology’s Impact on Services
SERVICE INDUSTRY EXAMPLE
Communications Interactive TV, e-books via Kindle, speech
recognition
Hotels Electronic check-in/check-out, electronic key/lock
systems, mobile Web bookings
Wholesale/retail trade Point-of-sale (POS) terminals, e-commerce,
electronic communication between store and
supplier, bar-coded data, RFID, self-checkout, pay
via facial recognition
Transportation Automatic toll booths, satellite-directed navigation
systems, Wi-Fi in automobiles
Copyright © 2020 Pearson Education Ltd. All Rights Reserved.
Technology in Services (3 of 3)
Table 7.4 Examples of Technology’s Impact on Services
SERVICE INDUSTRY EXAMPLE
Health care Online patient-monitoring systems, online medical
information systems, robotic surgery, artificial
intelligence for medical diagnoses
Airlines Ticketless travel, scheduling, Internet purchases,
boarding passes downloaded as two-dimensional
bar codes on smart phones
Copyright © 2020 Pearson Education Ltd. All Rights Reserved.
Process Redesign
•The fundamental rethinking of business processes to bring
about dramatic improvements in performance
•Relies on reevaluating the purpose of the process and
questioning both the purpose and the underlying
assumptions
•Requires reexamination of the basic process and its
objectives
•Focuses on activities that cross functional lines
•Any process is a candidate for redesign
Copyright © 2020 Pearson Education Ltd. All Rights Reserved.
Copyright
This work is protected by United States copyright laws and is
provided solely for the use of instructors in teaching their courses
and assessing student learning. Dissemination or sale of any part of
this work (including on the World Wide Web) will destroy the integrity
of the work and is not permitted. The work and materials from it
should never be made available to students except by instructors
using the accompanying text in their classes. All recipients of this
work are expected to abide by these restrictions and to honor the
intended pedagogical purposes and the needs of other instructors
who rely on these materials.
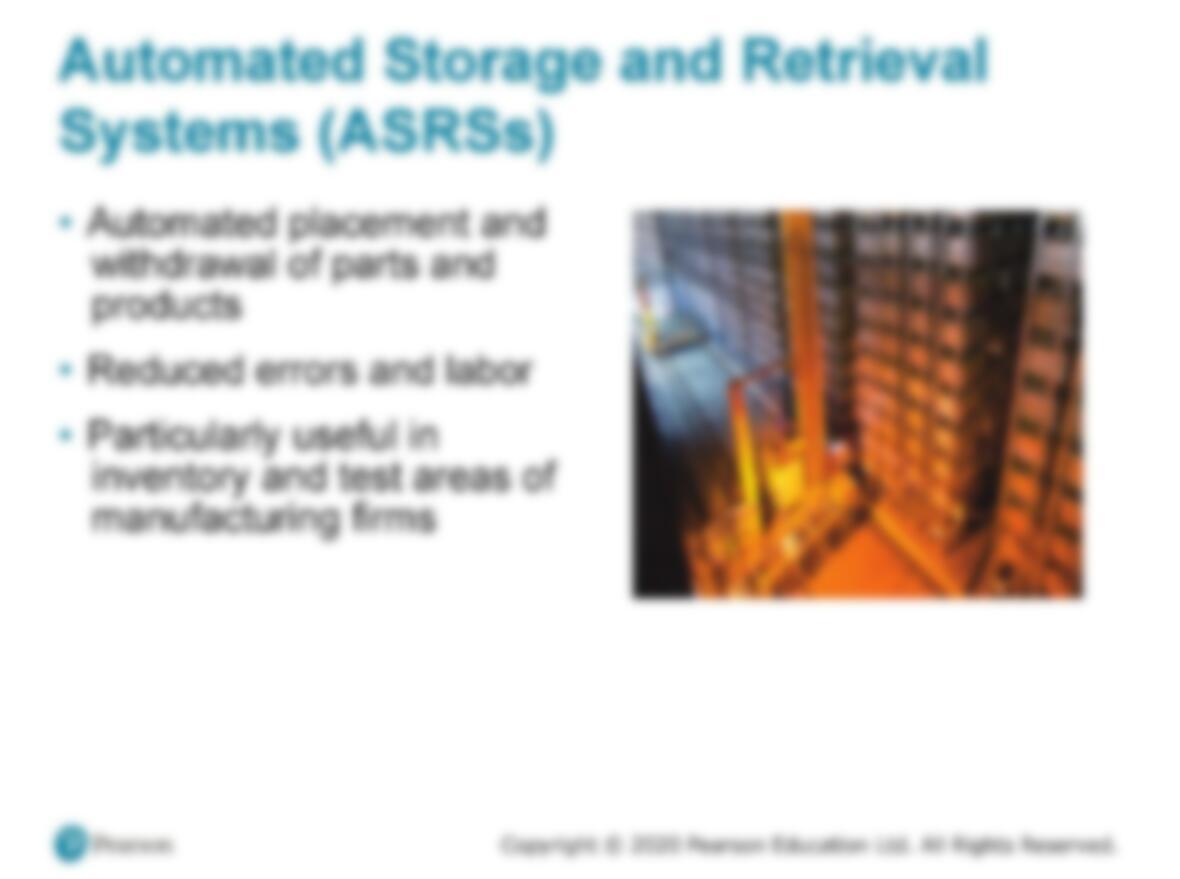
Copyright © 2020 Pearson Education Ltd. All Rights Reserved.
Process Control
•Real-time monitoring and
control of processes
–Sensors collect data
–Devices read data on
periodic basis
–Measurements
translated into digital
signals, then sent to a
computer
–Computer programs
analyze the data
–Resulting output may
take numerous forms
Vision Systems
•Particular aid to inspection
•Consistently accurate
•Never bored
•Modest cost
•Superior to individuals performing the same tasks
Copyright © 2020 Pearson Education Ltd. All Rights Reserved.
Automated Guided Vehicle (AG Vs)
•Electronically guided and controlled carts
•Used for movement of products and/or individuals
Copyright © 2020 Pearson Education Ltd. All Rights Reserved.
Flexible Manufacturing Systems (F
MSs)
•Computer controls both the workstation and the material
handling equipment
•Enhanced flexibility and reduced waste
•Can economically produce low volume but high variety
•Reduced changeover time and increased utilization
•Stringent communication requirement between
components
Copyright © 2020 Pearson Education Ltd. All Rights Reserved.
Computer-Integrated Manufacturing
(CI M) (1 of 2)
•Extend flexible manufacturing
–Backward to engineering and inventory control
–Forward into warehousing and shipping
–Can also include financial and customer service areas
–Reducing the distinction between low-volume/high-
variety, and high-volume/low-variety production
Copyright © 2020 Pearson Education Ltd. All Rights Reserved.
Computer-Integrated Manufacturing
(CI M) (2 of 2)
Figure 7.9
Copyright © 2020 Pearson Education Ltd. All Rights Reserved.
Technology in Services (1 of 3)
Table 7.4 Examples of Technology’s Impact on Services
SERVICE INDUSTRY EXAMPLE
Financial Services
Debit cards, electronic funds transfer, ATMs,
Internet stock trading, online banking via cell
phone, Apple pay
Education
Online newspapers and journals, interactive
assignments via WebCT, Blackboard, and
smartphones
Utilities and government
Automated one-person garbage trucks, optical mail
scanners, flood-warning systems, meters that allow
homeowners to control energy usage and costs
Restaurants and foods
Wireless orders from waiters to kitchen, robot
butchering, transponders on cars that track sales at
drive-throughs
Copyright © 2020 Pearson Education Ltd. All Rights Reserved.
Technology in Services (2 of 3)
Table 7.4 Examples of Technology’s Impact on Services
SERVICE INDUSTRY EXAMPLE
Communications Interactive TV, e-books via Kindle, speech
recognition
Hotels Electronic check-in/check-out, electronic key/lock
systems, mobile Web bookings
Wholesale/retail trade Point-of-sale (POS) terminals, e-commerce,
electronic communication between store and
supplier, bar-coded data, RFID, self-checkout, pay
via facial recognition
Transportation Automatic toll booths, satellite-directed navigation
systems, Wi-Fi in automobiles
Copyright © 2020 Pearson Education Ltd. All Rights Reserved.
Technology in Services (3 of 3)
Table 7.4 Examples of Technology’s Impact on Services
SERVICE INDUSTRY EXAMPLE
Health care Online patient-monitoring systems, online medical
information systems, robotic surgery, artificial
intelligence for medical diagnoses
Airlines Ticketless travel, scheduling, Internet purchases,
boarding passes downloaded as two-dimensional
bar codes on smart phones
Copyright © 2020 Pearson Education Ltd. All Rights Reserved.
Process Redesign
•The fundamental rethinking of business processes to bring
about dramatic improvements in performance
•Relies on reevaluating the purpose of the process and
questioning both the purpose and the underlying
assumptions
•Requires reexamination of the basic process and its
objectives
•Focuses on activities that cross functional lines
•Any process is a candidate for redesign
Copyright © 2020 Pearson Education Ltd. All Rights Reserved.
Copyright
This work is protected by United States copyright laws and is
provided solely for the use of instructors in teaching their courses
and assessing student learning. Dissemination or sale of any part of
this work (including on the World Wide Web) will destroy the integrity
of the work and is not permitted. The work and materials from it
should never be made available to students except by instructors
using the accompanying text in their classes. All recipients of this
work are expected to abide by these restrictions and to honor the
intended pedagogical purposes and the needs of other instructors
who rely on these materials.
Copyright © 2020 Pearson Education Ltd. All Rights Reserved.
Process Control
•Real-time monitoring and
control of processes
–Sensors collect data
–Devices read data on
periodic basis
–Measurements
translated into digital
signals, then sent to a
computer
–Computer programs
analyze the data
–Resulting output may
take numerous forms
Copyright © 2020 Pearson Education Ltd. All Rights Reserved.
Vision Systems
•Particular aid to inspection
•Consistently accurate
•Never bored
•Modest cost
•Superior to individuals performing the same tasks
Robots
•Perform monotonous or
dangerous tasks
•Perform tasks requiring
significant strength or
endurance
•Generally enhanced
consistency and accuracy
Copyright © 2020 Pearson Education Ltd. All Rights Reserved.
Flexible Manufacturing Systems (F
MSs)
•Computer controls both the workstation and the material
handling equipment
•Enhanced flexibility and reduced waste
•Can economically produce low volume but high variety
•Reduced changeover time and increased utilization
•Stringent communication requirement between
components
Copyright © 2020 Pearson Education Ltd. All Rights Reserved.
Computer-Integrated Manufacturing
(CI M) (1 of 2)
•Extend flexible manufacturing
–Backward to engineering and inventory control
–Forward into warehousing and shipping
–Can also include financial and customer service areas
–Reducing the distinction between low-volume/high-
variety, and high-volume/low-variety production
Copyright © 2020 Pearson Education Ltd. All Rights Reserved.
Computer-Integrated Manufacturing
(CI M) (2 of 2)
Figure 7.9
Copyright © 2020 Pearson Education Ltd. All Rights Reserved.
Technology in Services (1 of 3)
Table 7.4 Examples of Technology’s Impact on Services
SERVICE INDUSTRY EXAMPLE
Financial Services
Debit cards, electronic funds transfer, ATMs,
Internet stock trading, online banking via cell
phone, Apple pay
Education
Online newspapers and journals, interactive
assignments via WebCT, Blackboard, and
smartphones
Utilities and government
Automated one-person garbage trucks, optical mail
scanners, flood-warning systems, meters that allow
homeowners to control energy usage and costs
Restaurants and foods
Wireless orders from waiters to kitchen, robot
butchering, transponders on cars that track sales at
drive-throughs
Copyright © 2020 Pearson Education Ltd. All Rights Reserved.
Technology in Services (2 of 3)
Table 7.4 Examples of Technology’s Impact on Services
SERVICE INDUSTRY EXAMPLE
Communications Interactive TV, e-books via Kindle, speech
recognition
Hotels Electronic check-in/check-out, electronic key/lock
systems, mobile Web bookings
Wholesale/retail trade Point-of-sale (POS) terminals, e-commerce,
electronic communication between store and
supplier, bar-coded data, RFID, self-checkout, pay
via facial recognition
Transportation Automatic toll booths, satellite-directed navigation
systems, Wi-Fi in automobiles
Copyright © 2020 Pearson Education Ltd. All Rights Reserved.
Technology in Services (3 of 3)
Table 7.4 Examples of Technology’s Impact on Services
SERVICE INDUSTRY EXAMPLE
Health care Online patient-monitoring systems, online medical
information systems, robotic surgery, artificial
intelligence for medical diagnoses
Airlines Ticketless travel, scheduling, Internet purchases,
boarding passes downloaded as two-dimensional
bar codes on smart phones
Copyright © 2020 Pearson Education Ltd. All Rights Reserved.
Process Redesign
•The fundamental rethinking of business processes to bring
about dramatic improvements in performance
•Relies on reevaluating the purpose of the process and
questioning both the purpose and the underlying
assumptions
•Requires reexamination of the basic process and its
objectives
•Focuses on activities that cross functional lines
•Any process is a candidate for redesign
Copyright © 2020 Pearson Education Ltd. All Rights Reserved.
Copyright
This work is protected by United States copyright laws and is
provided solely for the use of instructors in teaching their courses
and assessing student learning. Dissemination or sale of any part of
this work (including on the World Wide Web) will destroy the integrity
of the work and is not permitted. The work and materials from it
should never be made available to students except by instructors
using the accompanying text in their classes. All recipients of this
work are expected to abide by these restrictions and to honor the
intended pedagogical purposes and the needs of other instructors
who rely on these materials.
Copyright © 2020 Pearson Education Ltd. All Rights Reserved.
Process Control
•Real-time monitoring and
control of processes
–Sensors collect data
–Devices read data on
periodic basis
–Measurements
translated into digital
signals, then sent to a
computer
–Computer programs
analyze the data
–Resulting output may
take numerous forms
Copyright © 2020 Pearson Education Ltd. All Rights Reserved.
Vision Systems
•Particular aid to inspection
•Consistently accurate
•Never bored
•Modest cost
•Superior to individuals performing the same tasks
Copyright © 2020 Pearson Education Ltd. All Rights Reserved.
Robots
•Perform monotonous or
dangerous tasks
•Perform tasks requiring
significant strength or
endurance
•Generally enhanced
consistency and accuracy
Automated Storage and Retrieval
Systems (AS RSs)
•Automated placement and
withdrawal of parts and
products
•Reduced errors and labor
•Particularly useful in
inventory and test areas of
manufacturing firms
Copyright © 2020 Pearson Education Ltd. All Rights Reserved.
Computer-Integrated Manufacturing
(CI M) (1 of 2)
•Extend flexible manufacturing
–Backward to engineering and inventory control
–Forward into warehousing and shipping
–Can also include financial and customer service areas
–Reducing the distinction between low-volume/high-
variety, and high-volume/low-variety production
Copyright © 2020 Pearson Education Ltd. All Rights Reserved.
Computer-Integrated Manufacturing
(CI M) (2 of 2)
Figure 7.9
Copyright © 2020 Pearson Education Ltd. All Rights Reserved.
Technology in Services (1 of 3)
Table 7.4 Examples of Technology’s Impact on Services
SERVICE INDUSTRY EXAMPLE
Financial Services
Debit cards, electronic funds transfer, ATMs,
Internet stock trading, online banking via cell
phone, Apple pay
Education
Online newspapers and journals, interactive
assignments via WebCT, Blackboard, and
smartphones
Utilities and government
Automated one-person garbage trucks, optical mail
scanners, flood-warning systems, meters that allow
homeowners to control energy usage and costs
Restaurants and foods
Wireless orders from waiters to kitchen, robot
butchering, transponders on cars that track sales at
drive-throughs
Copyright © 2020 Pearson Education Ltd. All Rights Reserved.
Technology in Services (2 of 3)
Table 7.4 Examples of Technology’s Impact on Services
SERVICE INDUSTRY EXAMPLE
Communications Interactive TV, e-books via Kindle, speech
recognition
Hotels Electronic check-in/check-out, electronic key/lock
systems, mobile Web bookings
Wholesale/retail trade Point-of-sale (POS) terminals, e-commerce,
electronic communication between store and
supplier, bar-coded data, RFID, self-checkout, pay
via facial recognition
Transportation Automatic toll booths, satellite-directed navigation
systems, Wi-Fi in automobiles
Copyright © 2020 Pearson Education Ltd. All Rights Reserved.
Technology in Services (3 of 3)
Table 7.4 Examples of Technology’s Impact on Services
SERVICE INDUSTRY EXAMPLE
Health care Online patient-monitoring systems, online medical
information systems, robotic surgery, artificial
intelligence for medical diagnoses
Airlines Ticketless travel, scheduling, Internet purchases,
boarding passes downloaded as two-dimensional
bar codes on smart phones
Copyright © 2020 Pearson Education Ltd. All Rights Reserved.
Process Redesign
•The fundamental rethinking of business processes to bring
about dramatic improvements in performance
•Relies on reevaluating the purpose of the process and
questioning both the purpose and the underlying
assumptions
•Requires reexamination of the basic process and its
objectives
•Focuses on activities that cross functional lines
•Any process is a candidate for redesign
Copyright © 2020 Pearson Education Ltd. All Rights Reserved.
Copyright
This work is protected by United States copyright laws and is
provided solely for the use of instructors in teaching their courses
and assessing student learning. Dissemination or sale of any part of
this work (including on the World Wide Web) will destroy the integrity
of the work and is not permitted. The work and materials from it
should never be made available to students except by instructors
using the accompanying text in their classes. All recipients of this
work are expected to abide by these restrictions and to honor the
intended pedagogical purposes and the needs of other instructors
who rely on these materials.
Copyright © 2020 Pearson Education Ltd. All Rights Reserved.
Process Control
•Real-time monitoring and
control of processes
–Sensors collect data
–Devices read data on
periodic basis
–Measurements
translated into digital
signals, then sent to a
computer
–Computer programs
analyze the data
–Resulting output may
take numerous forms
Copyright © 2020 Pearson Education Ltd. All Rights Reserved.
Vision Systems
•Particular aid to inspection
•Consistently accurate
•Never bored
•Modest cost
•Superior to individuals performing the same tasks
Copyright © 2020 Pearson Education Ltd. All Rights Reserved.
Robots
•Perform monotonous or
dangerous tasks
•Perform tasks requiring
significant strength or
endurance
•Generally enhanced
consistency and accuracy
Copyright © 2020 Pearson Education Ltd. All Rights Reserved.
Automated Storage and Retrieval
Systems (AS RSs)
•Automated placement and
withdrawal of parts and
products
•Reduced errors and labor
•Particularly useful in
inventory and test areas of
manufacturing firms
Automated Guided Vehicle (AG Vs)
•Electronically guided and controlled carts
•Used for movement of products and/or individuals
Copyright © 2020 Pearson Education Ltd. All Rights Reserved.
Computer-Integrated Manufacturing
(CI M) (2 of 2)
Figure 7.9
Copyright © 2020 Pearson Education Ltd. All Rights Reserved.
Technology in Services (1 of 3)
Table 7.4 Examples of Technology’s Impact on Services
SERVICE INDUSTRY EXAMPLE
Financial Services
Debit cards, electronic funds transfer, ATMs,
Internet stock trading, online banking via cell
phone, Apple pay
Education
Online newspapers and journals, interactive
assignments via WebCT, Blackboard, and
smartphones
Utilities and government
Automated one-person garbage trucks, optical mail
scanners, flood-warning systems, meters that allow
homeowners to control energy usage and costs
Restaurants and foods
Wireless orders from waiters to kitchen, robot
butchering, transponders on cars that track sales at
drive-throughs
Copyright © 2020 Pearson Education Ltd. All Rights Reserved.
Technology in Services (2 of 3)
Table 7.4 Examples of Technology’s Impact on Services
SERVICE INDUSTRY EXAMPLE
Communications Interactive TV, e-books via Kindle, speech
recognition
Hotels Electronic check-in/check-out, electronic key/lock
systems, mobile Web bookings
Wholesale/retail trade Point-of-sale (POS) terminals, e-commerce,
electronic communication between store and
supplier, bar-coded data, RFID, self-checkout, pay
via facial recognition
Transportation Automatic toll booths, satellite-directed navigation
systems, Wi-Fi in automobiles
Copyright © 2020 Pearson Education Ltd. All Rights Reserved.
Technology in Services (3 of 3)
Table 7.4 Examples of Technology’s Impact on Services
SERVICE INDUSTRY EXAMPLE
Health care Online patient-monitoring systems, online medical
information systems, robotic surgery, artificial
intelligence for medical diagnoses
Airlines Ticketless travel, scheduling, Internet purchases,
boarding passes downloaded as two-dimensional
bar codes on smart phones
Copyright © 2020 Pearson Education Ltd. All Rights Reserved.
Process Redesign
•The fundamental rethinking of business processes to bring
about dramatic improvements in performance
•Relies on reevaluating the purpose of the process and
questioning both the purpose and the underlying
assumptions
•Requires reexamination of the basic process and its
objectives
•Focuses on activities that cross functional lines
•Any process is a candidate for redesign
Copyright © 2020 Pearson Education Ltd. All Rights Reserved.
Copyright
This work is protected by United States copyright laws and is
provided solely for the use of instructors in teaching their courses
and assessing student learning. Dissemination or sale of any part of
this work (including on the World Wide Web) will destroy the integrity
of the work and is not permitted. The work and materials from it
should never be made available to students except by instructors
using the accompanying text in their classes. All recipients of this
work are expected to abide by these restrictions and to honor the
intended pedagogical purposes and the needs of other instructors
who rely on these materials.
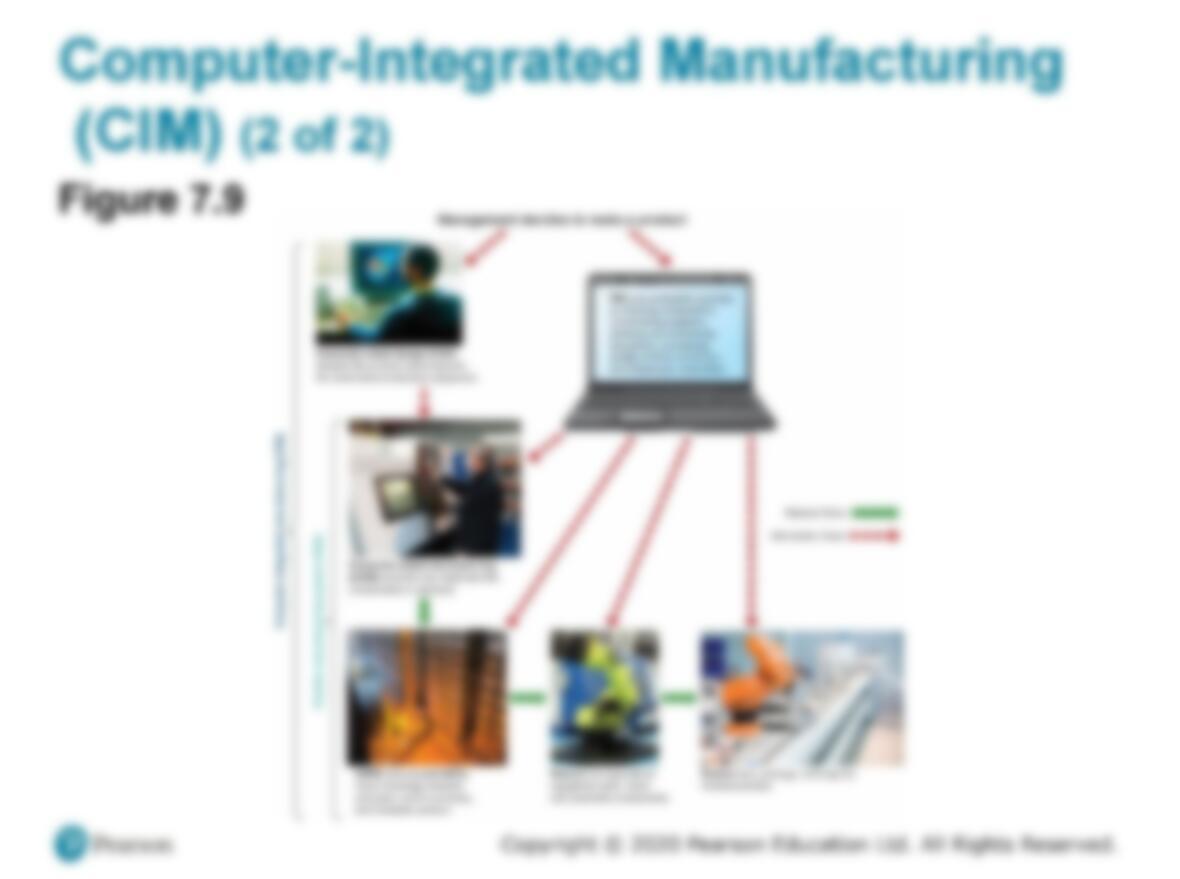
Copyright © 2020 Pearson Education Ltd. All Rights Reserved.
Process Control
•Real-time monitoring and
control of processes
–Sensors collect data
–Devices read data on
periodic basis
–Measurements
translated into digital
signals, then sent to a
computer
–Computer programs
analyze the data
–Resulting output may
take numerous forms
Copyright © 2020 Pearson Education Ltd. All Rights Reserved.
Vision Systems
•Particular aid to inspection
•Consistently accurate
•Never bored
•Modest cost
•Superior to individuals performing the same tasks
Copyright © 2020 Pearson Education Ltd. All Rights Reserved.
Robots
•Perform monotonous or
dangerous tasks
•Perform tasks requiring
significant strength or
endurance
•Generally enhanced
consistency and accuracy
Copyright © 2020 Pearson Education Ltd. All Rights Reserved.
Automated Storage and Retrieval
Systems (AS RSs)
•Automated placement and
withdrawal of parts and
products
•Reduced errors and labor
•Particularly useful in
inventory and test areas of
manufacturing firms
Copyright © 2020 Pearson Education Ltd. All Rights Reserved.
Automated Guided Vehicle (AG Vs)
•Electronically guided and controlled carts
•Used for movement of products and/or individuals
Flexible Manufacturing Systems (F
MSs)
•Computer controls both the workstation and the material
handling equipment
•Enhanced flexibility and reduced waste
•Can economically produce low volume but high variety
•Reduced changeover time and increased utilization
•Stringent communication requirement between
components
Copyright © 2020 Pearson Education Ltd. All Rights Reserved.
Technology in Services (1 of 3)
Table 7.4 Examples of Technology’s Impact on Services
SERVICE INDUSTRY EXAMPLE
Financial Services
Debit cards, electronic funds transfer, ATMs,
Internet stock trading, online banking via cell
phone, Apple pay
Education
Online newspapers and journals, interactive
assignments via WebCT, Blackboard, and
smartphones
Utilities and government
Automated one-person garbage trucks, optical mail
scanners, flood-warning systems, meters that allow
homeowners to control energy usage and costs
Restaurants and foods
Wireless orders from waiters to kitchen, robot
butchering, transponders on cars that track sales at
drive-throughs
Copyright © 2020 Pearson Education Ltd. All Rights Reserved.
Technology in Services (2 of 3)
Table 7.4 Examples of Technology’s Impact on Services
SERVICE INDUSTRY EXAMPLE
Communications Interactive TV, e-books via Kindle, speech
recognition
Hotels Electronic check-in/check-out, electronic key/lock
systems, mobile Web bookings
Wholesale/retail trade Point-of-sale (POS) terminals, e-commerce,
electronic communication between store and
supplier, bar-coded data, RFID, self-checkout, pay
via facial recognition
Transportation Automatic toll booths, satellite-directed navigation
systems, Wi-Fi in automobiles
Copyright © 2020 Pearson Education Ltd. All Rights Reserved.
Technology in Services (3 of 3)
Table 7.4 Examples of Technology’s Impact on Services
SERVICE INDUSTRY EXAMPLE
Health care Online patient-monitoring systems, online medical
information systems, robotic surgery, artificial
intelligence for medical diagnoses
Airlines Ticketless travel, scheduling, Internet purchases,
boarding passes downloaded as two-dimensional
bar codes on smart phones
Copyright © 2020 Pearson Education Ltd. All Rights Reserved.
Process Redesign
•The fundamental rethinking of business processes to bring
about dramatic improvements in performance
•Relies on reevaluating the purpose of the process and
questioning both the purpose and the underlying
assumptions
•Requires reexamination of the basic process and its
objectives
•Focuses on activities that cross functional lines
•Any process is a candidate for redesign
Copyright © 2020 Pearson Education Ltd. All Rights Reserved.
Copyright
This work is protected by United States copyright laws and is
provided solely for the use of instructors in teaching their courses
and assessing student learning. Dissemination or sale of any part of
this work (including on the World Wide Web) will destroy the integrity
of the work and is not permitted. The work and materials from it
should never be made available to students except by instructors
using the accompanying text in their classes. All recipients of this
work are expected to abide by these restrictions and to honor the
intended pedagogical purposes and the needs of other instructors
who rely on these materials.
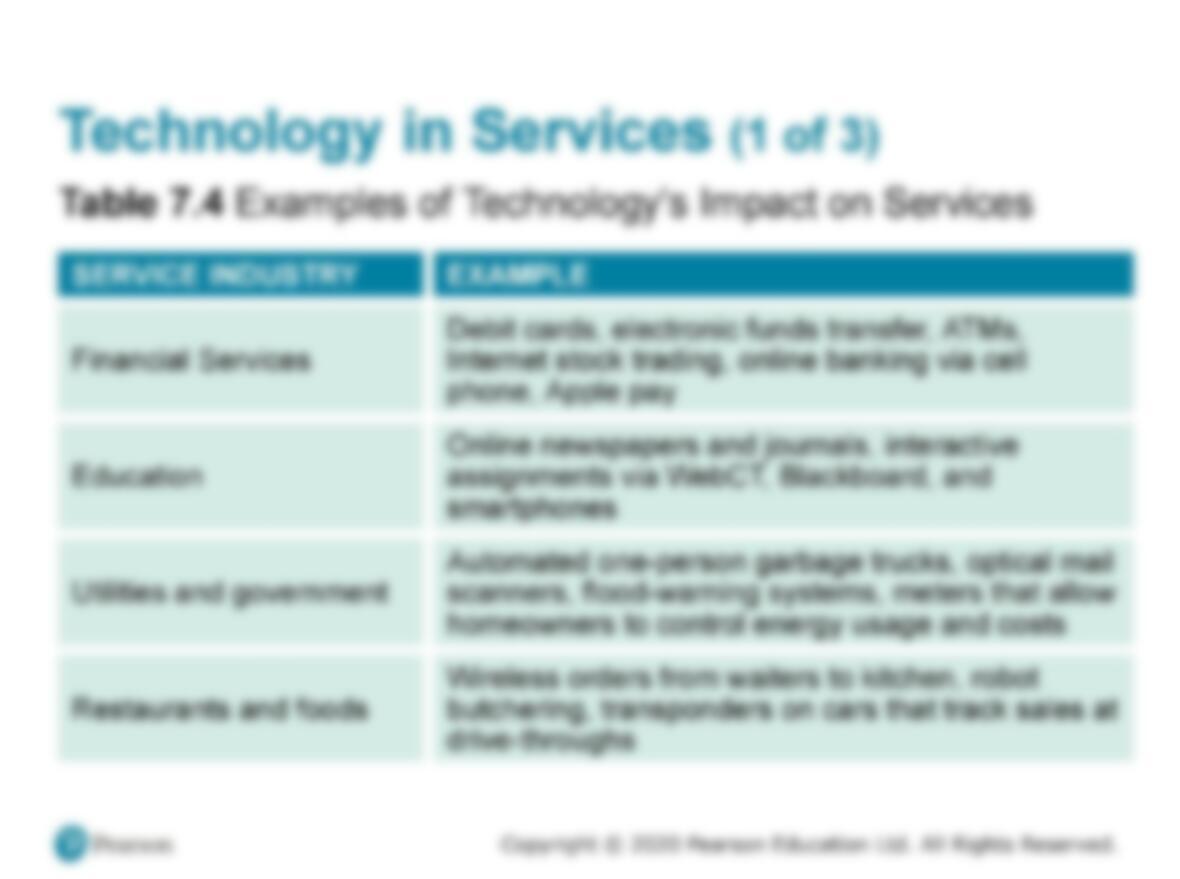
Copyright © 2020 Pearson Education Ltd. All Rights Reserved.
Process Control
•Real-time monitoring and
control of processes
–Sensors collect data
–Devices read data on
periodic basis
–Measurements
translated into digital
signals, then sent to a
computer
–Computer programs
analyze the data
–Resulting output may
take numerous forms
Copyright © 2020 Pearson Education Ltd. All Rights Reserved.
Vision Systems
•Particular aid to inspection
•Consistently accurate
•Never bored
•Modest cost
•Superior to individuals performing the same tasks
Copyright © 2020 Pearson Education Ltd. All Rights Reserved.
Robots
•Perform monotonous or
dangerous tasks
•Perform tasks requiring
significant strength or
endurance
•Generally enhanced
consistency and accuracy
Copyright © 2020 Pearson Education Ltd. All Rights Reserved.
Automated Storage and Retrieval
Systems (AS RSs)
•Automated placement and
withdrawal of parts and
products
•Reduced errors and labor
•Particularly useful in
inventory and test areas of
manufacturing firms
Copyright © 2020 Pearson Education Ltd. All Rights Reserved.
Automated Guided Vehicle (AG Vs)
•Electronically guided and controlled carts
•Used for movement of products and/or individuals
Copyright © 2020 Pearson Education Ltd. All Rights Reserved.
Flexible Manufacturing Systems (F
MSs)
•Computer controls both the workstation and the material
handling equipment
•Enhanced flexibility and reduced waste
•Can economically produce low volume but high variety
•Reduced changeover time and increased utilization
•Stringent communication requirement between
components
Computer-Integrated Manufacturing
(CI M) (1 of 2)
•Extend flexible manufacturing
–Backward to engineering and inventory control
–Forward into warehousing and shipping
–Can also include financial and customer service areas
–Reducing the distinction between low-volume/high-
variety, and high-volume/low-variety production
Copyright © 2020 Pearson Education Ltd. All Rights Reserved.
Technology in Services (2 of 3)
Table 7.4 Examples of Technology’s Impact on Services
SERVICE INDUSTRY EXAMPLE
Communications Interactive TV, e-books via Kindle, speech
recognition
Hotels Electronic check-in/check-out, electronic key/lock
systems, mobile Web bookings
Wholesale/retail trade Point-of-sale (POS) terminals, e-commerce,
electronic communication between store and
supplier, bar-coded data, RFID, self-checkout, pay
via facial recognition
Transportation Automatic toll booths, satellite-directed navigation
systems, Wi-Fi in automobiles
Copyright © 2020 Pearson Education Ltd. All Rights Reserved.
Technology in Services (3 of 3)
Table 7.4 Examples of Technology’s Impact on Services
SERVICE INDUSTRY EXAMPLE
Health care Online patient-monitoring systems, online medical
information systems, robotic surgery, artificial
intelligence for medical diagnoses
Airlines Ticketless travel, scheduling, Internet purchases,
boarding passes downloaded as two-dimensional
bar codes on smart phones
Copyright © 2020 Pearson Education Ltd. All Rights Reserved.
Process Redesign
•The fundamental rethinking of business processes to bring
about dramatic improvements in performance
•Relies on reevaluating the purpose of the process and
questioning both the purpose and the underlying
assumptions
•Requires reexamination of the basic process and its
objectives
•Focuses on activities that cross functional lines
•Any process is a candidate for redesign
Copyright © 2020 Pearson Education Ltd. All Rights Reserved.
Copyright
This work is protected by United States copyright laws and is
provided solely for the use of instructors in teaching their courses
and assessing student learning. Dissemination or sale of any part of
this work (including on the World Wide Web) will destroy the integrity
of the work and is not permitted. The work and materials from it
should never be made available to students except by instructors
using the accompanying text in their classes. All recipients of this
work are expected to abide by these restrictions and to honor the
intended pedagogical purposes and the needs of other instructors
who rely on these materials.
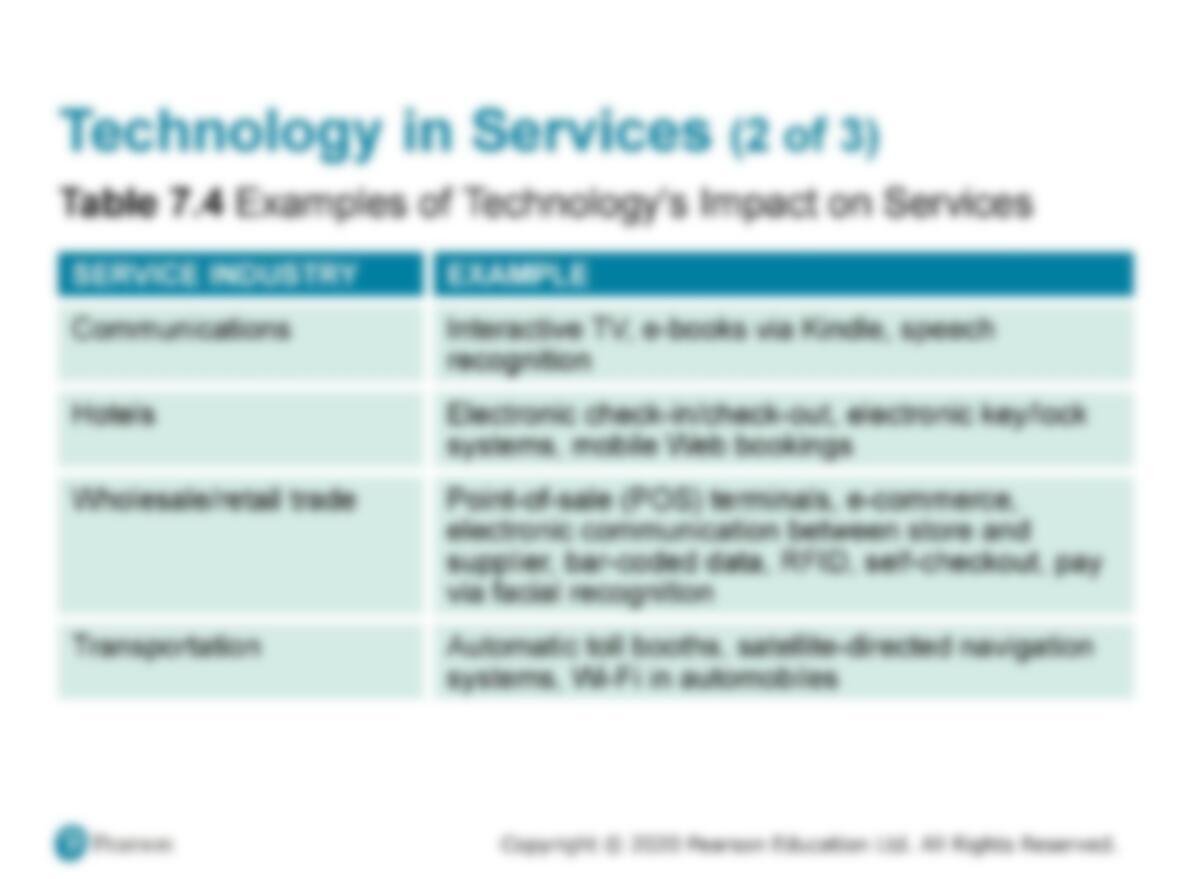
Copyright © 2020 Pearson Education Ltd. All Rights Reserved.
Process Control
•Real-time monitoring and
control of processes
–Sensors collect data
–Devices read data on
periodic basis
–Measurements
translated into digital
signals, then sent to a
computer
–Computer programs
analyze the data
–Resulting output may
take numerous forms
Copyright © 2020 Pearson Education Ltd. All Rights Reserved.
Vision Systems
•Particular aid to inspection
•Consistently accurate
•Never bored
•Modest cost
•Superior to individuals performing the same tasks
Copyright © 2020 Pearson Education Ltd. All Rights Reserved.
Robots
•Perform monotonous or
dangerous tasks
•Perform tasks requiring
significant strength or
endurance
•Generally enhanced
consistency and accuracy
Copyright © 2020 Pearson Education Ltd. All Rights Reserved.
Automated Storage and Retrieval
Systems (AS RSs)
•Automated placement and
withdrawal of parts and
products
•Reduced errors and labor
•Particularly useful in
inventory and test areas of
manufacturing firms
Copyright © 2020 Pearson Education Ltd. All Rights Reserved.
Automated Guided Vehicle (AG Vs)
•Electronically guided and controlled carts
•Used for movement of products and/or individuals
Copyright © 2020 Pearson Education Ltd. All Rights Reserved.
Flexible Manufacturing Systems (F
MSs)
•Computer controls both the workstation and the material
handling equipment
•Enhanced flexibility and reduced waste
•Can economically produce low volume but high variety
•Reduced changeover time and increased utilization
•Stringent communication requirement between
components
Copyright © 2020 Pearson Education Ltd. All Rights Reserved.
Computer-Integrated Manufacturing
(CI M) (1 of 2)
•Extend flexible manufacturing
–Backward to engineering and inventory control
–Forward into warehousing and shipping
–Can also include financial and customer service areas
–Reducing the distinction between low-volume/high-
variety, and high-volume/low-variety production
Computer-Integrated Manufacturing
(CI M) (2 of 2)
Figure 7.9
Copyright © 2020 Pearson Education Ltd. All Rights Reserved.
Technology in Services (3 of 3)
Table 7.4 Examples of Technology’s Impact on Services
SERVICE INDUSTRY EXAMPLE
Health care Online patient-monitoring systems, online medical
information systems, robotic surgery, artificial
intelligence for medical diagnoses
Airlines Ticketless travel, scheduling, Internet purchases,
boarding passes downloaded as two-dimensional
bar codes on smart phones
Copyright © 2020 Pearson Education Ltd. All Rights Reserved.
Process Redesign
•The fundamental rethinking of business processes to bring
about dramatic improvements in performance
•Relies on reevaluating the purpose of the process and
questioning both the purpose and the underlying
assumptions
•Requires reexamination of the basic process and its
objectives
•Focuses on activities that cross functional lines
•Any process is a candidate for redesign
Copyright © 2020 Pearson Education Ltd. All Rights Reserved.
Copyright
This work is protected by United States copyright laws and is
provided solely for the use of instructors in teaching their courses
and assessing student learning. Dissemination or sale of any part of
this work (including on the World Wide Web) will destroy the integrity
of the work and is not permitted. The work and materials from it
should never be made available to students except by instructors
using the accompanying text in their classes. All recipients of this
work are expected to abide by these restrictions and to honor the
intended pedagogical purposes and the needs of other instructors
who rely on these materials.
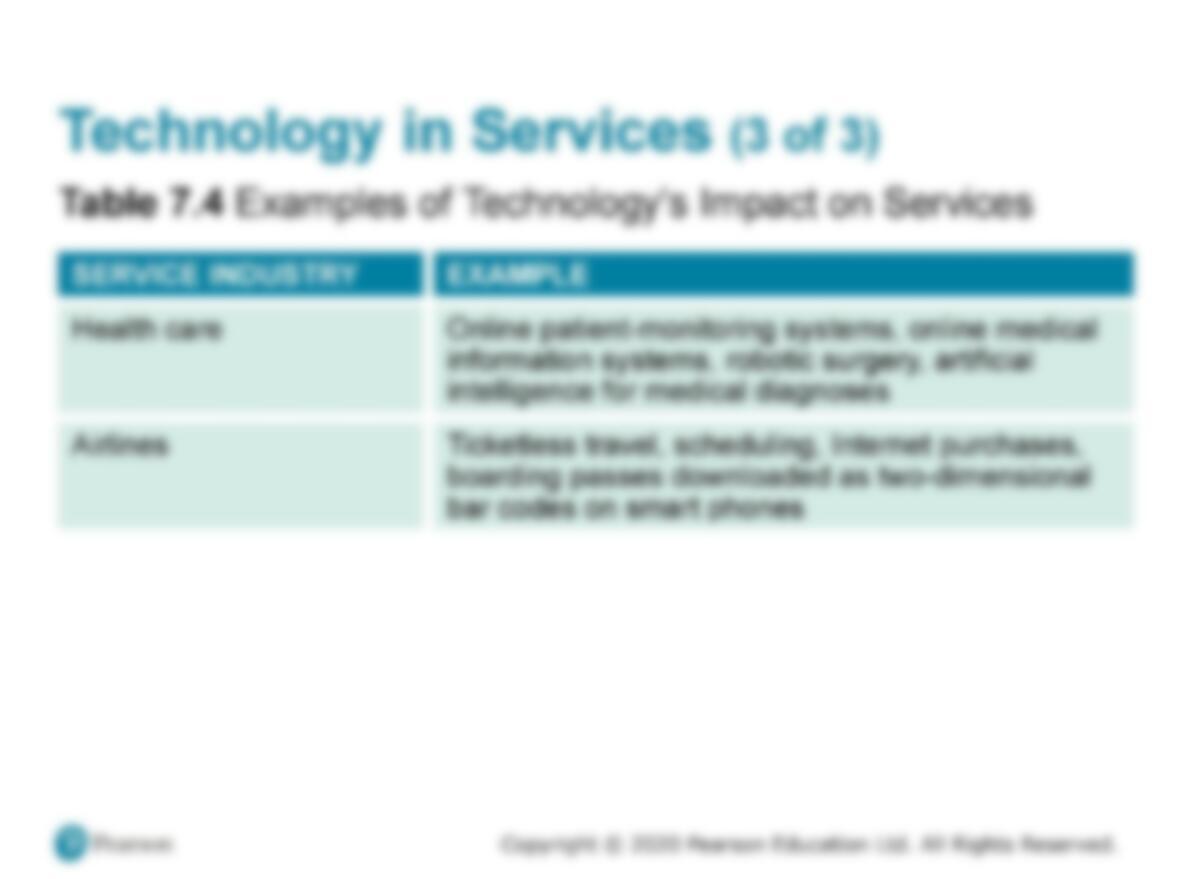
Copyright © 2020 Pearson Education Ltd. All Rights Reserved.
Process Control
•Real-time monitoring and
control of processes
–Sensors collect data
–Devices read data on
periodic basis
–Measurements
translated into digital
signals, then sent to a
computer
–Computer programs
analyze the data
–Resulting output may
take numerous forms
Copyright © 2020 Pearson Education Ltd. All Rights Reserved.
Vision Systems
•Particular aid to inspection
•Consistently accurate
•Never bored
•Modest cost
•Superior to individuals performing the same tasks
Copyright © 2020 Pearson Education Ltd. All Rights Reserved.
Robots
•Perform monotonous or
dangerous tasks
•Perform tasks requiring
significant strength or
endurance
•Generally enhanced
consistency and accuracy
Copyright © 2020 Pearson Education Ltd. All Rights Reserved.
Automated Storage and Retrieval
Systems (AS RSs)
•Automated placement and
withdrawal of parts and
products
•Reduced errors and labor
•Particularly useful in
inventory and test areas of
manufacturing firms
Copyright © 2020 Pearson Education Ltd. All Rights Reserved.
Automated Guided Vehicle (AG Vs)
•Electronically guided and controlled carts
•Used for movement of products and/or individuals
Copyright © 2020 Pearson Education Ltd. All Rights Reserved.
Flexible Manufacturing Systems (F
MSs)
•Computer controls both the workstation and the material
handling equipment
•Enhanced flexibility and reduced waste
•Can economically produce low volume but high variety
•Reduced changeover time and increased utilization
•Stringent communication requirement between
components
Copyright © 2020 Pearson Education Ltd. All Rights Reserved.
Computer-Integrated Manufacturing
(CI M) (1 of 2)
•Extend flexible manufacturing
–Backward to engineering and inventory control
–Forward into warehousing and shipping
–Can also include financial and customer service areas
–Reducing the distinction between low-volume/high-
variety, and high-volume/low-variety production
Copyright © 2020 Pearson Education Ltd. All Rights Reserved.
Computer-Integrated Manufacturing
(CI M) (2 of 2)
Figure 7.9
Technology in Services (1 of 3)
Table 7.4 Examples of Technology’s Impact on Services
SERVICE INDUSTRY EXAMPLE
Financial Services
Debit cards, electronic funds transfer, ATMs,
Internet stock trading, online banking via cell
phone, Apple pay
Education
Online newspapers and journals, interactive
assignments via WebCT, Blackboard, and
smartphones
Utilities and government
Automated one-person garbage trucks, optical mail
scanners, flood-warning systems, meters that allow
homeowners to control energy usage and costs
Copyright © 2020 Pearson Education Ltd. All Rights Reserved.
Process Redesign
•The fundamental rethinking of business processes to bring
about dramatic improvements in performance
•Relies on reevaluating the purpose of the process and
questioning both the purpose and the underlying
assumptions
•Requires reexamination of the basic process and its
objectives
•Focuses on activities that cross functional lines
•Any process is a candidate for redesign
Copyright © 2020 Pearson Education Ltd. All Rights Reserved.
Copyright
This work is protected by United States copyright laws and is
provided solely for the use of instructors in teaching their courses
and assessing student learning. Dissemination or sale of any part of
this work (including on the World Wide Web) will destroy the integrity
of the work and is not permitted. The work and materials from it
should never be made available to students except by instructors
using the accompanying text in their classes. All recipients of this
work are expected to abide by these restrictions and to honor the
intended pedagogical purposes and the needs of other instructors
who rely on these materials.
Copyright © 2020 Pearson Education Ltd. All Rights Reserved.
Process Control
•Real-time monitoring and
control of processes
–Sensors collect data
–Devices read data on
periodic basis
–Measurements
translated into digital
signals, then sent to a
computer
–Computer programs
analyze the data
–Resulting output may
take numerous forms
Copyright © 2020 Pearson Education Ltd. All Rights Reserved.
Vision Systems
•Particular aid to inspection
•Consistently accurate
•Never bored
•Modest cost
•Superior to individuals performing the same tasks
Copyright © 2020 Pearson Education Ltd. All Rights Reserved.
Robots
•Perform monotonous or
dangerous tasks
•Perform tasks requiring
significant strength or
endurance
•Generally enhanced
consistency and accuracy
Copyright © 2020 Pearson Education Ltd. All Rights Reserved.
Automated Storage and Retrieval
Systems (AS RSs)
•Automated placement and
withdrawal of parts and
products
•Reduced errors and labor
•Particularly useful in
inventory and test areas of
manufacturing firms
Copyright © 2020 Pearson Education Ltd. All Rights Reserved.
Automated Guided Vehicle (AG Vs)
•Electronically guided and controlled carts
•Used for movement of products and/or individuals
Copyright © 2020 Pearson Education Ltd. All Rights Reserved.
Flexible Manufacturing Systems (F
MSs)
•Computer controls both the workstation and the material
handling equipment
•Enhanced flexibility and reduced waste
•Can economically produce low volume but high variety
•Reduced changeover time and increased utilization
•Stringent communication requirement between
components
Copyright © 2020 Pearson Education Ltd. All Rights Reserved.
Computer-Integrated Manufacturing
(CI M) (1 of 2)
•Extend flexible manufacturing
–Backward to engineering and inventory control
–Forward into warehousing and shipping
–Can also include financial and customer service areas
–Reducing the distinction between low-volume/high-
variety, and high-volume/low-variety production
Copyright © 2020 Pearson Education Ltd. All Rights Reserved.
Computer-Integrated Manufacturing
(CI M) (2 of 2)
Figure 7.9
Copyright © 2020 Pearson Education Ltd. All Rights Reserved.
Technology in Services (1 of 3)
Table 7.4 Examples of Technology’s Impact on Services
SERVICE INDUSTRY EXAMPLE
Financial Services
Debit cards, electronic funds transfer, ATMs,
Internet stock trading, online banking via cell
phone, Apple pay
Education
Online newspapers and journals, interactive
assignments via WebCT, Blackboard, and
smartphones
Utilities and government
Automated one-person garbage trucks, optical mail
scanners, flood-warning systems, meters that allow
homeowners to control energy usage and costs
Restaurants and foods
Wireless orders from waiters to kitchen, robot
butchering, transponders on cars that track sales at
drive-throughs
Technology in Services (2 of 3)
Table 7.4 Examples of Technology’s Impact on Services
SERVICE INDUSTRY EXAMPLE
Communications Interactive TV, e-books via Kindle, speech
recognition
Hotels Electronic check-in/check-out, electronic key/lock
systems, mobile Web bookings
Wholesale/retail trade Point-of-sale (POS) terminals, e-commerce,
electronic communication between store and
supplier, bar-coded data, RFID, self-checkout, pay
via facial recognition
Transportation Automatic toll booths, satellite-directed navigation
Copyright © 2020 Pearson Education Ltd. All Rights Reserved.
Copyright
This work is protected by United States copyright laws and is
provided solely for the use of instructors in teaching their courses
and assessing student learning. Dissemination or sale of any part of
this work (including on the World Wide Web) will destroy the integrity
of the work and is not permitted. The work and materials from it
should never be made available to students except by instructors
using the accompanying text in their classes. All recipients of this
work are expected to abide by these restrictions and to honor the
intended pedagogical purposes and the needs of other instructors
who rely on these materials.

Copyright © 2020 Pearson Education Ltd. All Rights Reserved.
Process Control
•Real-time monitoring and
control of processes
–Sensors collect data
–Devices read data on
periodic basis
–Measurements
translated into digital
signals, then sent to a
computer
–Computer programs
analyze the data
–Resulting output may
take numerous forms
Copyright © 2020 Pearson Education Ltd. All Rights Reserved.
Vision Systems
•Particular aid to inspection
•Consistently accurate
•Never bored
•Modest cost
•Superior to individuals performing the same tasks
Copyright © 2020 Pearson Education Ltd. All Rights Reserved.
Robots
•Perform monotonous or
dangerous tasks
•Perform tasks requiring
significant strength or
endurance
•Generally enhanced
consistency and accuracy
Copyright © 2020 Pearson Education Ltd. All Rights Reserved.
Automated Storage and Retrieval
Systems (AS RSs)
•Automated placement and
withdrawal of parts and
products
•Reduced errors and labor
•Particularly useful in
inventory and test areas of
manufacturing firms
Copyright © 2020 Pearson Education Ltd. All Rights Reserved.
Automated Guided Vehicle (AG Vs)
•Electronically guided and controlled carts
•Used for movement of products and/or individuals
Copyright © 2020 Pearson Education Ltd. All Rights Reserved.
Flexible Manufacturing Systems (F
MSs)
•Computer controls both the workstation and the material
handling equipment
•Enhanced flexibility and reduced waste
•Can economically produce low volume but high variety
•Reduced changeover time and increased utilization
•Stringent communication requirement between
components
Copyright © 2020 Pearson Education Ltd. All Rights Reserved.
Computer-Integrated Manufacturing
(CI M) (1 of 2)
•Extend flexible manufacturing
–Backward to engineering and inventory control
–Forward into warehousing and shipping
–Can also include financial and customer service areas
–Reducing the distinction between low-volume/high-
variety, and high-volume/low-variety production
Copyright © 2020 Pearson Education Ltd. All Rights Reserved.
Computer-Integrated Manufacturing
(CI M) (2 of 2)
Figure 7.9
Copyright © 2020 Pearson Education Ltd. All Rights Reserved.
Technology in Services (1 of 3)
Table 7.4 Examples of Technology’s Impact on Services
SERVICE INDUSTRY EXAMPLE
Financial Services
Debit cards, electronic funds transfer, ATMs,
Internet stock trading, online banking via cell
phone, Apple pay
Education
Online newspapers and journals, interactive
assignments via WebCT, Blackboard, and
smartphones
Utilities and government
Automated one-person garbage trucks, optical mail
scanners, flood-warning systems, meters that allow
homeowners to control energy usage and costs
Restaurants and foods
Wireless orders from waiters to kitchen, robot
butchering, transponders on cars that track sales at
drive-throughs
Copyright © 2020 Pearson Education Ltd. All Rights Reserved.
Technology in Services (2 of 3)
Table 7.4 Examples of Technology’s Impact on Services
SERVICE INDUSTRY EXAMPLE
Communications Interactive TV, e-books via Kindle, speech
recognition
Hotels Electronic check-in/check-out, electronic key/lock
systems, mobile Web bookings
Wholesale/retail trade Point-of-sale (POS) terminals, e-commerce,
electronic communication between store and
supplier, bar-coded data, RFID, self-checkout, pay
via facial recognition
Transportation Automatic toll booths, satellite-directed navigation
systems, Wi-Fi in automobiles
Technology in Services (3 of 3)
Table 7.4 Examples of Technology’s Impact on Services
SERVICE INDUSTRY EXAMPLE
Health care Online patient-monitoring systems, online medical
information systems, robotic surgery, artificial
intelligence for medical diagnoses
Airlines Ticketless travel, scheduling, Internet purchases,
boarding passes downloaded as two-dimensional
bar codes on smart phones