
Asia-Pacific – AC Drives 0200 – 0669 – 2014
© MARKETLINE THIS PROFILE IS A LICENSED PRODUCT AND IS NOT TO BE PHOTOCOPIED Page | 1
MarketLine Industry Profile
AC Drives in Asia–
Pacific
November 2014
Reference Code: 0200–0669
Publication Date: November 2014
WWW.MARKETLINE.COM
MARKETLINE. THIS PROFILE IS A LICENSED PRODUCT AND IS NOT TO BE PHOTOCOPIED

Asia-Pacific – AC Drives 0200 – 0669 – 2014
© MARKETLINE THIS PROFILE IS A LICENSED PRODUCT AND IS NOT TO BE PHOTOCOPIED Page | 2
EXECUTIVE SUMMARY
Market value
The Asia-Pacific AC drives market grew by 1.4% in 2014 to reach a value of $9.1 billion.
Market value forecast
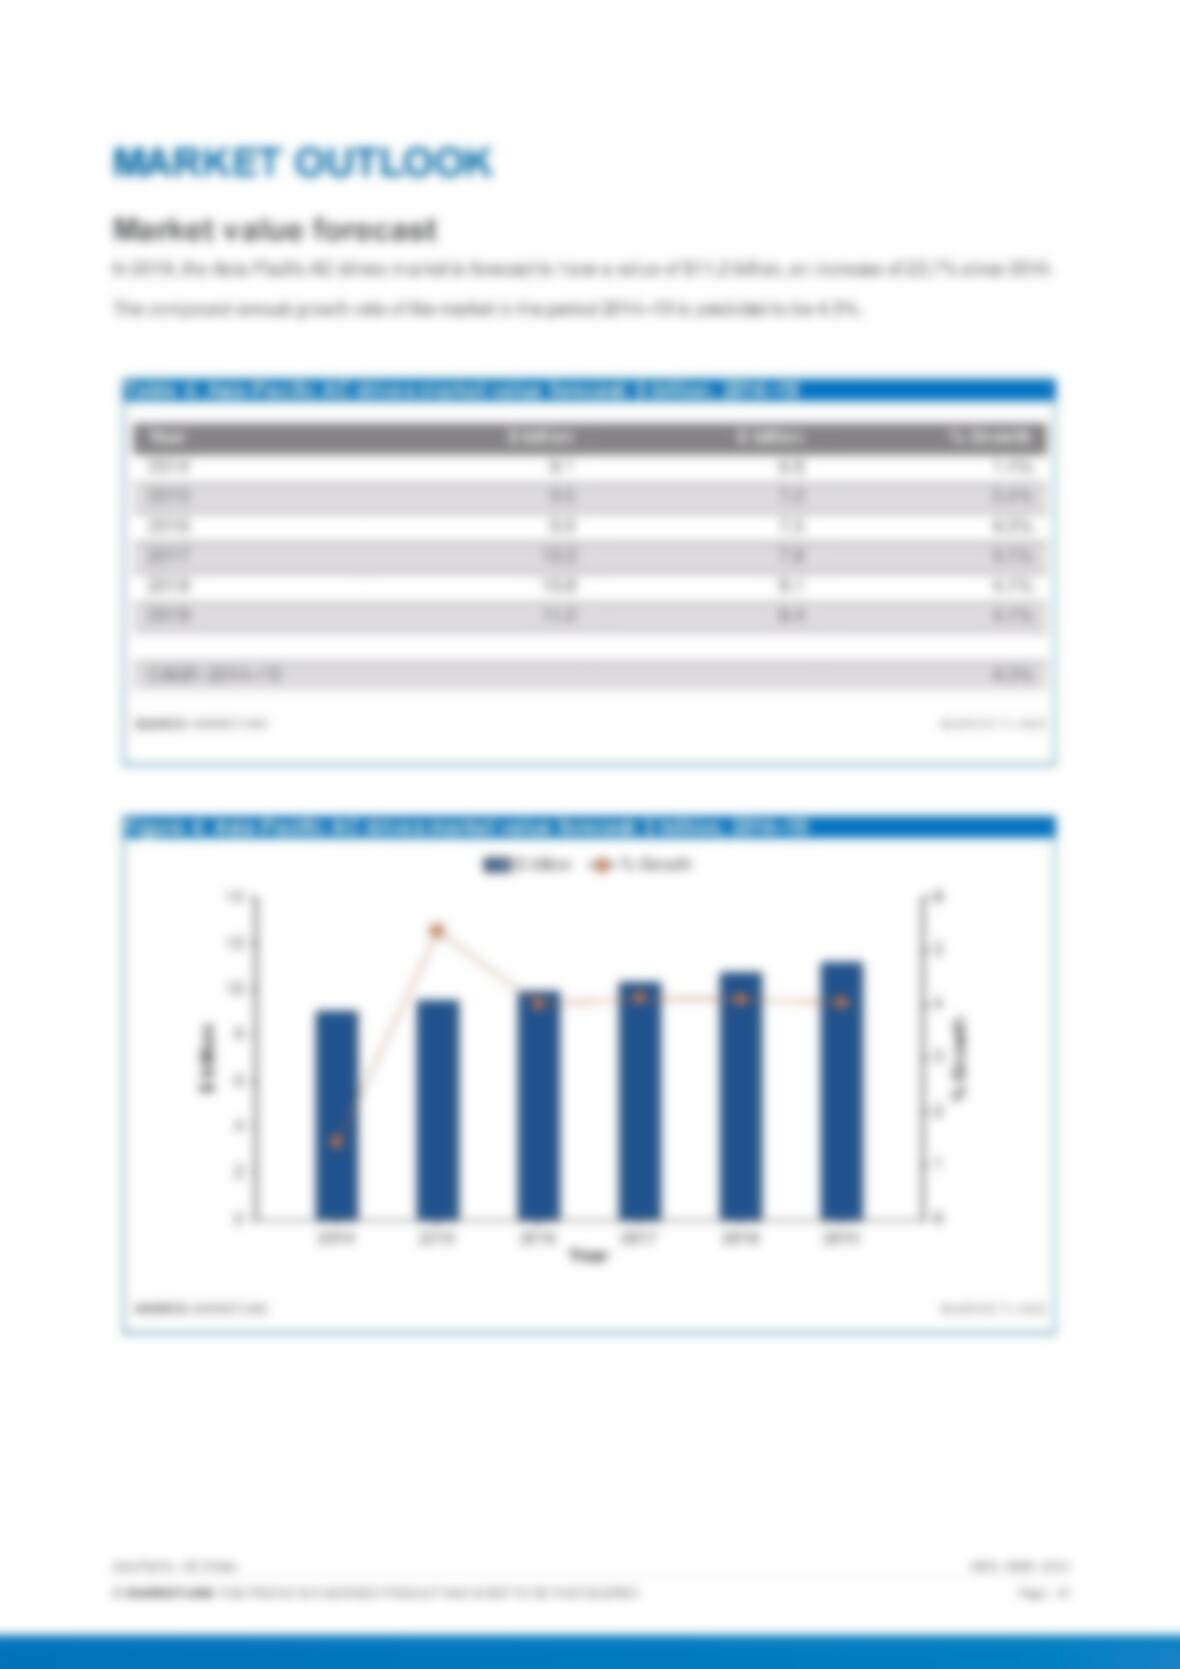
In 2019, the Asia–Pacific AC drives market is forecast to have a value of $11.2 billion, an increase of 23.7% since 2014.
Category segmentation
High end (201+ kw) is the largest segment of the AC drives market in Asia-Pacific, accounting for 31.9% of the market’s
total value.
Geography segmentation
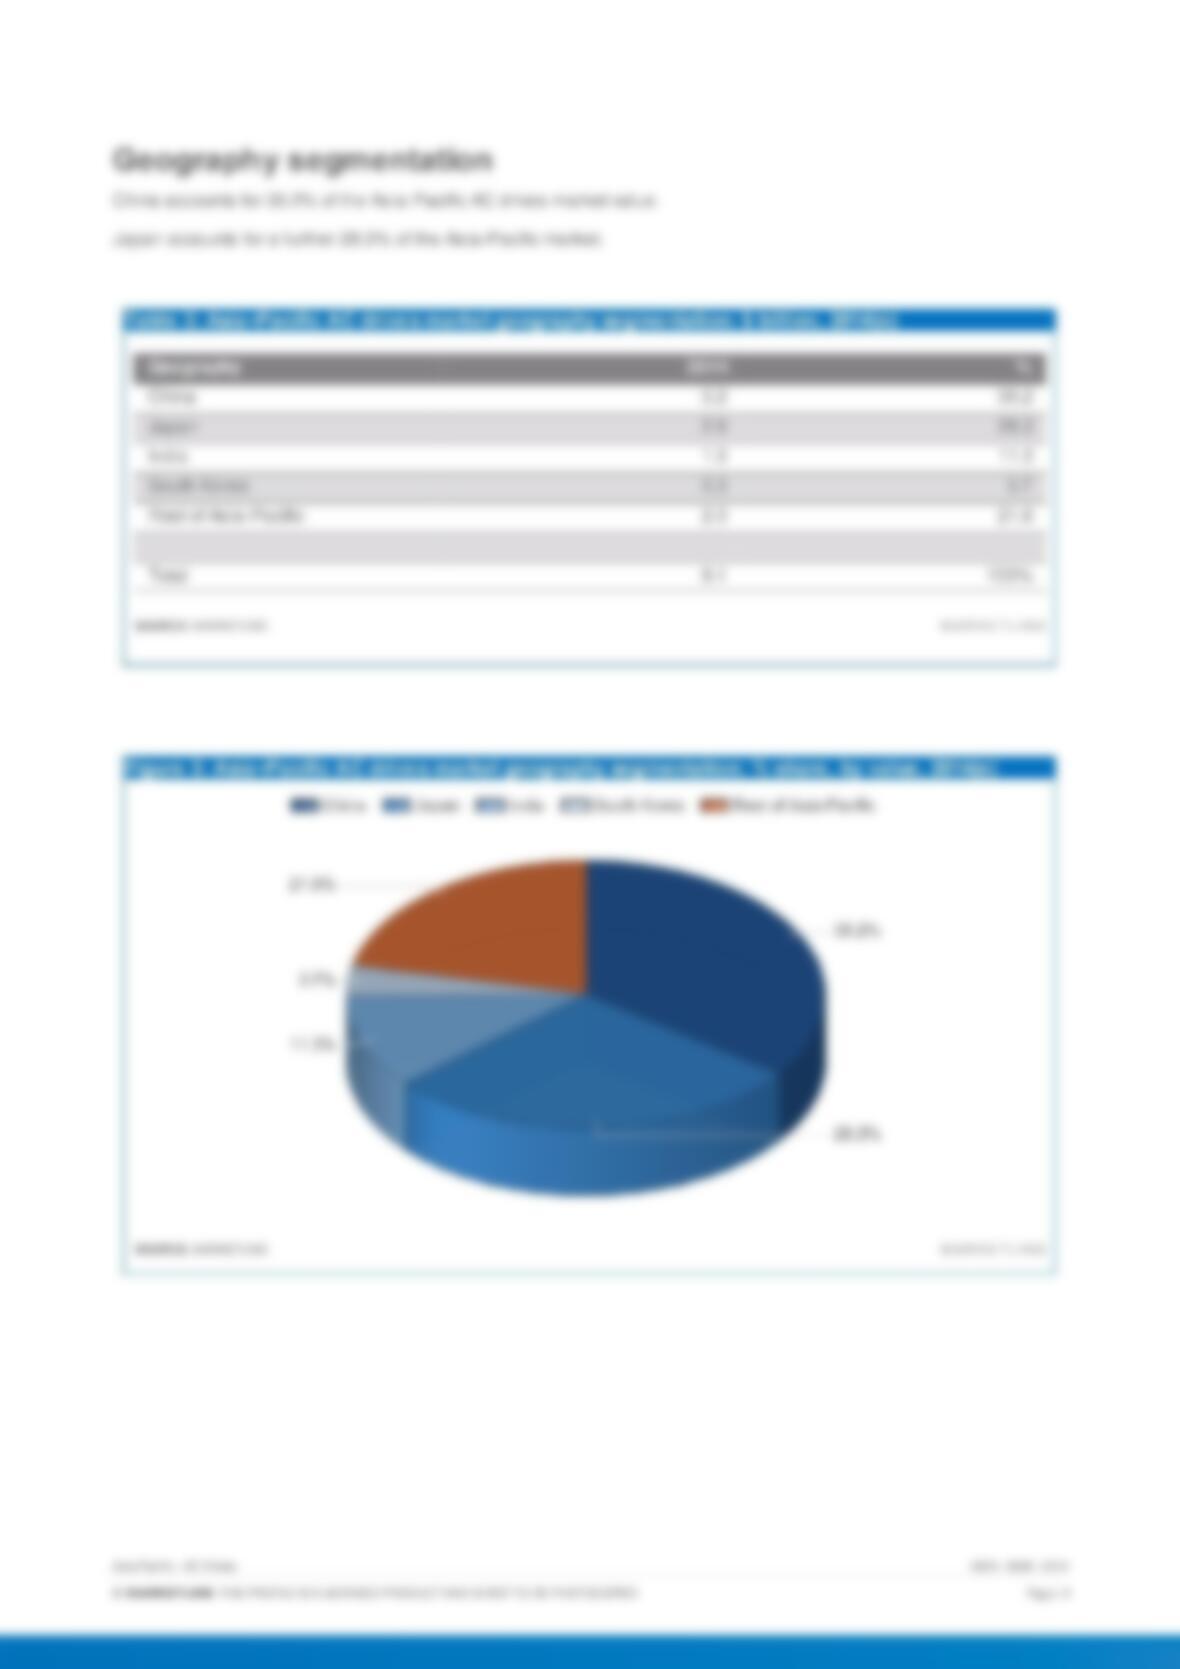
China accounts for 35.2% of the Asia-Pacific AC drives market value.
Market rivalry
There is a moderate degree of rivalry in the AC drives market, which is dominated by a small number of large companies
and has been growing strongly in recent years.

Asia-Pacific – AC Drives 0200 – 0669 – 2014
© MARKETLINE THIS PROFILE IS A LICENSED PRODUCT AND IS NOT TO BE PHOTOCOPIED Page | 3
TABLE OF CONTENTS
Executive Summary……………………………………………………….…………………………………………………………………………………………….2
Market value …………………………………………………………………………………………………………………………………………………………….2
Market value forecast………………………………………………………………………………………………………………..……………………………..2
Category segmentation…………………………………………………………………………………………………………………………………………….2
Geography segmentation …………………………………………………………………………………………………………………………………………2
Market rivalry ……………………………………………………………………………………………………………………………………………………………2
Market Overview ……………………………………………………….…………………………………………………………………………………………………6
Market definition……………………………………………………………………………………………………………………………………………………….6
Market analysis ……………………………………………………….……………………………………………………………………………………………….6
Market Data…………………………..………………………………………………………………………………………………………………..……………………7
Market value …………………………………………………………………………………………………………………………………………………………….7
Market Segmentation …………………………………………………………………………………………………………………………………………….…….8
Category segmentation…………………………………………………………………………………………………………………………………………….8
Geography segmentation …………………………………………………………………………………………………………………………………………9
Market Outlook …………………………………………………………………………………………………………………………………………………………..10
Market value forecast………………………………………………………………………………………………………………..…………………………...10
Five Forces Analysis ………………………………………………………………………………………………………………………………………………….11
Summary …………………………..………………………………………………………………………………………………………………..………………….11
Buyer power…………………………..……………………………………………………………………………………………………………………………….12
Supplier power ……………………………………………………………………………………………………………………………………………………….13
New entrants ………………………………………………………………………………………………………………..………………………………………..14
Threat of substitutes……………………………………………………….………………………………………………………………………………………15
Degree of rivalry……………………………………………………….…………………………………………………………………………………………….16
Leading Companies……………………………………………………….…………………………………………………………………………………………..17
Siemens Aktiengesellschaft ……………………………………………………………………………………………………………………………………17
Mitsubishi Electric ……………………………………………………….………………………………………………………………………………………….20
ABB, Ltd. ……………………………………………………….……………………………………………………………………………………………………….23
Rockwell Automation, Inc. ……………………………………………………….……………………………………………………………………………..27
Appendix…………………………………………………………………………………………………………………………………………………………………….30
Methodology …………………………………………………………………………………………………………………………………………………………..30
Industry associations………………………………………………………………………………………………………………..…………………………….31
Related MarketLine research………………………………………………………………………………………………………………………………….31

Asia-Pacific – AC Drives 0200 – 0669 – 2014
© MARKETLINE THIS PROFILE IS A LICENSED PRODUCT AND IS NOT TO BE PHOTOCOPIED Page | 4
LIST OF TABLES
Table 1: Asia–Pacific AC drives market value: $ billion, 2010–14(e) …………………………………………………………………………….7
Table 2: Asia–Pacific AC drives market category segmentation: $ billion, 2014(e)………………………………………………………8
Table 3: Asia–Pacific AC drives market geography segmentation: $ billion, 2014(e) …………………………..………………………9
Table 4: Asia–Pacific AC drives market value forecast: $ billion, 2014–19 …………………………………………………………………10
Table 5: Siemens Aktiengesellschaft: key facts………………………………………………………………………………………………………….17
Table 6: Siemens Aktiengesellschaft: key financials ($)……………………………………………………………………………………………..18
Table 7: Siemens Aktiengesellschaft: key financials (€)……………………………………………………………………………………………..18
Table 8: Siemens Aktiengesellschaft: key financial ratios……………………………………………………….………………………………….18
Table 9: Mitsubishi Electric: key facts…………………………………………………………………………………………………………………………20
Table 10: Mitsubishi Electric: key financials ($) ………………………………………………………………………………………………………….21
Table 11: Mitsubishi Electric: key financials (¥) ………………………………………………………………………………………………………….21
Table 12: Mitsubishi Electric: key financial ratios ……………………………………………………….………………………………………………21
Table 13: ABB, Ltd.: key facts…………………………..………………………………………………………………………………………………………..23
Table 14: ABB, Ltd.: key financials ($) ……………………………………………………………………………………………………………………….25
Table 15: ABB, Ltd.: key financial ratios …………………………………………………………………………………………………………………….25
Table 16: Rockwell Automation, Inc.: key facts ………………………………………………………………………………………………………….27
Table 17: Rockwell Automation, Inc.: key financials ($) ……………………………………………………………………………………………..28
Table 18: Rockwell Automation, Inc.: key financial ratios …………………………..………………………………………………………………28

Asia-Pacific – AC Drives 0200 – 0669 – 2014
© MARKETLINE THIS PROFILE IS A LICENSED PRODUCT AND IS NOT TO BE PHOTOCOPIED Page | 5
LIST OF FIGURES
Figure 1: Asia-Pacific AC drives market value: $ billion, 2010–14(e)……………………………………………………….…………………..7
Figure 2: Asia–Pacific AC drives market category segmentation: % share, by value, 2014(e) …………………………………….8
Figure 3: Asia–Pacific AC drives market geography segmentation: % share, by value, 2014(e)…………………………..……..9
Figure 4: Asia-Pacific AC drives market value forecast: $ billion, 2014–19 …………………………..……………………………………10
Figure 5: Forces driving competition in the AC drives market in Asia-Pacific, 2014……………………………………………………11
Figure 6: Drivers of buyer power in the AC drives market in Asia-Pacific, 2014 …………………………………………………………12
Figure 7: Drivers of supplier power in the AC drives market in Asia-Pacific, 2014 ……………………………………………………..13
Figure 8: Factors influencing the likelihood of new entrants in the AC drives market in Asia -Pacific, 2014………………..14
Figure 9: Factors influencing the threat of substitutes in the AC drives market in Asia-Pacific, 2014 …………………………15
Figure 10: Drivers of degree of rivalry in the AC drives market in Asia-Pacific, 2014 …………………………..…………………….16
Figure 11: Siemens Aktiengesellschaft: revenues & profitability…………………………………………………………………………………19
Figure 12: Siemens Aktiengesellschaft: assets & liabilities ……………………………………………………….……………………………….19
Figure 13: Mitsubishi Electric: revenues & profitability …………………………..…………………………………………………………………..22
Figure 14: Mitsubishi Electric: assets & liabilities ……………………………………………………………………………………………………….22
Figure 15: ABB, Ltd.: revenues & profitability……………………………………………………………………………………………………………..26
Figure 16: ABB, Ltd.: assets & liabilities …………………………………………………………………………………………………………………….26
Figure 17: Rockwell Automation, Inc.: revenues & profitability ……………………………………………………….………………………….29
Figure 18: Rockwell Automation, Inc.: assets & liabilities ……………………………………………………….………………………………….29

Asia-Pacific – AC Drives 0200 – 0669 – 2014
© MARKETLINE THIS PROFILE IS A LICENSED PRODUCT AND IS NOT TO BE PHOTOCOPIED Page | 6
MARKET OVERVIEW
Market definition
AC drives are variable-frequency drives designed to control AC-powered electric motors. The AC drives market consists
of four primary categories: micro drives (up to 4 kW), low end (5 – 40 kW), mid range (41 – 200 kW) and high end (201+
kW). The market’s value is calculated at manufacturers‘ selling price (MSP). All currency conversions within this report
have been calculated using constant 2013 annual average exchange rates.
For the purposes of this report, Asia-Pacific comprises Australia, China, India, Indonesia, Japan, New Zealand,
Singapore, South Korea, Taiwan, and Thailand.
Market analysis
Asia-Pacific is the largest regional market for AC drives, with Japan and China together accounting for much of the
demand. Because AC drives have applications in many industrial, construction, and transportation end –markets that are
growing in China, this country is expected to be responsible for an increasing share of the total going forward to 2019. As
such, healthy overall growth has been experienced over the past few years, and this is expected to continue over the
forecast period to 2019.
The Asia-Pacific AC drives market is expected to generate total revenues of $9.052.5m in 2014, representing a
compound annual growth rate (CAGR) of 5.2% between 2010 and 2014. In comparison, the Japanese and Chinese
markets will increase with CAGRs of 12% and 8.9% respectively, over the same period, to reach respective values of
$2,559.8m and $3,183.6m in 2014.
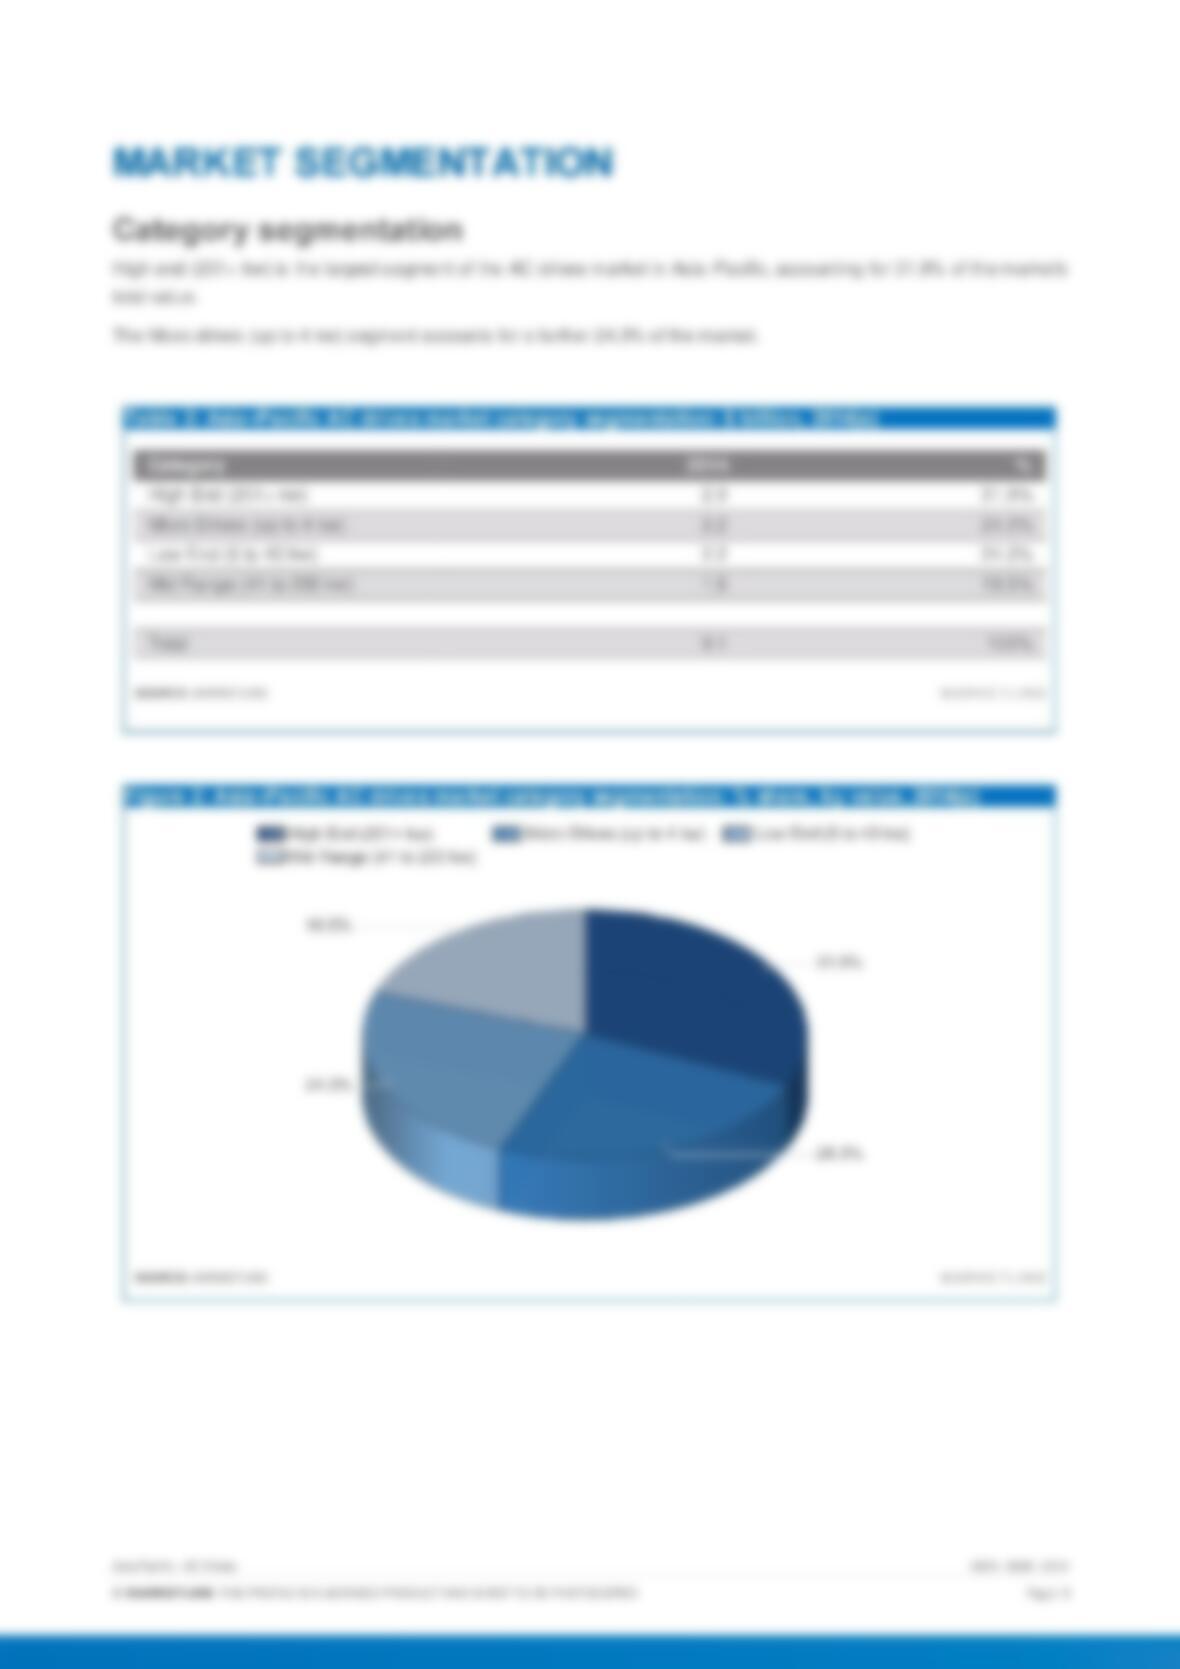
The high end (201+ kw) segment is expected to be the market’s most lucrative in 2014, with total revenues of $2,887.7m,
equivalent to 31.9% of the market’s overall value. The micro drives (up to 4 kw) segm ent will contribute revenues of
$2,199.7m in 2014, equating to 24.3% of the market’s aggregate value.
The performance of the market is forecast to decelerate, with an anticipated CAGR of 4.3% for the five-year period 2014
– 2019, which is expected to drive the market to a value of $11,194.3m by the end of 2019. Comparatively, the Japanese
and Chinese markets will increase with CAGRs of 6.7% and 6.4% respectively, over the same period, to reach
respective values of $3,544.8m and $4,332.5m in 2019.
MARKET DATA
Market value
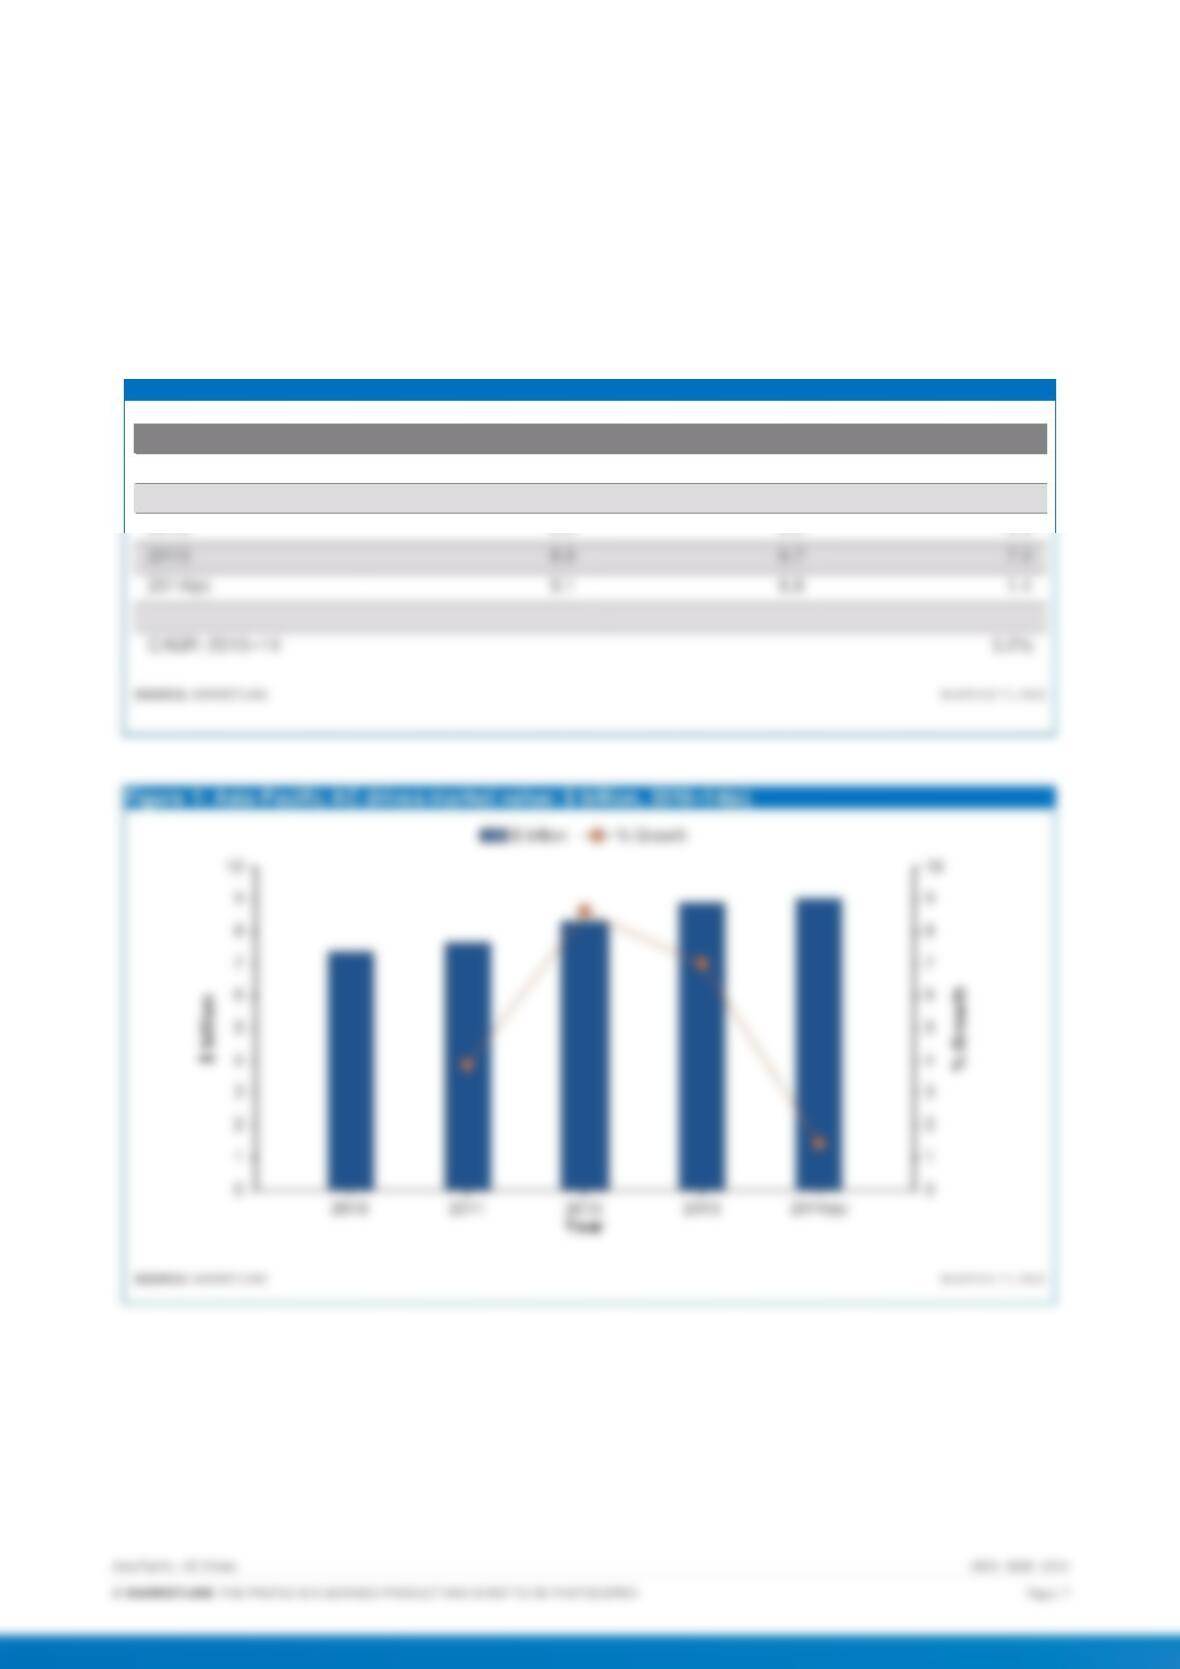
The Asia-Pacific AC drives market grew by 1.4% in 2014 to reach a value of $9.1 billion.
The compound annual growth rate of the market in the period 2010–14 was 5.2%.
Table 1: Asia-Pacific AC drive s market value: $ billion, 2010–14(e)
Year
$ billion
€ billion
% Growth
2010
7.4
5.6
2011
7.7
5.8
3.9
2012
8.3
6.3
8.6
2013
8.9
6.7
7.0
9.1
6.8
1.4
Figure 1: Asia-Pacific AC drive s market value: $ billion, 2010–14(e)

E: REACHUS@MARKETLINE.COM