Strategy
Ramon Casadesus–Masanell, Series Editor
Competitive
Advantage
PANKAJ GHEMAWAT
IESE BUSINESS SCHOOL
JAN W. RIVKIN
HARVARD BUSINESS SCHOOL
8105 | Published: January 31, 2014
+ INTERACTIVE ILLUSTRATIONS
This document is authorized for use only in Prof. Satyasiba Das & Prof. Ankita Chhabra’s PGP 2020-22 1.19.2021 at Indian Institute of Management – Raipur from Jan 2021 to Jul 2021.

Table of Contents
1 Introduction ……………………………………………………………………………………….. 3
2 Essential Reading ………………………………………………………………………………. 6
2.1 The Logic of Value Creation and Distribution ……………………………… 6
Willingness to Pay and Supplier Opportunity Cost …………………….. 6
Added Value ………………………………………………………………………………… 8
Added Value and Competitive Advantage …………………………………. 9
2.2 The Tension Between Cost and Willingness to Pay ……………………. 9
2.3 Activity Analysis ………………………………………………………………………… 12
Step 1: Catalog Activities (The Value Chain) …………………………….. 12
Step 2: Use Activities to Analyze Relative Costs ………………………. 13
Step 3: Us
e Activities to Analyze Relative Willingness to Pay
….. 16
Step 4: Explore Options and Make Choices ………………………………. 19
The Whole Versus the Parts ………………………………………………………. 21
2.4 Concluding Thoughts …………………………………………………………………. 22
3 Supplemental Reading …………………………………………………………………….. 23
3.1 Analyzing Value Propositions …………………………………………………….. 23
4 Key Terms…………………………………………………………………………………………. 26
5 For Further Reading …………………………………………………………………………. 26
6 Endnotes …………………………………………………………………………………………… 27
7 Index …………………………………………………………………………………………………. 29
This reading contains links to online interactive illustrations, denoted by the icon
above. To access these exercises you will need a broadband Internet connection.
Please verify that your browser meets the minimum technical requirements by
visiting http://hbsp.harvard.edu/list/tech–specs.
Pankaj Ghemawat, Professor of Strategic Management, IESE Business School, and
Jan W. Rivkin, Bruce V. Rauner Professor of Business Administration, Harvard
Business School, developed this Core Reading.
Copyright © 2014 Harvard Business School Publishing Corporation. All rights reserved. To order copies or request permission to
reproduce materials (including posting on academic websites), call 1–800–545–7685 or go to http://www.hbsp.harvard.edu.
8105 | Core Reading: COMPETITIVE ADVANTAGE 2
This document is authorized for use only in Prof. Satyasiba Das & Prof. Ankita Chhabra’s PGP 2020-22 1.19.2021 at Indian Institute of Management – Raipur from Jan 2021 to Jul 2021.
1 INTRODUCTION1
ome companies generate far greater profits than others. The
pharmaceutical company Merck produced an economic profit of
more than $11.3 billion from 1994 to 2012.a Over the same period,
U.S. Steel produced an economic loss of more than $330 million; its cost
of capital exceeded its accounting profit by a wide margin.
Large differ–
ences in economic performance across industries are commonplace, but
profitability can vary even more among companies in the same industry.
To understand those intra–industry differences, we turn to the concept
of competitive advantage, our focus in this reading.
Strategists must understand the roots of performance differences both across and within
industries. Differences in industry structure shed light on the former.2 To a certain extent,
Merck has generated more economic profit than U.S. Steel because the pharmaceutical
industry is structurally more attractive than the steel industry. Rivalry in pharmaceuticals is
muted by factors such as patent protection, product differentiation, and expanding demand.
In contrast, rivalry in the steel industry is fierce—fueled by excess capacity, limited differences
among products, and slow growth. Many pharmaceutical users hesitate to switch products or
brands, while steel customers are usually willing to switch producers in order to get a better
price. Many pharmaceuticals are made from commodities with little labor input, while unions
exercise such power in the steel industry that labor costs often account for one–quarter of total
revenue. Such contrasts in industry–level competitive forces are one reason for the variation in
profit levels of firms in different industries. (For more on the forces that influence industry
profitability, see Core Reading: Industry Analysis [HBP No. 8101].) Figure 1 shows, for each of
many industries, the percentage spread between the industry’s return on equity and its cost of
equity (the vertical axis) and the average equity in the industry (the horizontal axis) for the
period 1994–2012. Reflecting differences in industry–level competitive forces, the
pharmaceutical industry has been among the greatest generators of economic profit, while the
steel industry has generated much less. The typical pharmaceutical maker is far more
profitable than the typical steel producer.b
Merck is not a typical pharmaceutical company, however, nor is U.S. Steel a typical steel
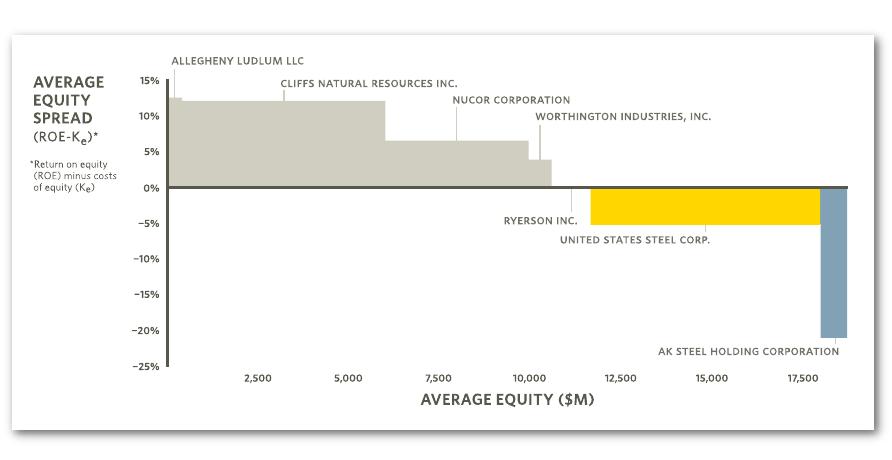
producer. As Figures 2 and 3 illustrate, industry averages such as those shown in Figure 1 can
mask large differences in economic profit within industries. Merck was far more effective at
producing economic profits than were many drug companies during the 1994–2012 period,
while U.S. Steel performed worse than other steel producers. Indeed, research indicates that
intra–industry differences in profitability like those shown in Figures 2 and 3 may be larger
than differences across industries.3 Industry–level effects appear to account for 10% to 20% of
the variation in profitability across industries, while stable within–industry effects account for
30% to 45% of the variation within an industry. (Most of the remainder can be assigned to
effects that fluctuate from year to year.)
a The accounting profit it generated exceeded its cost of equity capital by that amount.
b We are grateful to Randy DeGeer of Marakon Associates for collecting and analyzing the data for
Figures 1, 2, and 3.
S
8105 | Core Reading: COMPETITIVE ADVANTAGE 3
This document is authorized for use only in Prof. Satyasiba Das & Prof. Ankita Chhabra’s PGP 2020-22 1.19.2021 at Indian Institute of Management – Raipur from Jan 2021 to Jul 2021.
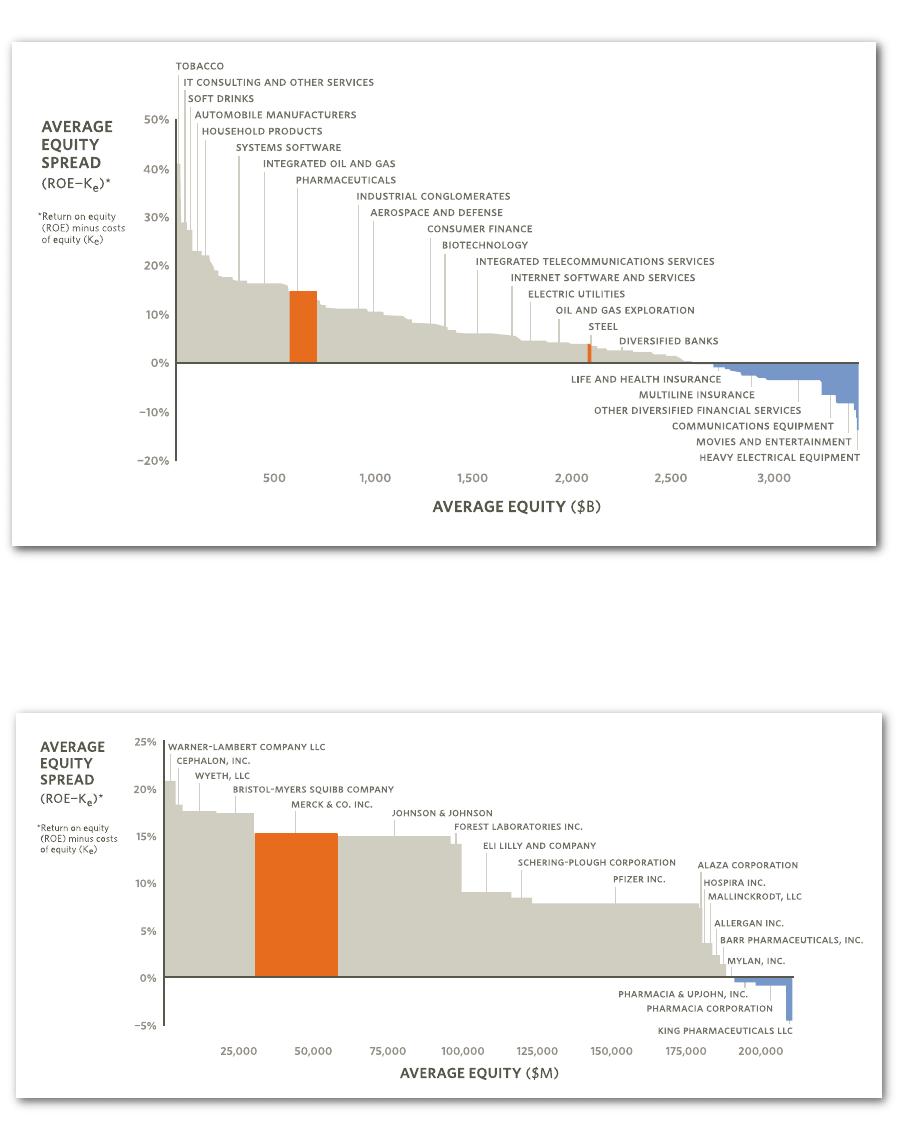
FIGURE 1 Economic Profits of U.S. Industry Groups, 1994–2012
Source: CapIQ, MRP from Damodran, Marakon analysis.
FIGURE 2 Economic Profits in the Pharmaceutical Industry, 1994–2012
Source: CapIQ, MRP from Damodran, Marakon analysis.
8105 | Core Reading: COMPETITIVE ADVANTAGE 4
This document is authorized for use only in Prof. Satyasiba Das & Prof. Ankita Chhabra’s PGP 2020-22 1.19.2021 at Indian Institute of Management – Raipur from Jan 2021 to Jul 2021.
The concept of competitive advantage helps strategists understand and analyze within–
industry differences in performance. A firm has a competitive advantage over its rivals if it has
driven a wide wedge between the amount its customers are willing to pay and the costs it
incurs—indeed, a wider wedge than its competitors have achieved.4 A firm with a competitive
advantage is positioned to earn superior profits within its industry.
In focusing on competitive advantage to help explain performance differences within an
industry, we are not denying the importance of industry–level effects. Indeed, industry analysis
is crucial to creating competitive advantage for several reasons. First, companies that generate
competitive advantages typically do so by devising strategies that neutralize the unattractive
features of their industries and exploit the attractive features. Second, industry conditions
appear to have a large influence on whether competitive advantages are even possible.5 In
some industries (e.g., computer leasing), conditions straitjacket firms, leaving them little room
to establish a superior wedge between willingness to pay and costs. In other industries (e.g.,
prepackaged software), conditions permit the most effective firms to enjoy large advantages
over the least effective. Finally, market leaders often face a tension between managing industry
structure and pursuing an advantage within that structure. When deciding whether to build a
new aluminum smelter, for instance, Alcoa must consider the impact of the additional
capacity on industry supply and demand, not just on Alcoa’s competitive advantage. This is
true not only because Alcoa is a large player in the business, but also because Alcoa is closely
tracked by its rivals.
In examining the logic of how firms create competitive advantage, this reading emphasizes
two themes. First, to create an advantage, a firm must configure itself to do something unique
and valuable. In other words, the firm must ensure that, were it to disappear, someone in its
network of suppliers, customers, and complements would miss it and no one could replace it
completely.6 The first section of the reading uses the concept of added value to make this
point more precisely. Second, competitive advantage arises only when the full range of a firm’s
activities—production, finance, marketing, logistics, and so on—act in harmony. The essence
of creating advantage is finding an integrated set of choices that distinguishes a firm from its
rivals. The second section of the reading explores the steps involved in analyzing a firm’s
activities to understand the sources of competitive advantage. The Supplemental Reading
section discusses the use of value proposition analysis as a reflection of the choices about the
FIGURE 3 Economic Profits in the Steel Industry, 1994–2012
Source: CapIQ, MRP from Damdran, Marakon analysis.
8105 | Core Reading: COMPETITIVE ADVANTAGE 5
This document is authorized for use only in Prof. Satyasiba Das & Prof. Ankita Chhabra’s PGP 2020-22 1.19.2021 at Indian Institute of Management – Raipur from Jan 2021 to Jul 2021.

particular kinds of value the firm will offer. Whereas value chain analysis and relative cost
analysis, discussed in the Essential Reading section, focus internally on a firm’s operations,
value proposition analysis looks outward at customers.
Two caveats before we proceed: First, for ease of explication, this reading separates the
challenge of creating competitive advantage from that of sustaining it. In reality, the two
cannot be separated: The choices that establish a firm’s advantage also influence whether it
can be sustained. Second, this reading takes an analytical approach to competitive advantage,
but in actuality many of the greatest advantages come not from analysis but from insight and
trial and error. The analysis described here is not intended to deny the importance of
exploratory approaches.
2 ESSENTIAL READING
2.1 The Logic of Value Creation and Distribution
A firm that has a competitive advantage is one that has added value. To illustrate that concept,
which was developed by Adam Brandenburger, Barry Nalebuff, and Harborne Stuart,7
consider the portal crane business of Harnischfeger Industries.8
Harnischfeger, based in Milwaukee, Wisconsin, manufactured equipment for industrial
customers. Its material–handling equipment division served a range of customers, including
forest products companies such as International Paper. In the late 1970s, Harnischfeger began
to offer these customers a new product: portal cranes, designed to lift tree–length logs off
railcars and trucks and to hoist them around wood yards. The cranes were a significant
improvement over the giant forklifts that they replaced.
In fact, it was possible to calculate the customer benefits reasonably precisely. Each crane
replaced a fleet of forklifts, which cost roughly $1 million. A crane was less expensive to
operate than a forklift fleet; it required less labor, fuel, and maintenance, for instance.
Altogether over its life span, each crane generated a net present value of $6.5 million of savings
in operating costs. It cost Harnischfeger only $2.5 million to produce and install each crane.
Thus a large gap existed between the customer benefits associated with a crane ($1 million
plus $6.5 million) and Harnischfeger’s costs ($2.5 million). Despite that gap, by the late 1980s
Harnischfeger was making little profit on its sales of portal cranes. Why?
Willingness to Pay and Supplier Opportunity Cost
As we’ve noted, competitive advantage is associated with creating a large gap between a
customer’s willingness to pay and the company’s cost. That cost can be thought of in terms of
the supplier’s opportunity cost. (We’ll discuss the difference between actual costs and
supplier’s opportunity cost at the end of this section.) A customer’s willingness to pay for a
product or service is the maximum amount of money a customer is willing to part with in
order to obtain the product or service. A customer considering the purchase of a portal crane
from Harnischfeger would be willing to pay as much as $7.5 million for it. If it cost more than
that, the customer would be better off buying the forklifts for $1 million and paying the extra
$6.5 million to operate them.
The concept of supplier opportunity cost is symmetrical to willingness to pay. It is the
smallest amount a supplier will accept for the services and resources required to produce a
8105 | Core Reading: COMPETITIVE ADVANTAGE 6
This document is authorized for use only in Prof. Satyasiba Das & Prof. Ankita Chhabra’s PGP 2020-22 1.19.2021 at Indian Institute of Management – Raipur from Jan 2021 to Jul 2021.
good or service. We call this an “opportunity cost” because it is dictated by the best
opportunities a supplier has to sell its services and resources elsewhere. In the example, the
actual cost that Harnischfeger incurred to deliver a portal crane was $2.5 million. We don’t
know the lowest amount the company’s suppliers would have accepted, but we will speculate
that it was not far below $2.5 million—say, $2.0 million.
Imagine that Harnischfeger is bargaining with International Paper, one of the largest paper
manufacturers, over the price of a portal crane. For now, suppose that Harnischfeger is the
only company that can provide a portal crane and that International Paper is the sole
customer. The price that emerges from the bargaining may fall anywhere between $2.5
million, Harnischfeger’s cost, and $7.5 million, International Paper’s willingness to pay. (See
Interactive Illustration 1 for an example of this concept.) Our theory says nothing about
where the price will fall within this range. If Harnischfeger is a particularly tough bargainer,
then the price will climb toward $7.5 million. If International Paper is more shrewd during
negotiations, the price will edge toward $2.5 million.