2
I. Introduction
The Stop ‘n Go Supermarket has required our services to analyze the large number of
complaints from customers received in their store. These complaints cover a broad range of
areas such as customer service, inventory problems, checkout logistics, food quality, pricing
issues or store atmosphere.
Every Tuesday for nine weeks, Stop ‘n Go Supermarket has diligently recorded all of the
complaints by the customers. There were a total of 180 complaints on those nine Tuesdays,
excluding three comments that we considered invalid as it has not contributed to any
customer dissatisfaction to the supermarket which is our purpose of the study.
On the 15th of July, several changes were implemented to reduce out-of-stock complaints,
improve the overall maintenance of the store premises, reduce the long checkout lines and
address the pricing issues.
We have employed several Total Quality Management principles and tools in helping the
business understand how they should address these problems.
II. Statement of the Problem
The Supermarket faces the problem of large number of complaints ranging from food
quality, inventory, pricing to store maintenance. The manager John Martin envisions that the
best way to increase the bottomline is to improve the quality of each process and he has
concluded that the best way to start is in looking into the causes of these complaints.
1. Identify and categorize the causes of the complaints
2. Get a clear assessment of the impact of each complaint category
3. Interpret the findings to come up with a good TQM strategy
III. Objective
The objective is to lead Stop ‘n Go Supermarket to higher quality levels, starting from
implementing process improvements that are not only effective but are also highly efficient.
In our study of Operations Management, our primary focus here is to gain greater
understanding of the Total Quality Management process in order to help out an organization
in its continual effort to improve quality and achieve customer satisfaction.
3
IV. Analysis and Findings
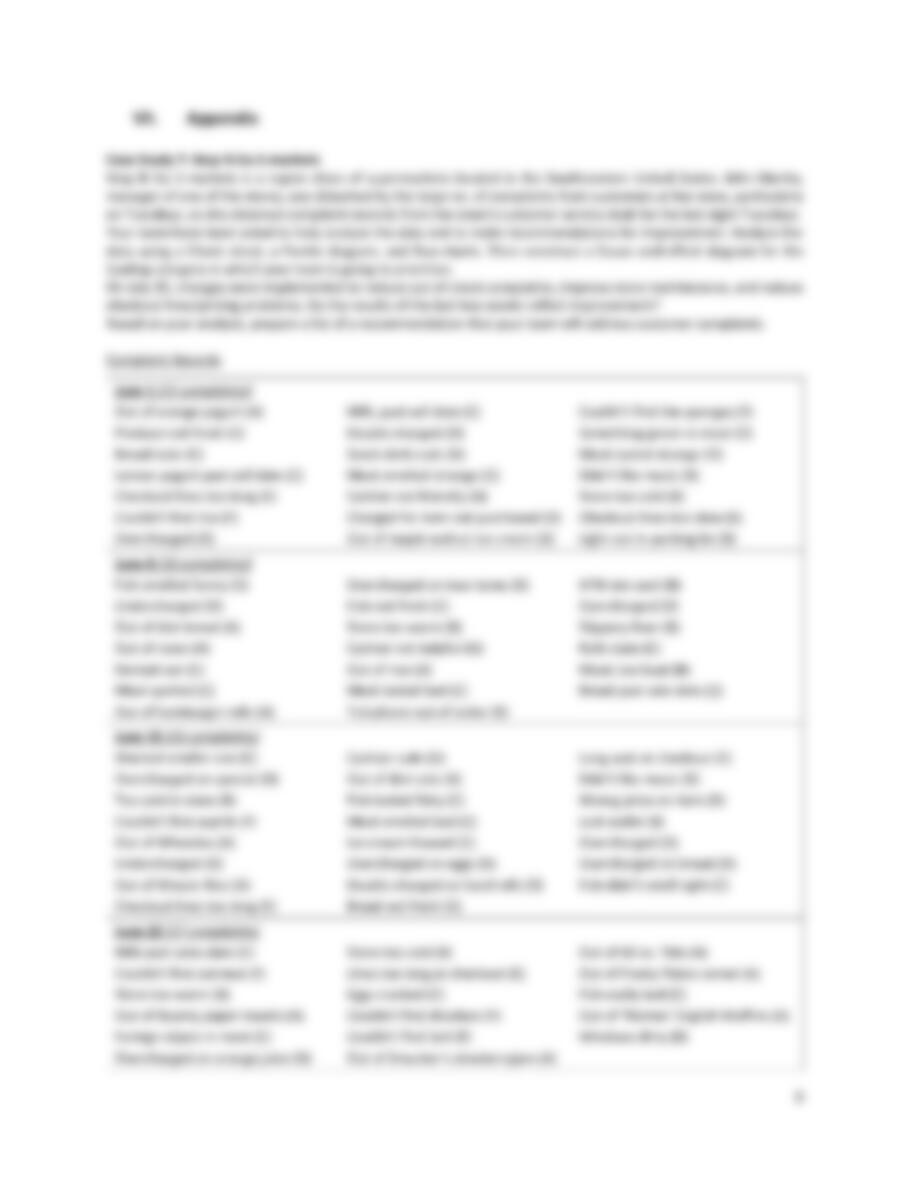
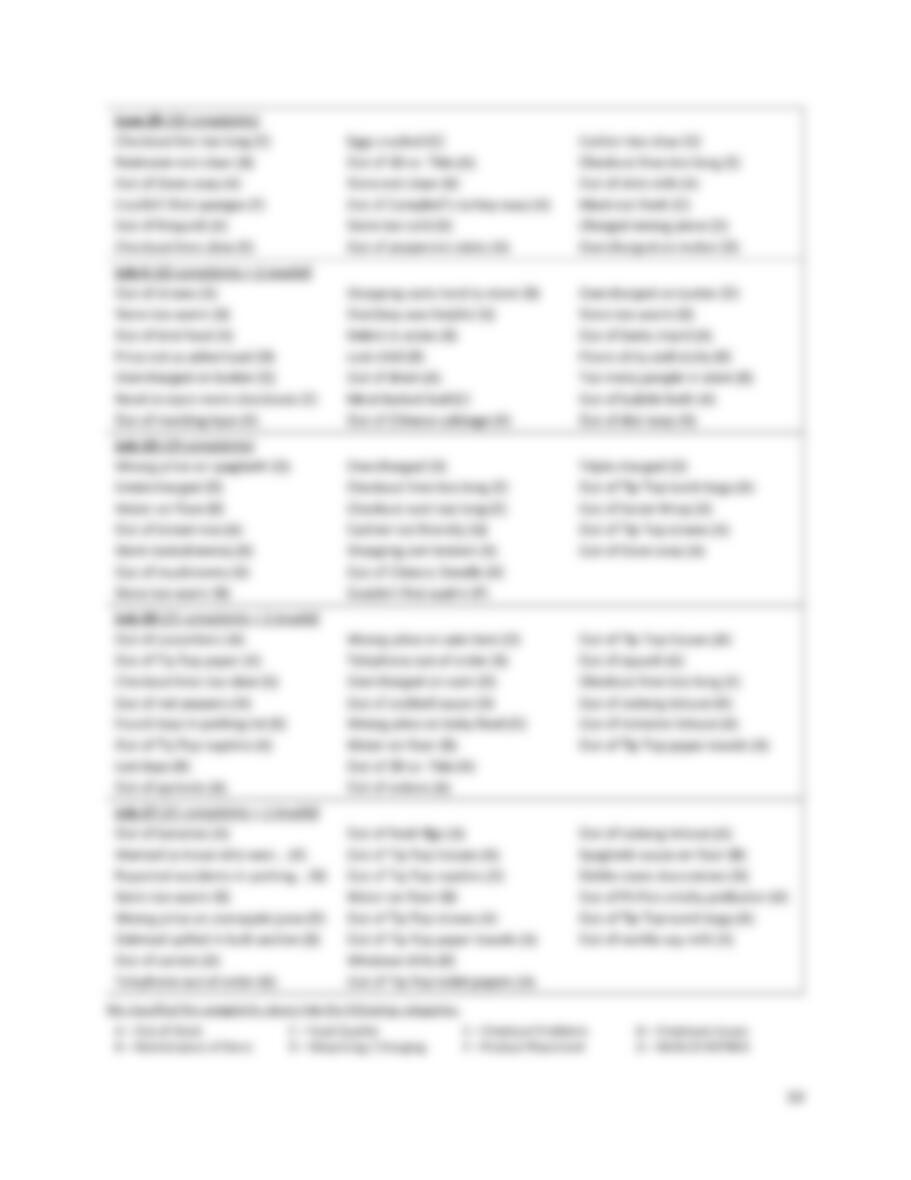
A. Check Sheet Analysis
Complaints
Date: Tuesdays
TOTAL
Jun 1
Jun 8
Jun 15
Jun 22
Jun 29
Jul 6
Jul 13
Jul 20
Jul 27
A
Out of Stock
II
IIII
III
IIII
IIII I
IIII III
IIII II
IIII IIII
III
IIII IIII
II
60
B
Maintenance
of the Store
III
IIII
III
III
III
IIII II
IIII
III
IIII II
39
C
Food Quality
IIII II
IIII II
IIII I
IIII
II
I
27
D
Mispricing and
Extra Charging
III
III
IIII II
I
II
III
IIII
III
I
27
E
Checkout
Problems
II
II
I
III
I
II
II
13
F
Product
Placement
II
I
III
I
I
8
G
Issues against
Employees
II
I
I
I
I
6
TOTAL
21
20
23
17
18
20*
19
21*
21*
180
*Note that we considered the following complaints invalid: (1) Stockboy was helpful, (2) Found keys in parking lot,
(3) Wanted to know who won the lottery. See the Appendix for the Case Study, complaints are marked with letters.
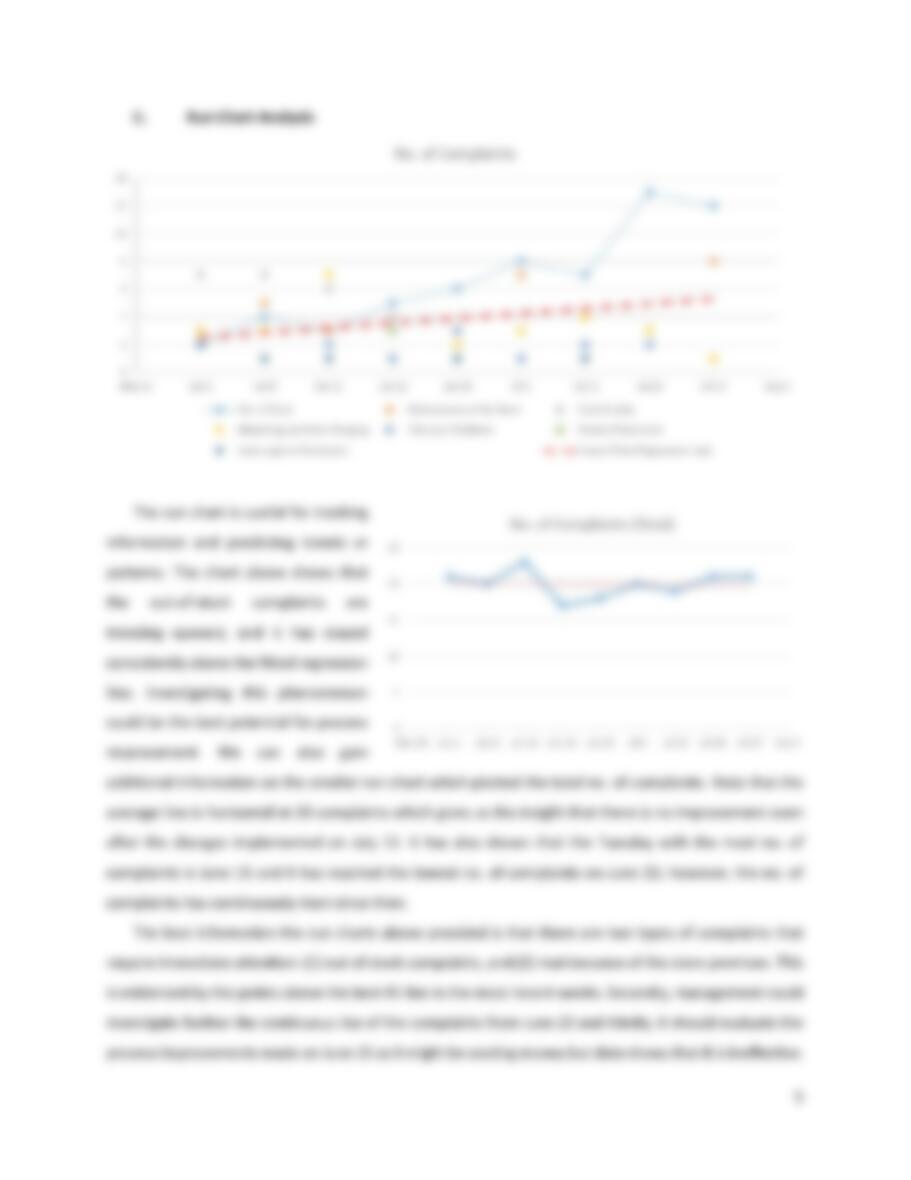
The check sheet is a structured, prepared form for collecting and analyzing data. This is a generic data
collection and analysis tool that can be adapted for a wide variety of purposes and is considered one of
the seven basic quality tools. It is a good first step in understanding the nature of the problem, as it is both
simple and effective, it provides a uniform data collection tool. It is very useful to help distinguish opinions
from facts in the Define and Measure phase of the Lean Six Sigma DMAIC framework.
In the case of the Stop ‘n Go Supermarket, the check sheet is use to identify the sources of the
customer dissatisfaction by its causes. The most frequent complaint as shown in the check sheet table is
the inventory problem, where customers are dissatisfied as the goods they are looking for are out of stock.
It has also help us understand how the problems are evolving over time. For example, food quality is
the most frequent issue in the first few weeks but the store appears to have taken this problem under
control as the last three weeks has shown no complaints on this area; thus, it is not something to worry
about even though it is still the highest third in the list.
Then, maintenance of the store is clearly a serious problem as it is the second most frequent complaint
and the store always get at least three complaints per day and there is no sign of decline.
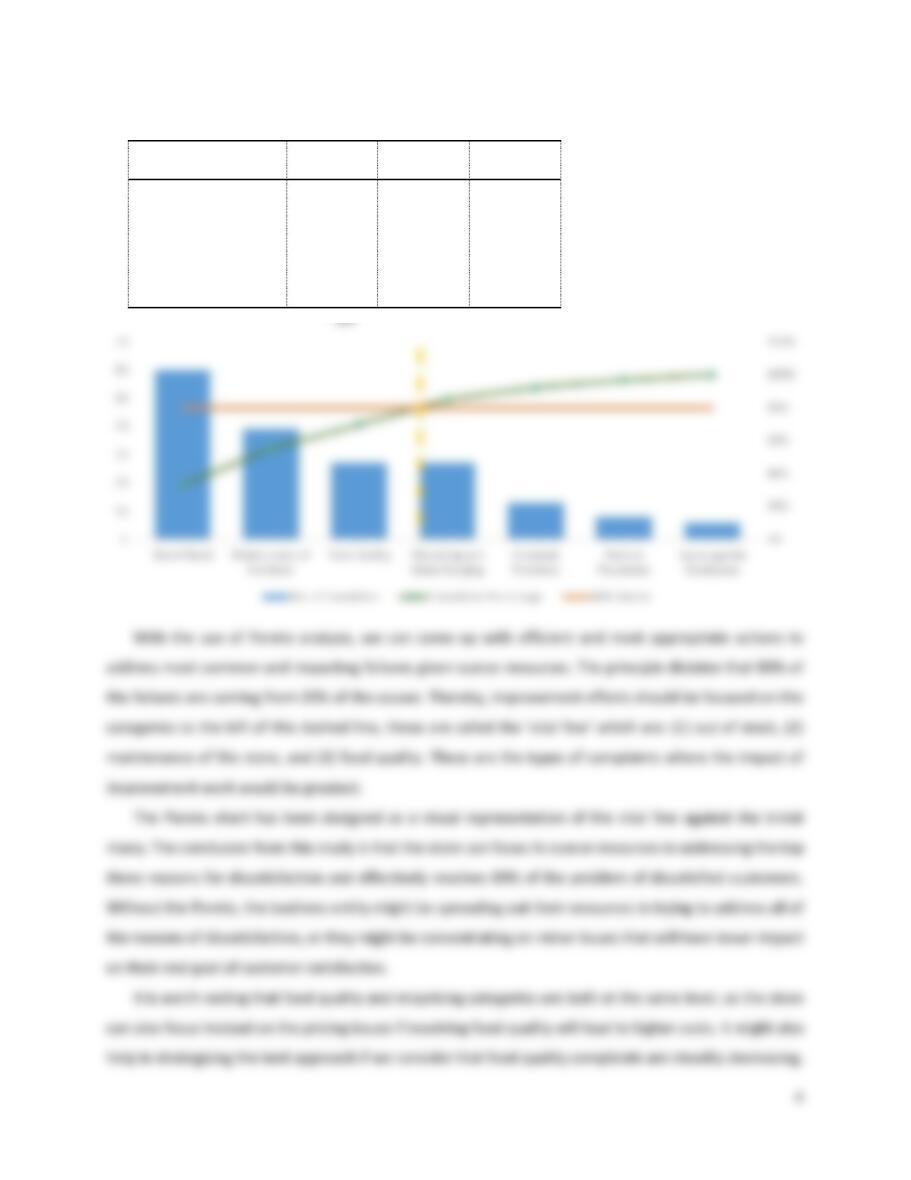
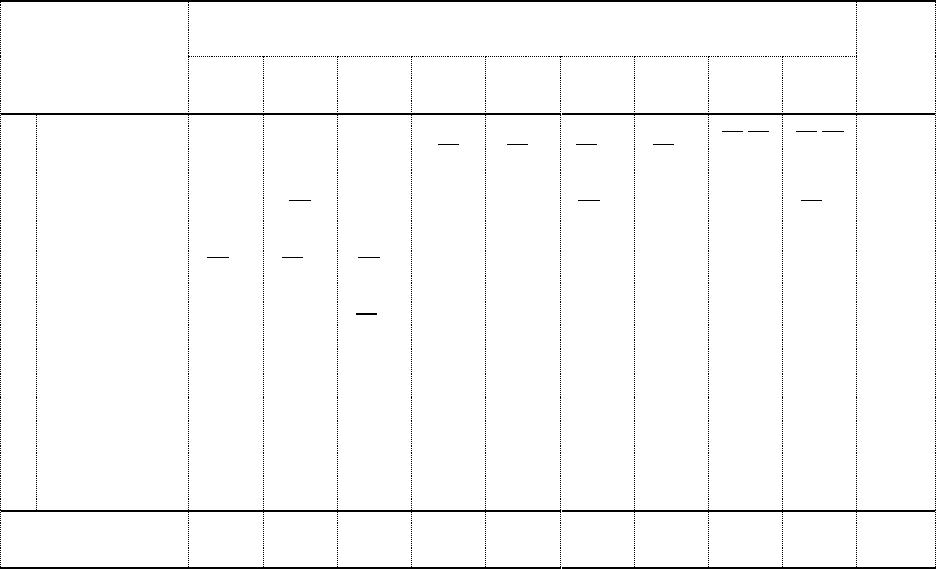
B. Pareto Chart Analysis
Complaints
No. of
Complaints
Cumulative
Cumulative
Percentage
Out of Stock
60
60
33%
Maintenance of the Store
39
99
55%
Food Quality
27
126
70%
Mispricing
27
153
85%
Checkout Problems
13
166
92%
Product Placement
8
174
97%
Issues against Employees
6
180
100%
The Pareto principle also known as
the 80-20 rule is derived from an
Italian economist’s observations
that 80% of the effects are coming
from 20% of the causes. As a tool in
Six Sigma, the goal is to come up
with efficient and most appropriate
actions to address most common
and impacting failures.