Benjamin Colman
StockUp Management
1. Moving Average Forecast
Demonstrate using at least one of the nine product categories how moving average forecasts
might inform replenishment decisions. If this forecasting technique does not apply, explain the
shortcomings.
• Analyzed Category 1 to determine the forecast of sales using a moving average.
• Utilized a 4-day moving average.
• The forecast is difficult to interpret but indicates need for a new method of analysis.
• StockUp Management should not make any major replenishment decisions, until further
analysis is conducted.
Details:
After analyzing the data with a moving average, I have determined that this is not the
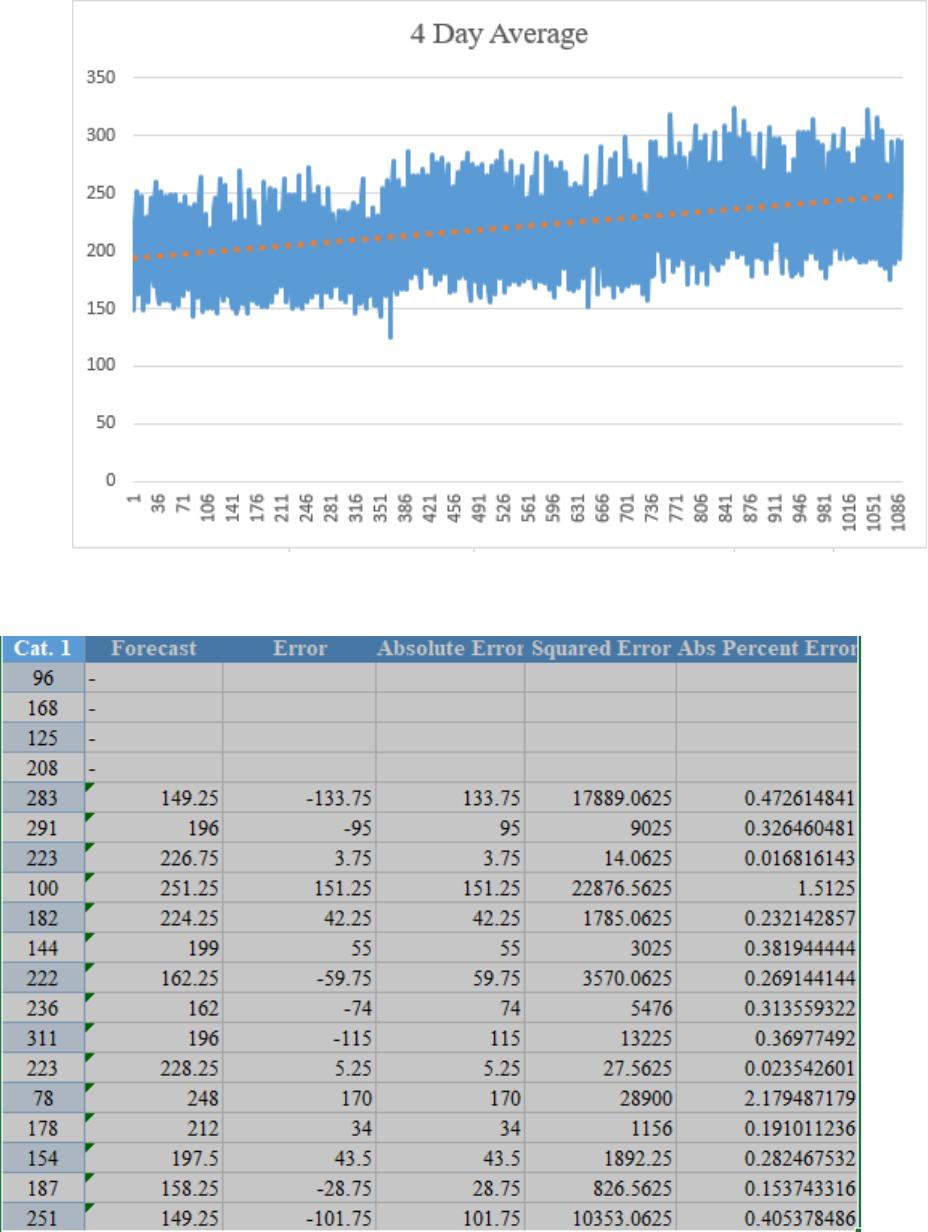
appropriate forecasting technique. As evident in Figure 1, it is difficult to interpret the data with
this method making it difficult for a manager to determine when to replenish their sales. This
chart does not accurately indicate the number of sales for product 1 nor its replenishment
frequency. Furthermore, as evident in (Figure 2), the forecast has huge errors and completely
wrong from the actual numbers proving the lack of accuracy in this method.
Analyzing moving averages is not the best way to forecast business decisions. This
method does not consider unusual events, seasonal spikes in product demand and other factors
that may affect a target market throughout the year. There is a reason why this technique is
reffered as “smoothing.” Moving average’s transform the data into appearing in a consistent
(smooth) pace regardless of an event that changes the increase or decrease in sales supply during
a year. However, as evident by the data examined moving averages can be hard to interpret and
can misrepresent the data, often lead to incorrect business decisions by companies.
Benjamin Colman
StockUp Management
Figure 1
Figure 2
Benjamin Colman
StockUp Management
2. Regression Based Forecasting
Demonstrate using at least one of the nine product categories how regression based forecasting
might inform replenishment decisions. If this forecasting technique does not apply, explain
shortcomings.
Details:
• Analyzed Category 1 to determine the forecast of sales using a regression based forecast
over a period of 3 years.
• The forecast is inaccurate at forecasting product sales demonstrating significantly high
error rates
• StockUp Management should not make any major replenishment decisions, until further
analysis is conducted.
• The quantity of products should be slightly increased to ensure accurate shipment to
stores.
• Sales of StockUp Management are the dependent variable, whereas, time period is the
independent variable being measured.
• The value of intercept is 192.93
• The value of slope is 0.0503
Details:
Regression is a method which estimates if a significant relationship exists between a
dependent and independent variable. In this case, the sales are the dependent variable, and the 3–
year period is the independent variable. While regression analysis is sometimes a better method
of forecasting because it takes more data into account, this can also lead to a discrepancy in the
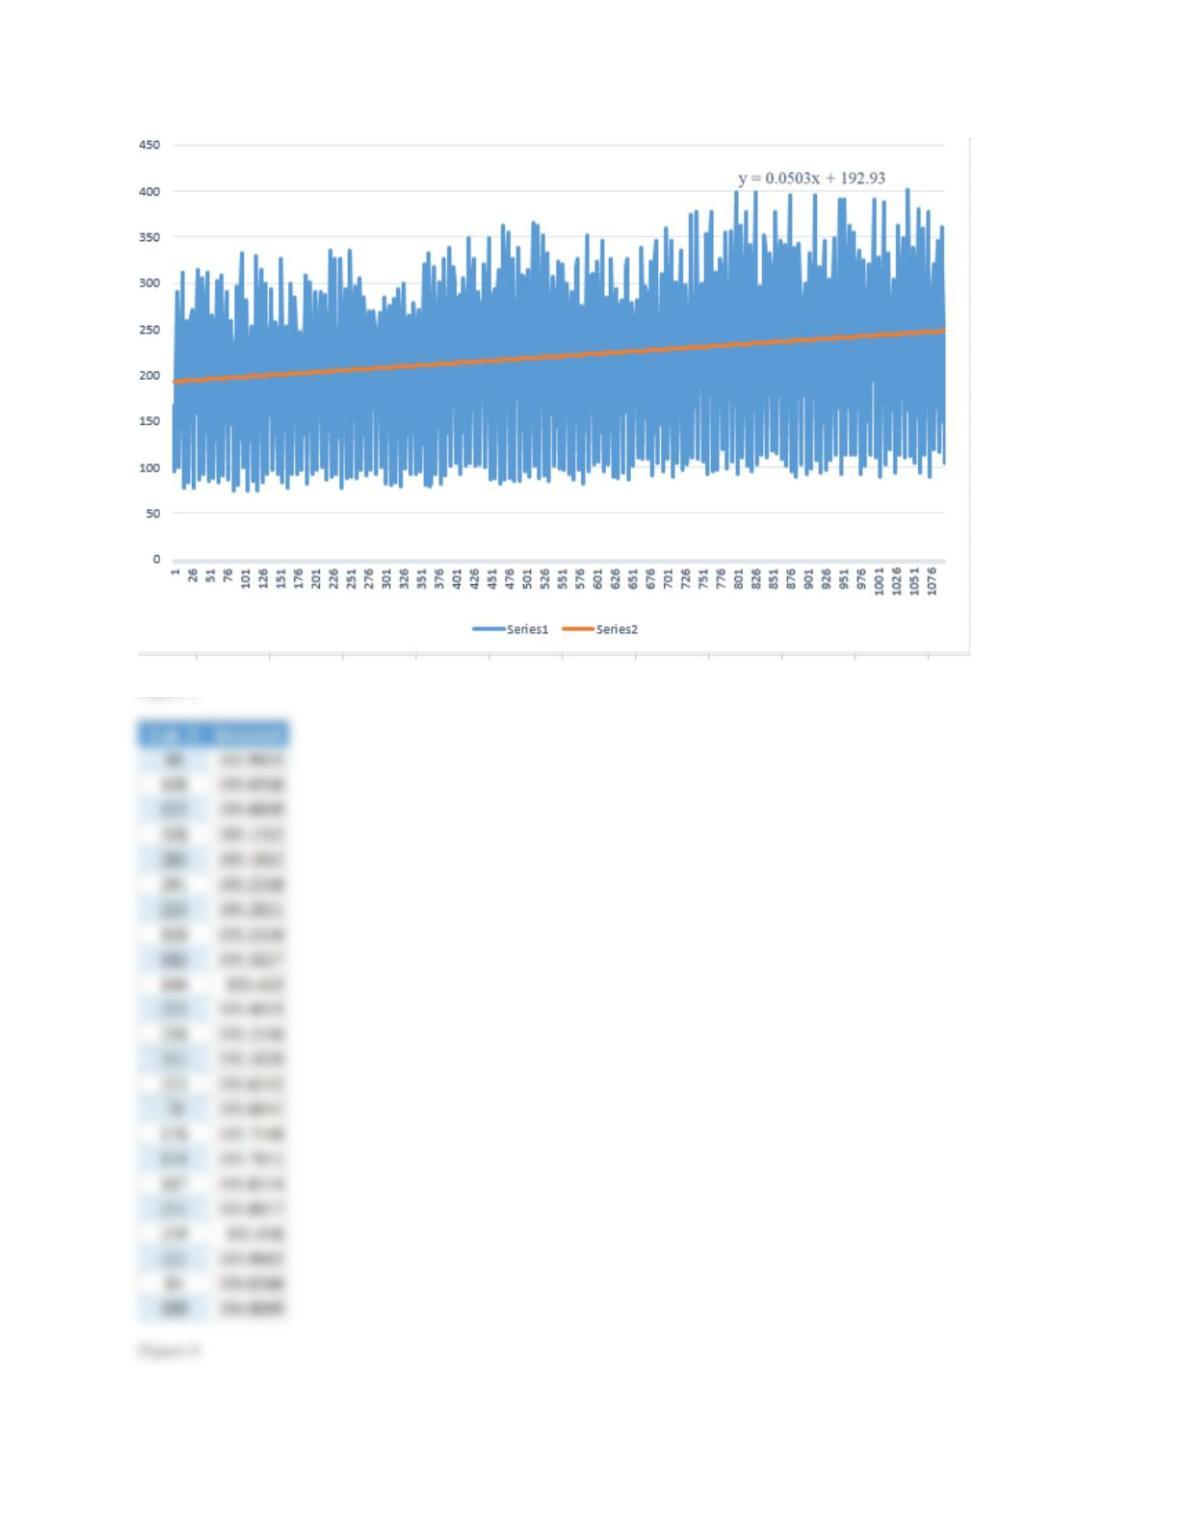
results. As evident in Figure 3, the results of the regression forecast (Orange line) for Category 1
do not match the actual numbers (Blue Lines) for Category 1. Furthermore, as evident in Figure
4, the forecasted numbers per day are completely different from the actual category 1 numbers. I
would, recommend that StockUp Management looks at day, month and year effects for better
forecasting of their supply sales needs to acquire more insight into patterns.
Benjamin Colman
StockUp Management