STARBUCKS COFFEE
Remote Analysis
MHA – October 2001
Ecole Hôtelière de Lausanne
1
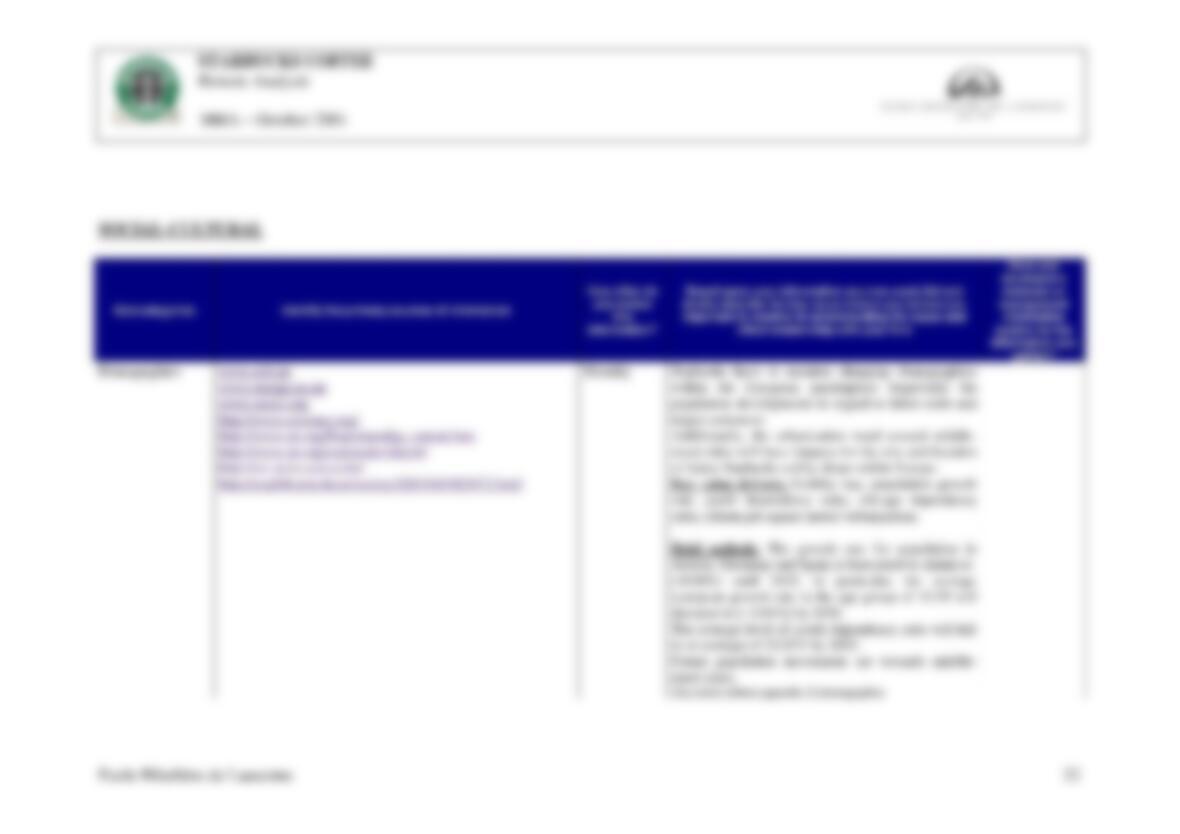
ECONOMIC
Sub-categories
Identify the
primary sources
of information
How often do
you review this
information?
Based upon your information sources used, list and briefly describe the key value
drivers you believe are important to monitor in understanding the cause and effect
relationship with your firm.
Have you developed a
database or management
information system for the
information you gather?
Key measures of
economic well being
Eurostat
World Bank
OECD
Domestic
Statistic Offices
UNECE – UN
Economic
Commission for
Europe
European
Central Bank
Monthly
Key measure of economic well being and Starbucks
Europe is a non-homogeneous union of countries. Therefore, the key measures of
economic well being may help Starbucks in designing the path for its expansion
strategy into Europe. The ideal countries to start the expansion process would be
those with high level and rapid growth of output, low involuntary unemployment
and stable prices.
KEY value drivers:
▪ GDP (Gross Domestic Product)
▪ Private consumption
Brief outlook on the key value drivers
Real GDP growth in the Euro area is projected to decline from 3.4% in 2000 to a
range from 2.2 to 2.8% in 2001, and to remain in a range from 2.1 to 3.1% in 2002.
Domestic demand is expected to decelerate and the contribution of external trade to
growth is projected to weaken significantly in 2001 and to be broadly neutral in
both 2001 and 2002.
Private consumption growth is expected to decline from 2.7% in 2000 to 2.2-2.6% in
2001, and to be 2.0-2.3% in 2002. This reflects continued strong growth of real
disposable income, mainly due to the implementation of tax reductions in a number
of countries.
After a year of particularly strong performance, economic growth in the OECD area
has been weakening since the autumn of 2000. The 2001 growth rate is projected to
be half that of 2000, at around 2% and the long-running reduction in unemployment
is projected to come to a halt. However, the forces dampening economic growth are
projected to dissipate in the second half of 2001, leading to a growth rate of 2.5% to
3% over the following twelve months. Inflation is expected to remain low.

STARBUCKS COFFEE
Remote Analysis
MHA – October 2001
Ecole Hôtelière de Lausanne
2
(See Appendix 1: ECONOMIC ACTIVITY)
Economic cycles
Eurostat
World Bank
OECD
Domestic
Statistic Offices
Monthly
Economic cycles and Starbucks
Depending on the economic cycle Europe, and each of its components, is going
through, Starbucks may decide to delay/accelerate its expansion strategy.
Starbucks should pay special attention in detecting if a country is going through a
bout of inflation and/or recession.
KEY value drivers:
▪ Unemployment rate
▪ CPI (Consumer Price Index).
▪ Rate of inflation
Brief outlook on the key value drivers
(See Monetary/fiscal policy and Labor market and income distribution)
(See Appendix 8: LABOR MARKET)
(See Appendix 2: PRICE STABILITY)
Monetary / fiscal
policy
Eurostat
Domestic fiscal
regulations
European
Central Bank
Weekly
Monetary/fiscal policy and Starbucks
The European Central Bank dictates the major monetary policy issues. High interest
rates may affect Starbucks in its investments in capital goods and other interest-rate-
sensitive spending. In addition, high interest rates might lower Starbucks’ asset
prices when using the concept of present value.
Fiscal policies may differ from one country to another and, even though they may
not affect Starbucks’ operating results, they may have an influence on the net
results. In addition, taxation affects investment and potential output.
KEY value drivers (Monetary):
▪ Harmonized indices of consumer prices
▪ Interest rates

STARBUCKS COFFEE
Remote Analysis
MHA – October 2001
Ecole Hôtelière de Lausanne
3
Brief outlook on the key value drivers (Monetary)
The overall “Harmonized index of Consumer Prices” is projected to remain in a
range from 2.3 to 2.7% in 2001, before falling back to a range of 1.2 to 2.4% in
2002. The projected persistence of the high average level of inflation in 2001 is
explained by an increase in domestic prices. Developments in energy and food
prices are expected to strongly influence the pattern of overall HICP inflation over
the near term. The contribution of food price inflation is expected to rise by roughly
½ % between 2000 and 2001. This impact is assumed to be temporary and largely
disappear in 2002.
(See Appendix 2: PRICE STABILITY)
KEY value drivers (Fiscal):
▪ Corporate income taxes
▪ Consumption taxes
▪ Social insurance taxes, or payroll tax.
▪ Property taxes
Brief outlook on the key value drivers (Fiscal)
Since the late 1990s many EU countries have cut tax rates. However, the tax burden
in the EU area remains much higher than in most other economies. The tax mix is
also different, with high tax wedges on labor and stronger reliance on consumption
and environmentally-related taxes. Recent measures targeted at lowering the tax
burden on labor have had promising results in terms of employment growth. Greater
reliance on property taxes could be envisaged. The common features of EU tax
systems are: a) high tax wedges on labor (the average effective tax on labor in the
UE area appears to be about 15% higher than in the US); b) consumption taxes
account for a large share of total tax revenues (effective tax rates on consumption in
the UE are, on average, higher than in most of OECD countries); c) high
environment-related taxes; d) low taxation of capital; e) narrow corporate income
tax bases (low corporate income tax revenues and OECD-standard statutory rates on
corporate profits).

STARBUCKS COFFEE
Remote Analysis
MHA – October 2001
Ecole Hôtelière de Lausanne
4
Capital market
behaviours
Eurostat
Nasdaq
Weekly
Capital market behavior and Starbucks
Volatile markets may have an effect in the European expansion strategy of
Starbucks, especially if the firm is to implement joint-ventures with companies
which are operating in the public market.
KEY value drivers (Market Volatility):
▪ Implied stock market volatility
▪ Stock market indices
▪ Multi-market exchanges (Nasdaq Europe)
Brief outlook on the key value drivers (Market Volatility):
The European Stock Exchange Market is undergoing a relatively significant level of
volatility. Globalization has a direct effect upon public market’s behavior. 11th
September terrorist attacks have lead to a growing uncertainty, hence higher
volatility. As a result, the European market, although at a lesser extent has also
suffered from this situation. Continued uncertainty and more complex market
behavior are to shape the short term in euro area stock markets.
KEY value drivers (Price of Money):
▪ Interest rates
▪ Long-term government bond yields
Brief outlook on the key value drivers (Price of Money):
Since the second quarter of year 2001 there’s been a tendency towards a decline in
the long-term retail bank interest rates. This declining tendency applies as well to the
short-term interest rates in the euro area (one/three/six and twelve – EURIBOR),
falling steadily during the third quarter of year 2001. By the 4th quarter 2000 the
interest rates stood in a range from 4.8 to 5.2, whilst at the end of the 3rd quarter
2001 the decline placed the interest level in a range from 3.3 to 3.7. Long–term
government bond yields in the euro area decreased between end-August and
October. The differential between ten-year government bond yields in the US and
the euro area moved deeper into negative territory from –10 basis points at end–
August to around –25 basis points on October.
(See Appendix 5: THE PRICE OF MONEY)

STARBUCKS COFFEE
Remote Analysis
MHA – October 2001
Ecole Hôtelière de Lausanne
5
Trade and industrial
policies
Eurostat
Eur-Lex
Domestic trade
and industrial
regulations
Yearly
Trade and industrial policies and Starbucks
Tough trade and industrial policies may prevent Starbucks from achieving a
successful performance in the European marketplace. As a result they should be
taken into account in order to design the most efficient and profitable strategy of
expansion.
Trade involves economic exchange between countries. Most of the European
countries belong to the European Monetary Union and therefore, have the same
currency unit. As a result, the risk of sudden changes to exchange rates within
Europe is very low.
However, Starbucks will need to check the exchange interest rates between EU and
non-EU countries and take active action against possible negative exchange rate
implications.
KEY value drivers:
▪ EURO exchange rates
▪ Intra-euro area and extra-euro area trade volume
▪ Balance-of-payments account
Brief outlook on the key value drivers
Last developments in the foreign exchange markets have been mainly dominated by
the tragic events in the US. Market uncertainty has risen sharply on a temporary
basis. Accordingly , some downward pressure on the US dollar has been observed.
The nominal effective exchange rate of the euro stood approximately 3 ½ above its
average level in 2000.
The increase in the extra-euro area goods surplus since the beginning of the year is
mainly attributable to a fall in the value of imports.
The contribution of net exports to GDP growth is expected to be broadly neutral in
2001 and 2002. Export growth – including intra-euro area trade is projected to
weaken from 12.2% in 2000 to a range of 5.0-7.9% in 2001, and to 4.1-7.3% in
2002.
(See Appendix 6: TRADE LEVEL)

STARBUCKS COFFEE
Remote Analysis
MHA – October 2001
Ecole Hôtelière de Lausanne
6
Labor markets and
income distribution
Eurostat
World Bank
Domestic labor
regulations
Yearly
Labor markets, income distribution and Starbucks
Increasing labor costs and increasing migration rates should play a significant role in
defining the human resources objectives of Starbucks in Europe. The income
distribution within each of the European countries will help in defining the target
markets for the European expansion. The unemployment rate may also be useful, as
it is one of the measures that reflect the state of the business cycle.
KEY value drivers (Labor Cost):
▪ Nominal and real unit labor costs
▪ Employer-provided training and social contributions
Brief outlook on the key value drivers (Labor Cost):
During 2001 and 2002 it is expected a unit labor cost growth, which is reflected in
the projected rise of domestic price levels. While unemployment rate is expected to
fall gradually, it has been assumed that the generally restrained wage growth
experienced in recent years will broadly continue in 2001 and 2002, although to a
lesser extent than in the past. The response on wage growth to the temporary rise in
inflation is projected to remain limited. Relative to the very low growth experienced
last year, unit labor cost growth is projected to rise moderately in 2001, as a result of
higher wages and temporarily lower productivity growth from cyclical factors.
Thereafter unit labor cost growth is projected to fall back a little in 2002, by the
projected increase in productivity growth.
The group of Spain, Greece, Italy and Portugal is projected an average unit labor
cost growth of 2.7% in 2001 and 2.6% in 2002. Denmark, Finland, Norway and
Sweden are projected an average unit labor cost growth of 2.7% in 2001 and 2.2% in
2002. Finally, Austria, Belgium, France, Germany, Iceland, Ireland, Netherlands,
Switzerland and the United Kingdom are projected an average growth of 2.1% in
2001 and 2.0% in 2002. The average unit labor cost growth for the OECD–Europe
countries is projected of 2.0% in 2001 and 1.9% in 2002, and for the EU countries of
1.7% both in 2001 and 2002. In the US it is projected a 3.5% labor unit cost growth
in 2001 and of 1.8% in 2002, while in Japan –0,7% and –0,5%, respectively.
(See Appendix 7: LABOR COSTS)
(See Appendix 3: LEVEL OF TAXATION)
STARBUCKS COFFEE
Remote Analysis
MHA – October 2001
KEY value drivers (Labor Market):
▪ Employment rate
▪ Unemployment rate
▪ Activity rate
▪ Wages and labor productivity
Brief outlook on the key value drivers (Labor Market):
The standardized rate of unemployment for the euro area stood at 8.3% in August,
unchanged compared with July. The average decline in the absolute number of
unemployed in the second quarter stands on 13.000 on average per month, which
confirms the slowdown in the decline of unemployment recorded since the 1st
quarter 2001. Employment growth slowed down further in the 2nd quarter of 2001,
recording a decline from 2.9% in the 1st quarter to around 1.6%. Following the
pattern of economic growth, the projected slow-down in employment growth is
stronger in the United States than in the European Union.
The labor market mismatches are: unemployment, labor shortages, skill deficiencies