H
910M64
A BOMB IN YOUR POCKET? CRISIS LEADERSHIP AT NOKIA INDIA
(A)
Hima Bindu and Monidipa Mukherjee wrote this case under the supervision of Professor Charles Dhanaraj solely to provide material
for class discussion. The authors do not intend to illustrate either effective or ineffective handling of a managerial situation. The
authors may have disguised certain names and other identifying information to protect confidentiality.
Richard Ivey School of Business Foundation prohibits any form of reproduction, storage or transmission without its written
permission. Reproduction of this material is not covered under authorization by any reproduction rights organization. To order copies
or request permission to reproduce materials, contact Ivey Publishing, Richard Ivey School of Business Foundation, The University
of Western Ontario, London, Ontario, Canada, N6A 3K7; phone (519) 661-3208; fax (519) 661-3882; e-mail cases@ivey.uwo.ca.
Copyright © 2011, Richard Ivey School of Business Foundation Version: 2011-02-01
Singapore Airlines flight SQ 408 from Singapore had just landed at the Indira Gandhi International Airport
at Delhi. It was past 10:00 p.m. on August 14, 2007, the eve of India’s Independence Day. D. Shivakumar,
managing director of Nokia India, was cutting short his plans to visit Nokia’s headquarters in Finland and
was returning to Delhi. Throughout the day, Poonam Kaul, director of communications at Nokia India, had
been sending text messages to Shivakumar, keeping him abreast of the developments. Her last message
was short but disturbing: “The media is hostile. We have asked the crisis management team to meet
tonight.”
Indian media had been focusing on a product advisory (see Exhibit 1) that Nokia had issued from its global
headquarters in Finland earlier that day. The advisory warned Nokia phone owners that a particular batch
of BL-5C batteries, manufactured by Matsushita, a Nokia supplier, was found to be overheating while the
phone was being charged. Nokia offered free replacement batteries in the advisory. The Indian media was
turning the advisory into a sensational news story, covering incidents of mobile phone explosions in far-
flung Indian states. Headlines such as, “Are you walking around with a bomb in your pocket?” were
flashed on television screens and caused panic among millions of Nokia mobile phone users in India. Much
of the media frenzy caught the Nokia management in both India and Finland by surprise. The brand image
and market leadership, which Nokia had carefully cultivated in India, was suddenly under severe threat.
Shivakumar was anxious to meet with his team, knowing it was going to be a long night — perhaps one of
the most crucial nights of his career.
NOKIA CORPORATION
Nokia Corporation acquired its name from the Nokianvirta River in Finland. It started as a paper pulp
business in 1865, and over the years morphed into a global telecommunications leader. Operating in more
than 150 countries around the world, Nokia manufactured mobile devices and telecom equipment, and
delivered mobile content services. Globally, it reported net sales of $66.7 billion1 for 2007, with an
1 All currencies are in US$ unless otherwise stated.
This document is authorized for use only in Prof. Chetan Joshi’s EPGM at Indian Institute of Management – Calcutta from Feb 2020 to Aug 2020.

Page 2 9B10M064
operating profit of about €10.46 billion. Nokia’s two largest markets, China and India, accounted for 23
per cent and 15 per cent of total revenues, respectively, while Great Britain and Germany accounted for 10
per cent each.2
The 1990s were a high-growth period for the cellular industry. Nokia nurtured its brand name through print
advertising and pan-European television advertising. Deviating from the industry norms of emphasizing
the technical features of the product, Nokia appealed to the emotional benefits of buying a brand-name
phone. With an estimated brand value of $33.69 billion, the global branding consultancy, Interbrand,
ranked Nokia among the top five “Best Global Brands” in 2007.3 In spite of a highly competitive market,
Nokia had 40 per cent of the global market share in 2007, with three of its rivals, Samsung, Motorola and
Sony-Ericsson, taking 13.4, 11.9 and nine per cent, respectively. Others, including Korea’s LG and
Canada’s Research In Motion (Blackberry), held single-digit shares of the market.4
Mobile Phone Industry in India
Until the mid-1990s, the Indian telecom industry was served by two public-sector agencies — Bharat
Sanchar Nigam Ltd. (BSNL) for domestic services and Videsh Sanchar Nigam Ltd. (VSNL) for
international long-distance services. In 1997, the Indian government established the Telecom Regulatory
Authority of India (TRAI) and announced a new telecom policy that allowed privately owned operators in
the telecom industry. Since 2000, the mobile subscriber base in India had been doubling annually, reaching
about 261 million in 2007, overtaking the U.S. market and becoming the second-largest wireless network,
next only to China.5 Ten million new subscribers were being added every month. Mobile tariffs in India
were among the lowest in the world. Average (monthly) revenue per use (ARPU), a metric that was used to
assess service operators, was estimated at under $3, compared to over $50 in the United States. India used
two mobile platforms: GSM (Global System for Mobile communications) with a subscriber base of 192
million, growing at nearly 60 per cent annually, and CDMA (Code Division Multiple Access) with a
subscriber base of 68.37 million, growing annually at 53 per cent.6
Nokia India Operations
Nokia entered the Indian market in 1995, and within a decade established itself as a leader. By 2004,
Nokia’s market share in India was estimated at 70 per cent by a Wall Street Journal report, and at 76 per
cent by 2006 as reported by several market surveys7. Nokia’s marketing organization also included more
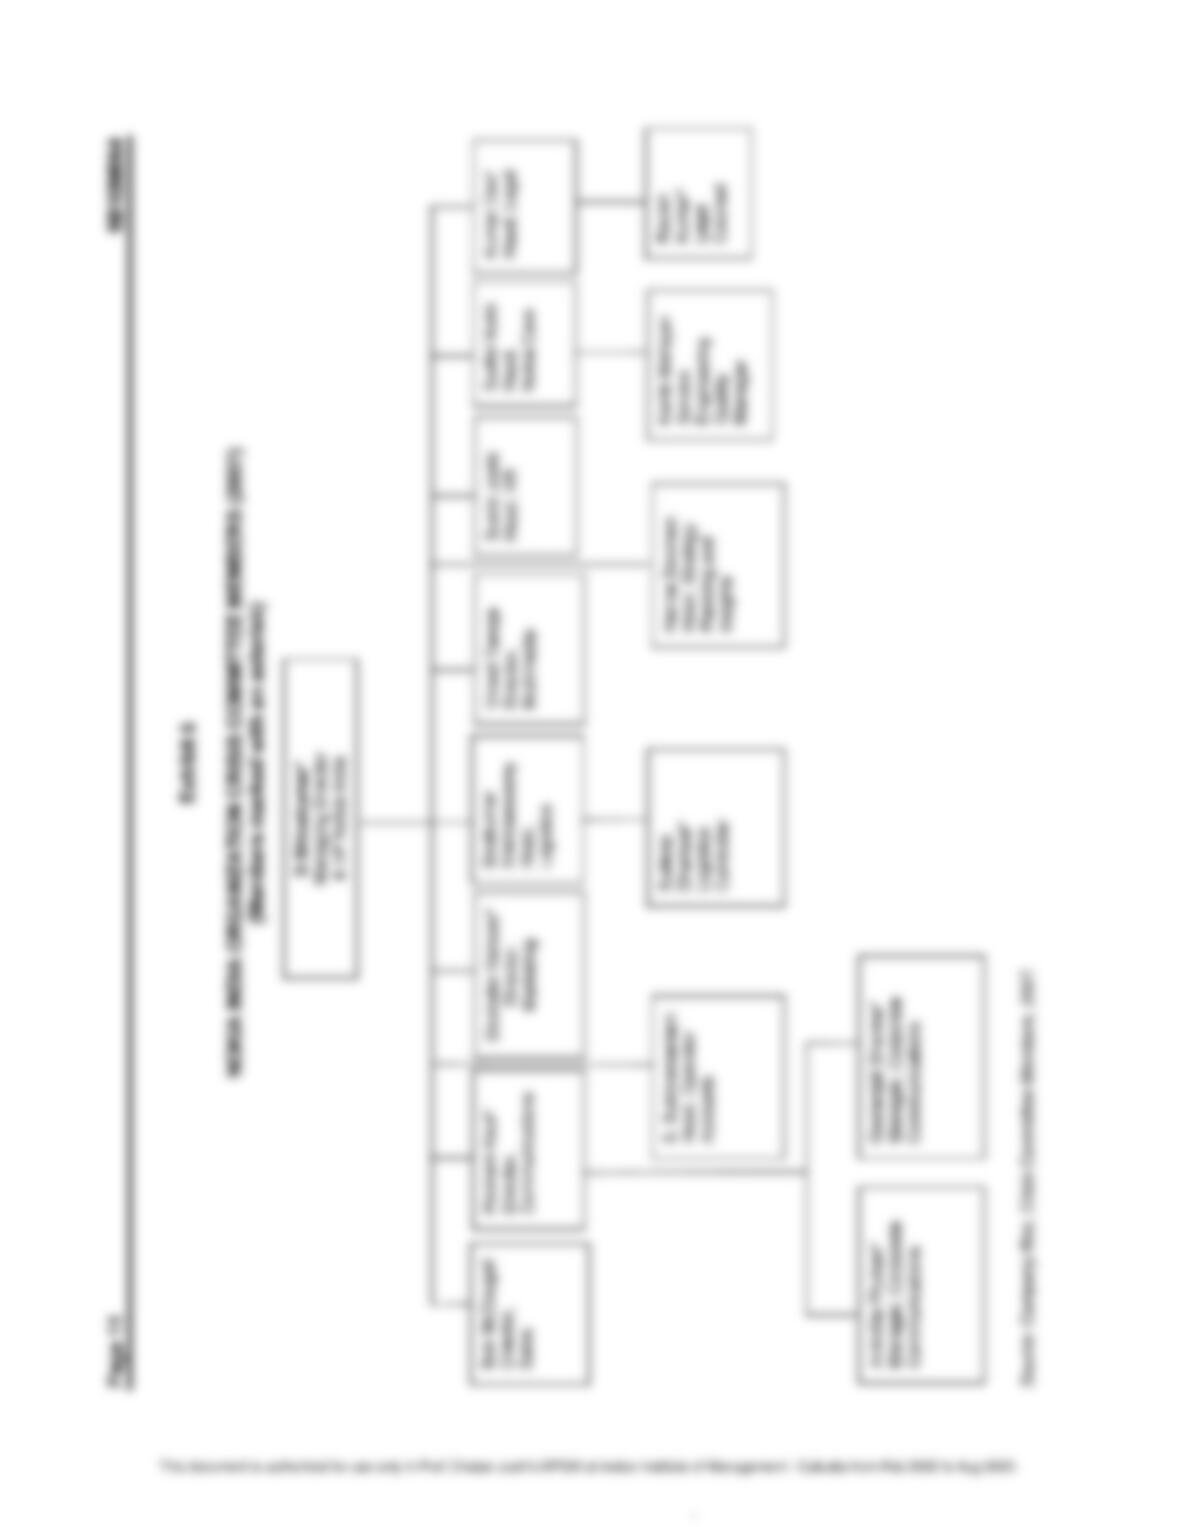
than 500 customer care centres (CCCs) and more than 600 Nokia priority dealers (NPDs) across India (see
Exhibit 2). The company had three research and development (R&D) centres in Hyderabad, Bangalore and
Mumbai. Nokia opened a manufacturing facility at Chennai, India, in 2006, and in the first 18 months,
rolled out 60 million handsets. This facility was expected to emerge as one of Nokia’s top three global
manufacturing centres. Overall, the company was growing rapidly, with employment increasing from 450
in 2004 to over 10,000 in 2007.
2 www.nokia.com/about-nokia/financials/key-data/markets, accessed July 2010.
3 Interbrand survey, www.interbrand.com/best_global_brands.aspx?year=2007 &langid=1000, accessed January 2010.
4 TelecomWorldwire, May 28, 2008, www.highbeam.com/doc/1G1-179466910.html, accessed January 2010.
5 Telecom Regulatory Authority of India Annual Report 2007-2008, pp. 17-19, www.trai.gov.in/annualreport/TRAIAR2007-
08E.pdf, accessed January 2010.
6 TRAI Annual Report, 2007-2008, www.trai.gov.in/annualreport/TRAIAR2007-08E.pdf, accessed January 2010.
7 India Resource Centre, www.ibef.org/download/inthetopspot.pdf, accessed January 2010.
This document is authorized for use only in Prof. Chetan Joshi’s EPGM at Indian Institute of Management – Calcutta from Feb 2020 to Aug 2020.

Page 3 9B10M064
CHRONOLOGY OF A CONTROVERSY
The BL-5C was one of 14 battery models used in Nokia products, and featured lithium-ion technology;
several suppliers collectively produced more than 300 million units. Matsushita Battery Industrial Co. Ltd.
of Japan was one of the battery suppliers. Nokia’s batteries were tested against internationally recognized
quality standards and Nokia’s own stringent quality requirements.
In the summer of 2007, Nokia received a few consumer complaints about BL-5C batteries; the batteries
were overheating while charging. Within a month, over 100 complaints were registered globally. In-house
analysis of the data suggested that the defects were attributable to a particular batch of batteries
manufactured by Matsushita from between December 2005 to November 2006. Following standard
operating procedures, Nokia’s global product management directed its communications team to issue a
global product advisory. The global communications and legal team was to liaise with the specific host
team of countries where the issue was expected to arise
August 11, 2007
Kaul received a call at 10:00 a.m. Indian Standard Time (IST) (7:30 a.m. in Finland) from the global
headquarters office in Finland regarding the product advisory. Kaul was informed that the advisory was
routine and was expected to plainly state the solution to the faulty battery issue. Owners of Nokia phones
would input battery numbers at Nokia’s website, which would advise the owner if his or her battery was
faulty, and if faulty, would also inform the owner about the free battery replacement process. The news
about the advisory was to be kept confidential until the formal announcement.
Shivakumar was on his way to the headquarters on the same day and had stopped over at Singapore,
Nokia’s regional headquarters. At about 1:00 p.m., Kaul called Shivakumar and expressed her concerns
about the advisory:
I was apprehensive that people in India may not differentiate between a product advisory
and a product recall. In addition, I was not sure if our customers would be able to go
online in order to check if their phone was affected, given that Internet usage is very low
in our country. Moreover, India is an open distribution market, as compared to most
developed countries, where the business is mainly through the service operator’s chain
(e.g. Verizon wireless).
While a product recall is a request to return to the maker a batch or an entire production run of a product,
usually due to the discovery of safety issues, an advisory is considered to be routine material information.
August 12, 2007
Throughout the day, Kaul and her team kept close contact with headquarters and Shivakumar. They
ensured that all data and facts concerning the incident were in place. Although it was more engaging than a
normal day, there was no sense of urgency over the product advisory.
August 13, 2007
The global advisory was to be released at 9:00 a.m. Finnish time the next day. The priority at the India
office that day was to finalize the draft of the press release. The India office communications team also
This document is authorized for use only in Prof. Chetan Joshi’s EPGM at Indian Institute of Management – Calcutta from Feb 2020 to Aug 2020.
Page 4 9B10M064
developed an action plan to deal with the press that highlighted the difference between a product advisory
and a recall in the release to the Indian press.
August 14, 2007
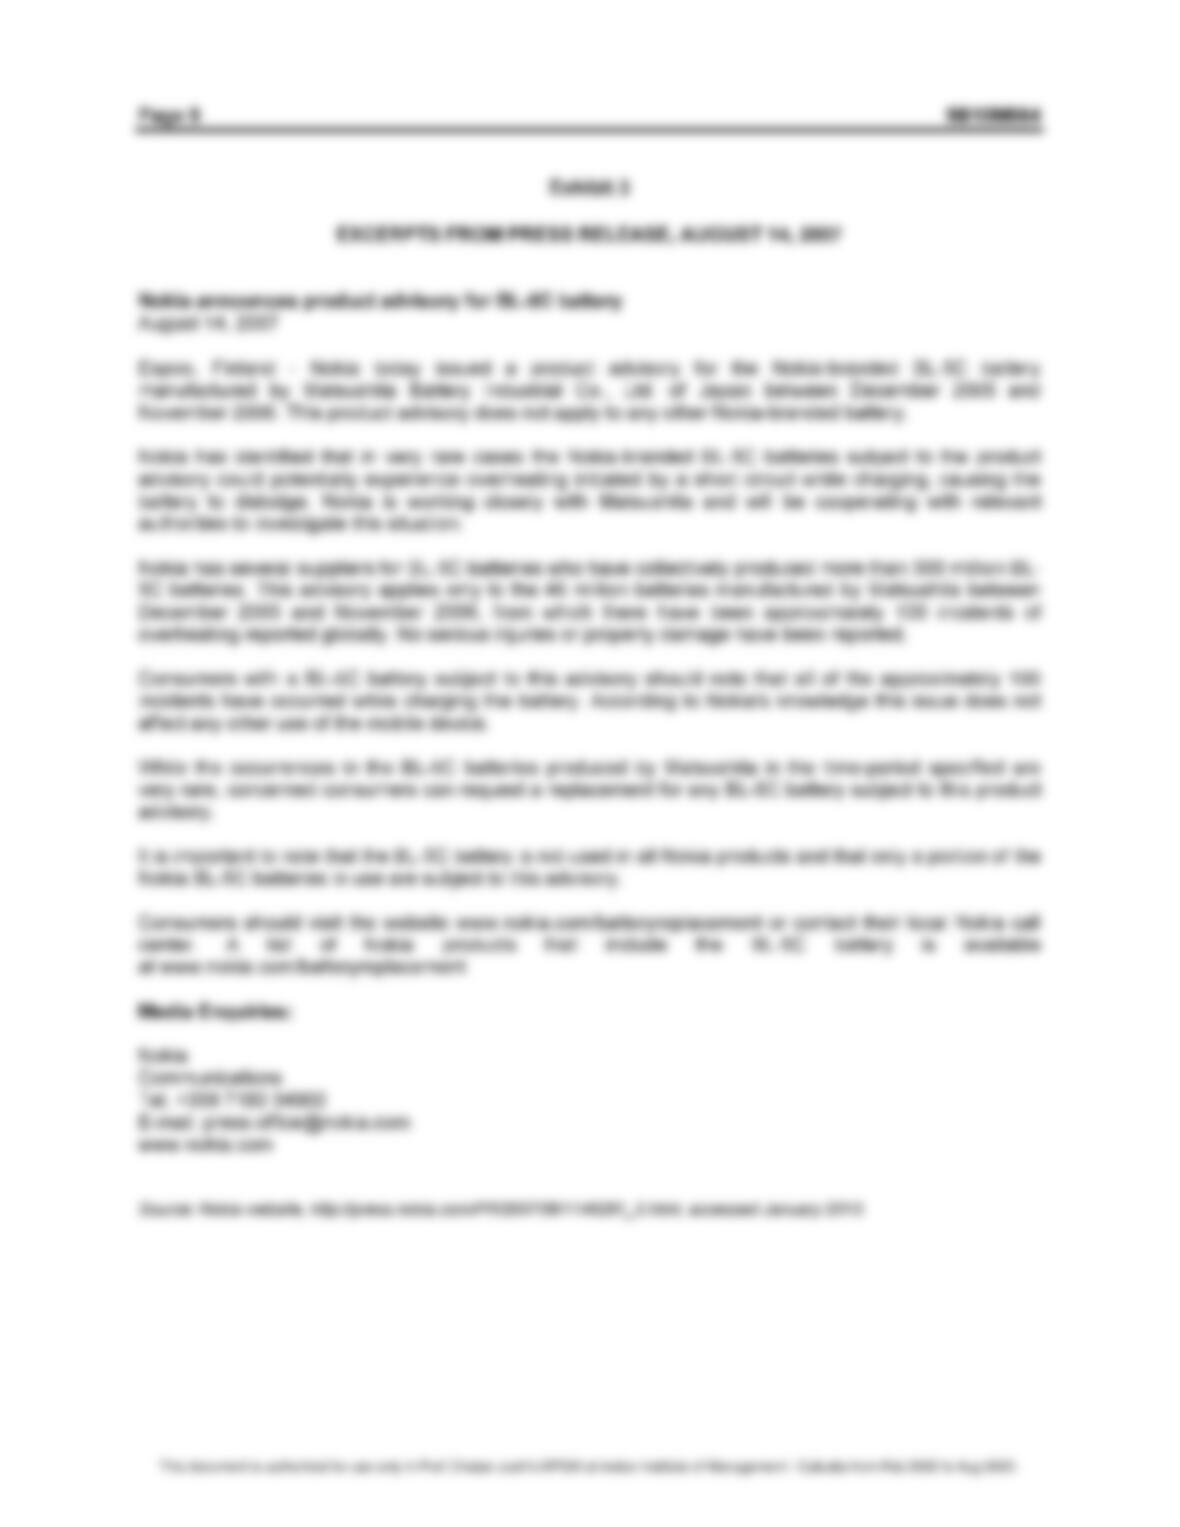
Early that morning, Nokia India issued the product advisory as a press release (see Exhibit 3) to
approximately 200 publications and media outlets. Kaul recalled:
It was a routine press release. But I continued to have the nagging feeling that this might
not work in India. I kept Shiv updated periodically. We also decided that he could proceed
to Finland as scheduled and that this product advisory did not warrant his presence in
Delhi.
As the media was notified, Sudhir Kohli, head, Nokia Care, India, went on conference call with his
regional care managers and regional general managers and explained to his team that the defective batteries
would not be replaced at the care centres and that customers would be asked to check the Nokia website to
learn whether their batteries were defective. Customers had to provide information via the website and
would then receive a new battery within 15 days. The Nokia call centres would operate normally with no
extended working hours. Kohli described the situation as follows:
My main goal was to let the care centre managers know that the advisory was a routine
one and did not warrant concern. I just wanted to make sure that they all knew that it was
simple and routine. But, as I finished the conference call, I was anticipating operational