1
Zoe
ENGL 1301.033
24/10/16
Special Needs Education in Texas
In today’s society, education has become the baseline for adulthood, and a
starting place for self-discovery and empowerment. Being a student can be
difficult, and I think it’s easy to acknowledge that some may need more help
than others. Since 1975, Congress has legally required all public schools to
provide particular services to their special needs students, or students with
disabilities. According to the Rules & Regulations for Special Education,
special education entails “specially designed instruction, at no cost to the
parents, to meet the unique needs of a child with a disability…” (TEA, A-28).
Despite these measures, some states’ percentages for students enrolled as
special needs have dropped dramatically in recent years. Amongst the most
shocking, is Texas. In 2004, the Texas Education Agency (TEA) implemented
an 8.5% benchmark – a goal for the percentage of students receiving special
education services (Rokus, 1). Since then, numbers have dropped rapidly,
before the statewide Texas average reached the coveted 8.5% in 2015.
Therefore; are Texas numbers really so low? Or are they denying services to
students who need them?
Disability Risk Factors
Studies have shown that living under the poverty line or in inadequate living
conditions are factors that put children at a higher risk of developing mental,
behavioral, and developmental disorders (MBDDs). Other factors include
inadequate insurance, poor parental mental health, low family income,
employment difficulties, and living in neighborhoods in poor condition (CDC,
par 1). Research shows that in some sense, poverty levels can be related to the
2
number of children with disabilities. United States poverty is at 16%, and Texas
is at 17.5%, ranking it 38th in the country (TalkPoverty). However, the poverty
rate for children in Texas is 7.5% higher than that of the total state population.
In families living below the poverty line, it is more likely that there would be a
prevalence of marital violence, substance abuse, or community violence; all of
which are disability risk factors. Therefore, would it not be logical that states
with above-average rate of disability factors (such as Texas), would have higher
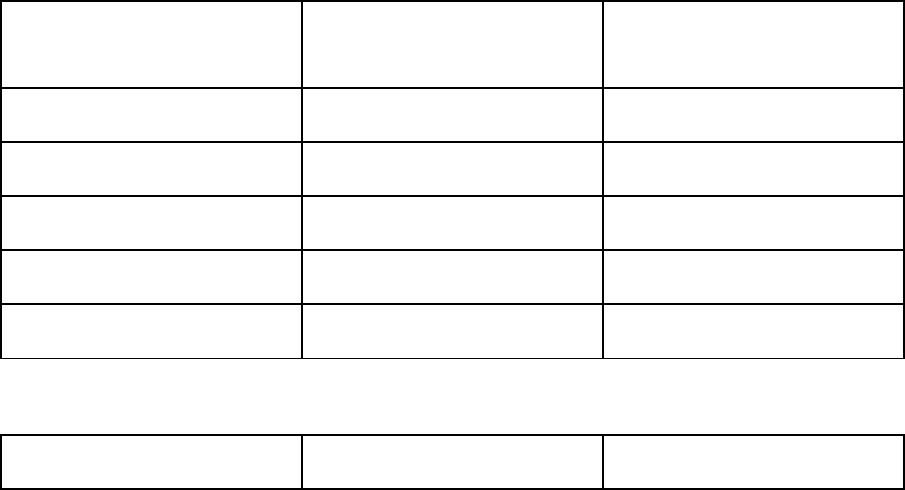
special ed rates? Listed below are the top 5 states in the US with the highest
poverty rates, compared to the percentage of their students recorded to have
disabilities.
Table 1. Poverty rates and rates of students enrolled as disabled, by state
State
Poverty Rate (%)
Students w/ Disabilities
(%)
Louisiana
23.1
11.0
Mississippi
22.1
12.0
Arizona
21.2
11.4
West Virginia
20.6
15.7
Kentucky
20.0
13.6
Texas
17.5
8.5
Data sources: National Center for Education Statistics and World Atlas
As you can see, the states with the highest poverty rates have some of the
highest special ed enrollment rates in the country. These percentages are
seemingly proportional, so it’s surprising to see that Texas (with a poverty rate
of 17.5%) has the lowest special ed numbers in the country.
3
Effects of The Benchmark
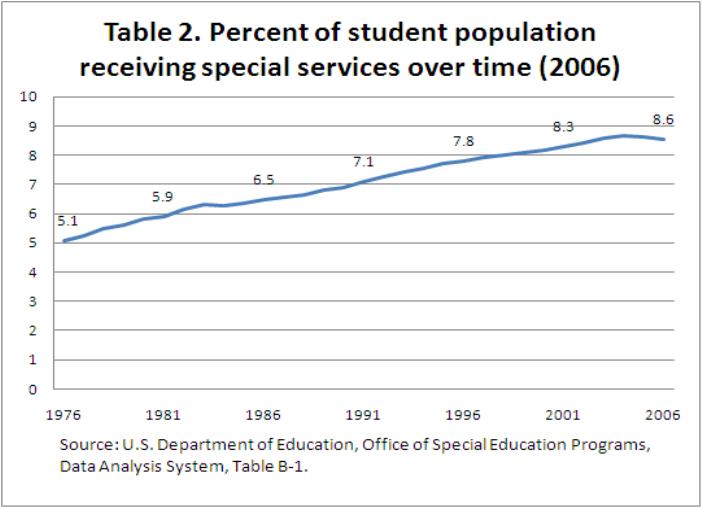
If Texas’ numbers were on par with the national average, there would be
250,000 more students receiving therapy, counseling, or other services.
Logically, it does not make sense that Texas’ numbers would decrease, when
the national average has been going up in the past few years. In an investigative
report published by the Houston Chronicle in 2012, the TEA was reported to
have saved billions of dollars on special ed services, but denied said services to
students with autism, dyslexia, and speech impediments, among other
disabilities (Rokus, 4).
Data source: Center for Public Education
In 2003, the TEA’s budget was cut by 1.1 billion dollars, forcing them to fire 15
percent of their workforce. Shortly thereafter, they set the state target for
students receiving special ed services to 8.5%. Since the implementation of the
“indicator” in 2004, more than 96% of school districts in Texas have seen a
reduction in their special ed rates (Rosenthal). Many school representatives and
administrators can see the issues this is causing, but are powerless to stop it. If a
school’s special ed enrollment rates are too high above 8.5 percent, the TEA
4
will force them to comply by strictly auditing them. Other schools have seen
this, and interpret these actions as threats. Reach 8.5%, or you will be audited.
According to federal law, parents have the right to formally request a special ed
eligibility evaluation, that schools are required to respond to. However, in an
attempt to keep students out of special education, the TEA has made this
process increasingly difficult over recent years. Districts have blatantly lied to
their students’ parents, by stating that there was a waiting list, or that there was
a fee to be paid for such an evaluation. Some districts have even changed their
rules, requiring teachers to hold a number of meetings with their colleagues
before an assessment could be filed for, therefore making it harder for both
parents and teachers to request evaluations. Because of these measures,
evaluations have fallen by 52 percent since 2014 (Rosenthal).
Apart from these gargantuan obstacles, schools have denied special ed students
the services that they are legally entitled to. Instead, they give them ”Section