2
Introduction
The capacitive touch screen manufacturer Screen Microtech Inc (SMI) Chief
Executive Officer, Chris Derby decided to go for an initial public offering which would give
him cash bonus and US$1.25 million and 3% shares of the newly listed company shares
whereas US$750,000 and 2 % of the company shares for Henderson who is the Chief
Financial Officer of the company. Both of them work closely together to improve financial
performance of SMI.
SMI decided to not accept provision for returns and bad debts in their financial report
due to continuous and predictable historical records with Deltech. Furthermore, new
equipment was purchased every 5 years because of the rapid changing in the need and
technology and the double-declining approach was used to ensure that at the end of its 5-year
life, the equipment was completely depreciated. In 2015 both of them agreed to use straight
line method for depreciation on new item instead of double declining method which used
previously to make financial results attractive.
SMI decided to accept a 2 percent provision for bad debts and a 3 percent provision for
returns. On the other hand, only US$750,000 was recorded for Research and Development to
improve the products but US$2 million was invested for that. Unexpectedly, a major
shipment had been delayed and damaged but the cost was not reported in the financial
statement because the same amount of goods will be delivered on 20 January 2016.

3
Analysis
Question A
Your team of financial analysts has been asked to prepare a fair, unbiased assessment of
SMI’s financial performance prior to its IPO. Based on your review and analysis, write a
short report to senior management, addressing each key accounting transaction described in
the case:
● Provision for Returns
● Returns Allowances
● Research and Development (R&D) Expense
● Gain on Sale
● Depreciation
● Major Shipment Damage and Delay
Show the impact of all these transactions on the net income for the company in 2015 if the
adjustments were made based on your assessments.

4
Provision for Returns
According to the balance sheet the provision for return was not recorded in 2013 and
2014 due to consistent and predictable demand from Deltech. Based on the data, the average
return was 2% whereas the new sales generated is 5% in 2015. According to the return
requirement it should be 5% but SMI only agrees to have 3% return instead which is
reasonable. Moreover the rise in revenue is not only because of orders from Deltech. Table
below shows the estimation:
GROSS SALES
REMARKS
2014
$25,450,000
Contributed by Deltech
2015
$34,100,000
Deltech and by new customers
Increase by $ 8,650,000
Gross sales increase mainly because of
new customers
Table 1: Gross sales in 2014 and 2015
PROVISION FOR RETURN 2015
Provision Rate
GROSS SALES 2015
PROVISION FOR RETURN 2015
$25,450,000
$509,000
Deltech 2%
$8,650,000
$432,500
New Customer 5%
$34,100,000
$941,500
Average 3%
Table 2: The Provision for returns and provision rate
The average return amount is 3 percent of the overall amount, based on the table
above. Although 3 percent is an appropriate value, in order to practise the philosophy of
conservatism, it is recommended that SMI record the provision at 5 percent because:
1. New customers who have no historical records have more liberal return policies.

5
2. New customers might have selective specifications and SMI could not fulfil that due
to inexperience.
Compared to 5%, all this could lead to a higher return rate. SMI is therefore advisable
to predict the highest available percentage which is 5% in the worst case.
Returns Allowances
Standard SMI Customers with a return of 2% (average rate) for 2013 and 2014are part
of the list with no provisions. Huge changes in return of 5% made on the 2015 after SMI
change of policy and it comes from their large new client. The new sales of 5% are projected
based on the new businesses.
The best way is to make adjustments for the allowance of returns to 5% as provisions
instead of 3% which later can be brought down to the true average of 3% (only when
Henderson is sure that is ready be brought down to 3%). With this the allowance will be
$682,000 much higher with a lower net income.
Year
Net Sales
($)
Return
Rate (%)
Estimated
provision for
Return (%)
Estimated
provision for
Return ($)
Net Income
($)
2013
24,775,000
2%
–
$495,500
$2,744,500
2014
25,450,000
2%
–
$509,000
$2,940,100
2015
34,100,000
5%
3%
$1,023,000
$10,727,480
2015
(including 5%
return policy)
34,100,000
5%
5%
$1,705,000
$10,045,480
Table 3: Financial Statement of SMI
Research and Development (R&D) Expense
Based on UK accounting standards, R&D falls into the category of intangible assets,
and using the rules from FRS 10, Goodwill and Intangibles. However, in International
Accounting Standards for R&D, it should deal with under IAS 38, Intangible Assets. Under
IAS 38, it states that the research expenses should be wiped out of the income statement as an
expense when incurred. In code IAS38.54, mention that ‘Charge all research cost to expense’,
and code IAS 38.57 also states that ‘Development costs are capitalized only after technical
and commercial feasibility of the asset for sale or use have been established. This means that
the cost should be located under R&D expenses instead of income, if the cost can’t prove as
development costs.
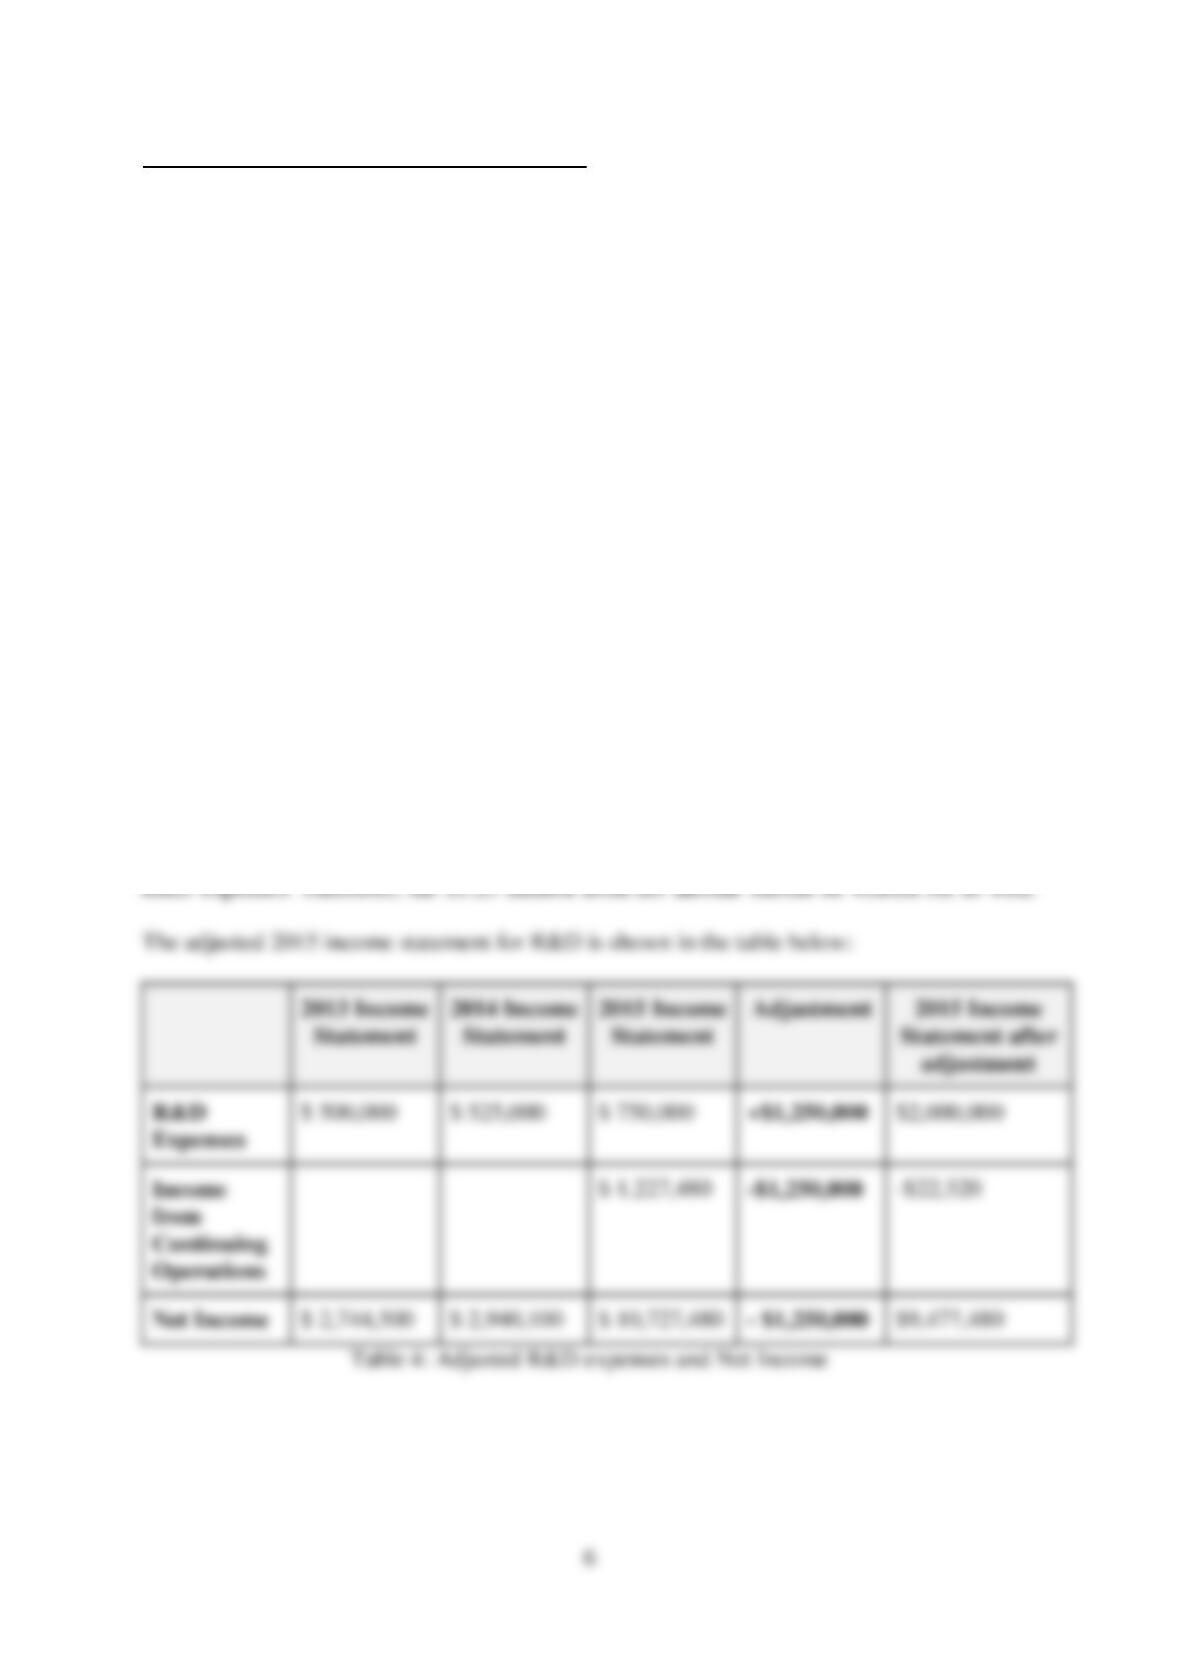
In this case, Derby and Henderson intend to defer the $1.25 million (67.5% of initial
R&D expenses) into the year 2016 and report the remaining $750,000 as R&D expenses.
However, in order to comply with IAS 38, the $1.25 million should be reported directly into