8–1
CHAPTER 8
FLEXIBLE BUDGETS, OVERHEAD COST VARIANCES, AND
MANAGEMENT CONTROL
8–1 Effective planning of variable overhead costs involves:
1. Planning to undertake only those variable overhead activities that add value for
customers using the product or service, and
2. Planning to use the drivers of costs in those activities in the most efficient way.
8–2 At the start of an accounting period, a larger percentage of fixed overhead costs are
locked–in than is the case with variable overhead costs. When planning fixed overhead costs, a
company must choose the appropriate level of capacity or investment that will benefit the
company over a long time. This is a strategic decision.
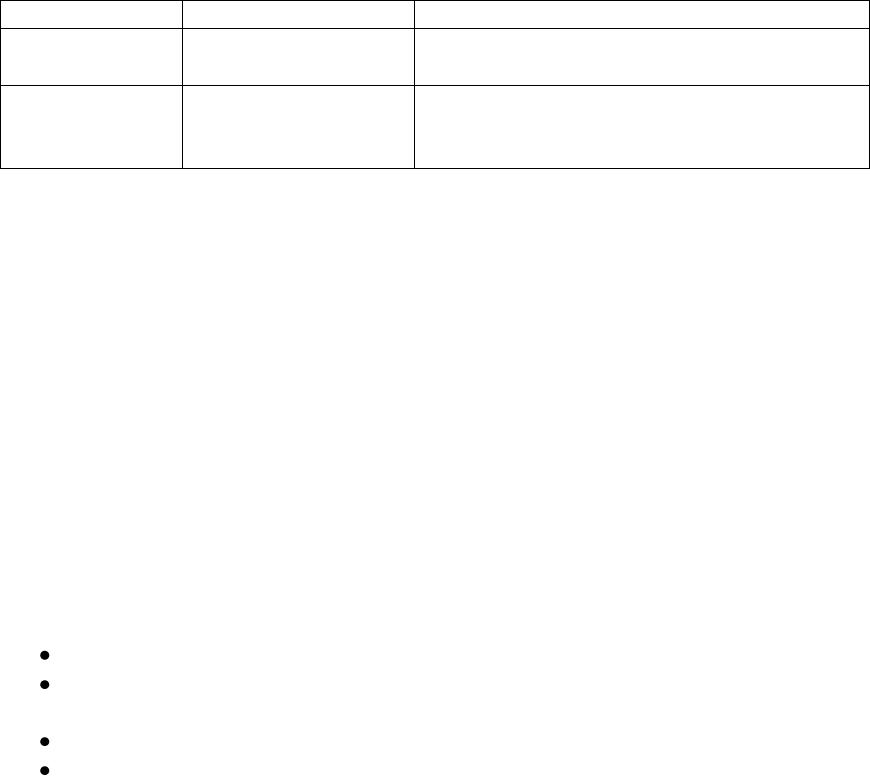
8–3 The key differences are how direct costs are traced to a cost object and how indirect costs
are allocated to a cost object:
Actual Costing
Standard Costing
Direct costs
Actual prices
× Actual inputs used
Standard prices
× Standard inputs allowed for actual output
Indirect costs
Actual indirect rate
× Actual inputs used
Standard indirect cost-allocation rate
× Standard quantity of cost-allocation base
allowed for actual output
8–4 Steps in developing a budgeted variable–overhead cost rate are:
1. Choose the period to be used for the budget,
2. Select the cost–allocation bases to use in allocating variable overhead costs to the
output produced,
3. Identify the variable overhead costs associated with each cost–allocation base, and
4. Compute the rate per unit of each cost–allocation base used to allocate variable
overhead costs to output produced.
8–5 Two factors affecting the spending variance for variable manufacturing overhead are:
a. Price changes of individual inputs (such as energy and indirect materials) included in
variable overhead relative to budgeted prices.
b. Percentage change in the actual quantity used of individual items included in variable
overhead cost pool, relative to the percentage change in the quantity of the cost driver
of the variable overhead cost pool.
8–6 Possible reasons for a favorable variable–overhead efficiency variance are:
Workers more skillful in using machines than budgeted,
Production scheduler was able to schedule jobs better than budgeted, resulting in
lower-than–budgeted machine–hours,
Machines operated with fewer slowdowns than budgeted, and
Machine time standards were overly lenient.
© 2012 Pearson Education, Inc. Publishing as Prentice Hall. SM Cost Accounting 14/e by Horngren
8-2
8-7 A direct materials efficiency variance indicates whether more or less direct materials
were used than was budgeted for the actual output achieved. A variable manufacturing overhead
efficiency variance indicates whether more or less of the chosen allocation base was used than
was budgeted for the actual output achieved.
8-8 Steps in developing a budgeted fixed-overhead rate are
1. Choose the period to use for the budget,
2. Select the cost-allocation base to use in allocating fixed overhead costs to output
produced,
3. Identify the fixed-overhead costs associated with each cost-allocation base, and
4. Compute the rate per unit of each cost-allocation base used to allocate fixed overhead
costs to output produced.
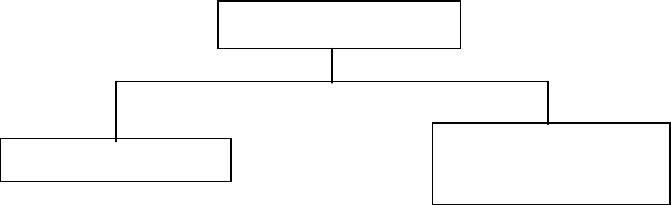
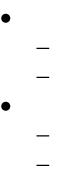
8-9 The relationship for fixed-manufacturing overhead variances is:
There is never an efficiency variance for fixed overhead because managers cannot be
more or less efficient in dealing with an amount that is fixed regardless of the output level. The
result is that the flexible-budget variance amount is the same as the spending variance for fixed–
manufacturing overhead.
8-10 For planning and control purposes, fixed overhead costs are a lump sum amount that is
not controlled on a per-unit basis. In contrast, for inventory costing purposes, fixed overhead
costs are allocated to products on a per-unit basis.
8-11 An important caveat is what change in selling price might have been necessary to attain
the level of sales assumed in the denominator of the fixed manufacturing overhead rate. For
example, the entry of a new low-price competitor may have reduced demand below the
denominator level if the budgeted selling price was maintained. An unfavorable production–
volume variance may be small relative to the selling-price variance had prices been dropped to
attain the denominator level of unit sales.
Flexible-budget variance
Spending variance
Efficiency variance
(never a variance)
© 2012 Pearson Education, Inc. Publishing as Prentice Hall. SM Cost Accounting 14/e by Horngren
8-3
8-12 A strong case can be made for writing off an unfavorable production-volume variance to
cost of goods sold. The alternative is prorating it among inventories and cost of goods sold, but
this would ―penalize‖ the units produced (and in inventory) for the cost of unused capacity, i.e.,
for the units not produced. But, if we take the view that the denominator level is a ―soft‖
number—i.e., it is only an estimate, and it is never expected to be reached exactly, then it makes
more sense to prorate the production volume variance—whether favorable or not—among the
inventory stock and cost of goods sold. Prorating a favorable variance is also more conservative:
it results in a lower operating income than if the favorable variance had all been written off to
cost of goods sold. Finally, prorating also dampens the efficacy of any steps taken by company
management to manage operating income through manipulation of the production volume
variance. In sum, a production-volume variance need not always be written off to cost of goods
sold.
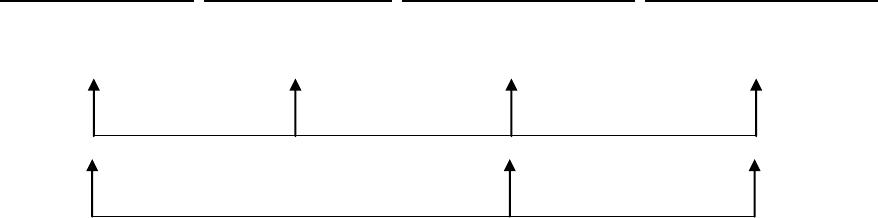
8-13 The four variances are:
Variable manufacturing overhead costs
spending variance
efficiency variance
Fixed manufacturing overhead costs
spending variance
production-volume variance
8-14 Interdependencies among the variances could arise for the spending and efficiency
variances. For example, if the chosen allocation base for the variable overhead efficiency
variance is only one of several cost drivers, the variable overhead spending variance will include
the effect of the other cost drivers. As a second example, interdependencies can be induced when
there are misclassifications of costs as fixed when they are variable, and vice versa.
8-15 Flexible-budget variance analysis can be used in the control of costs in an activity area by
isolating spending and efficiency variances at different levels in the cost hierarchy. For example,
an analysis of batch costs can show the price and efficiency variances from being able to use
longer production runs in each batch relative to the batch size assumed in the flexible budget.
© 2012 Pearson Education, Inc. Publishing as Prentice Hall. SM Cost Accounting 14/e by Horngren
8-4
8-16 (20 min.) Variable manufacturing overhead, variance analysis.
1. Variable Manufacturing Overhead Variance Analysis for Esquire Clothing for June 2012
Actual Costs
Incurred
Actual Input
Quantity
× Actual Rate
(1)
Actual Input
Quantity
× Budgeted Rate
(2)
Flexible Budget:
Budgeted Input
Quantity Allowed
for Actual Output
× Budgeted Rate
(3)
Allocated:
Budgeted Input
Quantity Allowed
for Actual Output
× Budgeted Rate
(4)
(4,536 × $11.50)
$52,164
(4,536 × $12)
$54,432
(4 × 1,080 × $12)
$51,840
(4 × 1,080 × $12)
$51,840
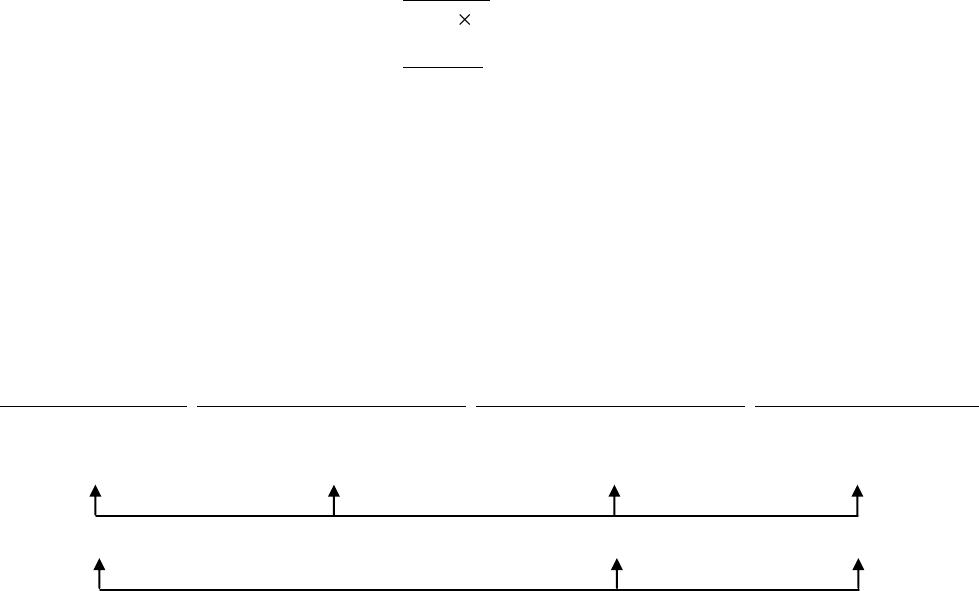
2. Esquire had a favorable spending variance of $2,268 because the actual variable overhead
rate was $11.50 per direct manufacturing labor-hour versus $12 budgeted. It had an unfavorable
efficiency variance of $2,592 U because each suit averaged 4.2 labor-hours (4,536 hours ÷ 1,080
suits) versus 4.0 budgeted labor-hours.
$2,268 F
Spending variance
$2,592 U
Efficiency variance
Never a variance
$324 U
Flexible-budget variance
Never a variance
© 2012 Pearson Education, Inc. Publishing as Prentice Hall. SM Cost Accounting 14/e by Horngren
8-5
8-17 (20 min.) Fixed-manufacturing overhead, variance analysis (continuation of 8-16).
1 & 2.
Budgeted fixed overhead
rate per unit of
allocation base
=
4040,1
400,62$
=
160,4
400,62$
= $15 per hour
Fixed Manufacturing Overhead Variance Analysis for Esquire Clothing for June 2012
Actual Costs
Incurred
(1)
Same Budgeted
Lump Sum
(as in Static Budget)
Regardless of
Output Level
(2)
Flexible Budget:
Same Budgeted
Lump Sum
(as in Static Budget)
Regardless of
Output Level
(3)
Allocated:
Budgeted Input
Quantity Allowed
for Actual Output
× Budgeted Rate
(4)
$63,916
$62,400
$62,400
(4 × 1,080 × $15)
$64,800
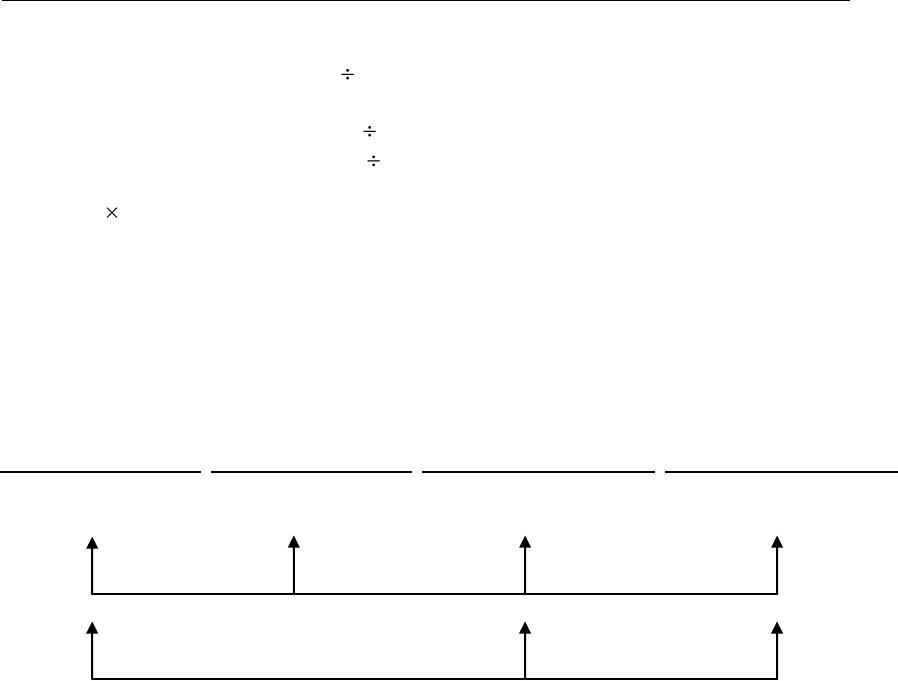
$1,516 U $2,400 F
Spending variance Never a variance Production-volume variance
$1,516 U $2,400 F
Flexible-budget variance Production-volume variance
The fixed manufacturing overhead spending variance and the fixed manufacturing
flexible budget variance are the same––$1,516 U. Esquire spent $1,516 above the $62,400
budgeted amount for June 2012.
The production-volume variance is $2,400 F. This arises because Esquire utilized its
capacity more intensively than budgeted (the actual production of 1,080 suits exceeds the
budgeted 1,040 suits). This results in overallocated fixed manufacturing overhead of $2,400 (4 ×
40 × $15). Esquire would want to understand the reasons for a favorable production-volume
variance. Is the market growing? Is Esquire gaining market share? Will Esquire need to add
capacity?
© 2012 Pearson Education, Inc. Publishing as Prentice Hall. SM Cost Accounting 14/e by Horngren
8-6
8-18 (30 min.) Variable manufacturing overhead variance analysis.
1. Denominator level = (3,200,000 × 0.02 hours) = 64,000 hours
2.
Actual
Results
Flexible
Budget Amounts
1. Output units (baguettes)
2,800,000
2,800,000
2. Direct manufacturing labor-hours
50,400
56,000a
3. Labor-hours per output unit (2 1)
0.018
0.020
4. Variable manuf. overhead (MOH) costs
$680,400
$560,000
5. Variable MOH per labor-hour (4 2)
$13.50
$10
6. Variable MOH per output unit (4 1)
$0.243
$0.200
a2,800,000 0.020= 56,000 hours
Variable Manufacturing Overhead Variance Analysis for French Bread Company for 2012
Actual Costs
Incurred
Actual Input
Quantity
× Actual Rate
(1)
Actual Input
Quantity
× Budgeted Rate
(2)
Flexible Budget:
Budgeted Input
Quantity Allowed
for Actual Output
× Budgeted Rate
(3)
Allocated:
Budgeted Input
Quantity Allowed
for Actual Output
× Budgeted Rate
(4)
(50,400 × $13.50)
$680,400
(50,400 × $10)
$504,000
(56,000 × $10)
$560,000
(56,000 × $10)
$560,000
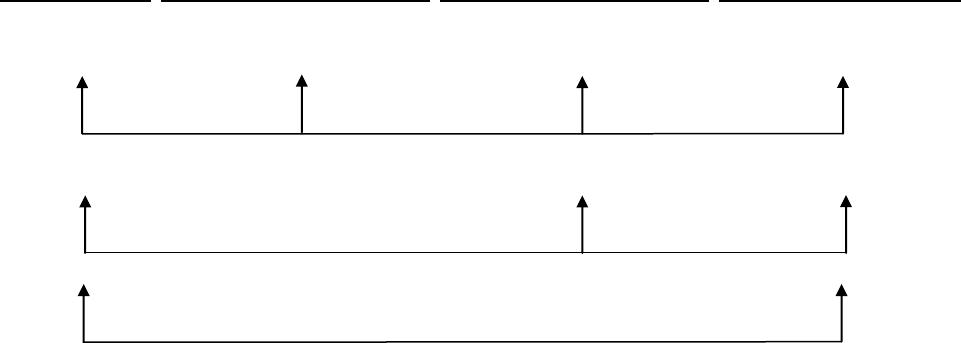
3. Spending variance of $176,400 U. It is unfavorable because variable manufacturing
overhead was 35% higher than planned. A possible explanation could be an increase in energy
rates relative to the rate per standard labor-hour assumed in the flexible budget.
Efficiency variance of $56,000 F. It is favorable because the actual number of direct
manufacturing labor-hours required was lower than the number of hours in the flexible budget.
Labor was more efficient in producing the baguettes than management had anticipated in the
budget. This could occur because of improved morale in the company, which could result from
an increase in wages or an improvement in the compensation scheme.
Flexible-budget variance of $120,400 U. It is unfavorable because the favorable
efficiency variance was not large enough to compensate for the large unfavorable spending
variance.
$176,400 U
Spending variance
$56,000 F
Efficiency variance
Never a variance
$120,400 U
Flexible-budget variance
Never a variance
© 2012 Pearson Education, Inc. Publishing as Prentice Hall. SM Cost Accounting 14/e by Horngren
8-7
8-19 (30 min.) Fixed manufacturing overhead variance analysis (continuation of 8-18).
1. Budgeted standard direct manufacturing labor used = 0.02 per baguette
Budgeted output = 3,200,000 baguettes
Budgeted standard direct manufacturing labor-hours
= 3,200,000 × 0.02
= 64,000 hours
Budgeted fixed manufacturing overhead costs
= 64,000 × $4.00 per hour
= $256,000
Actual output = 2,800,000 baguettes
Allocated fixed manufacturing overhead
= 2,800,000 × 0.02 × $4
= $224,000
Fixed Manufacturing Overhead Variance Analysis for French Bread Company for 2012
Actual Costs
Incurred
(1)
Same Budgeted
Lump Sum
(as in Static Budget)
Regardless of
Output Level
(2)
Flexible Budget:
Same Budgeted
Lump Sum
(as in Static Budget)
Regardless of
Output Level
(3)
Allocated:
Budgeted Input
Quantity Allowed
for Actual Output
× Budgeted Rate
(4)
$272,000
$256,000
$256,000
(2,800,000 × 0.02 × $4)
$224,000
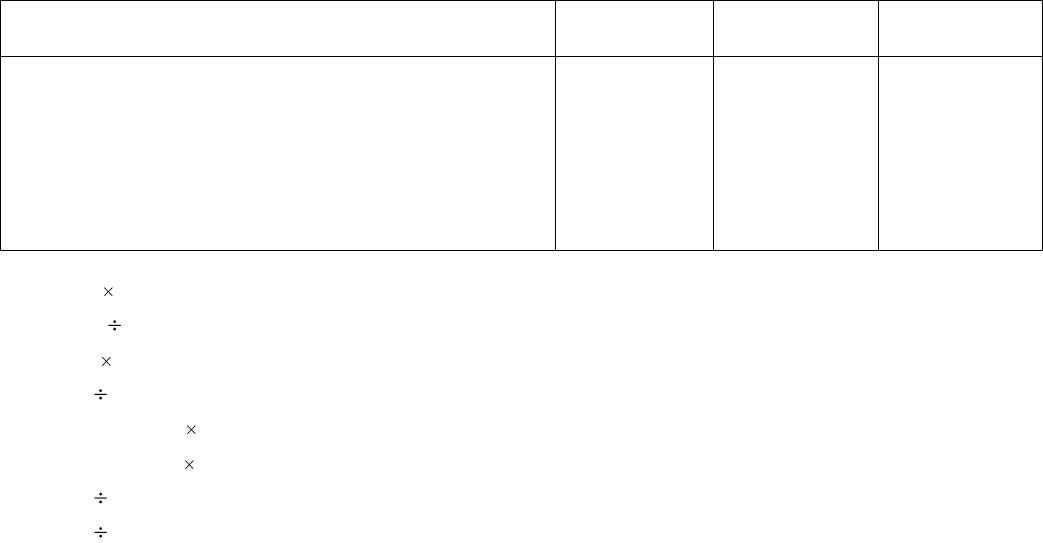
2. The fixed manufacturing overhead is underallocated by $48,000.
3. The production-volume variance of $32,000U captures the difference between the budgeted
3,200,0000 baguettes and the lower actual 2,800,000 baguettes produced—the fixed cost
capacity not used. The spending variance of $16,000 unfavorable means that the actual
aggregate of fixed costs ($272,000) exceeds the budget amount ($256,000). For example,
monthly leasing rates for baguette-making machines may have increased above those in the
budget for 2012.
$16,000 U
Spending variance
Never a variance
$32,000 U
Production-volume
variance
$16,000 U
Flexible-budget variance
$32,000 U
Production-volume
variance
$48,000 U
Underallocated fixed overhead
(Total fixed overhead variance)
© 2012 Pearson Education, Inc. Publishing as Prentice Hall. SM Cost Accounting 14/e by Horngren
8-8
8-20 (30–40 min.) Manufacturing overhead, variance analysis.
1. The summary information is:
The Solutions Corporation (June 2012)
Actual
Flexible
Budget
Static
Budget
Outputs units (number of assembled units)
216
216
200
Hours of assembly time
411
432c
400a
Assembly hours per unit
1.90b
2.00
2.00
Variable mfg. overhead cost per hour of assembly time
$ 31.00d
$ 30.00
$ 30.00
Variable mfg. overhead costs
$12,741
$12,960e
$12,000f
Fixed mfg. overhead costs
$20,550
$19,200
$19,200
Fixed mfg. overhead costs per hour of assembly time
$ 50.00g
$ 48.00h
a 200 units 2 assembly hours per unit = 400 hours
b 411 hours 216 units = 1.90 assembly hours per unit
c 216 units 2 assembly hours per unit = 432 hours
d $12,741 411 assembly hours = $31.00 per assembly hour
e 432 assembly hours $30 per assembly hour = $12,960
f 400 assembly hours $30 per assembly hour = $12,000
g $20,550 411 assembly hours = $50 per assembly hour
h $19,200 400 assembly hours = $48 per assembly hour
© 2012 Pearson Education, Inc. Publishing as Prentice Hall. SM Cost Accounting 14/e by Horngren
8-9
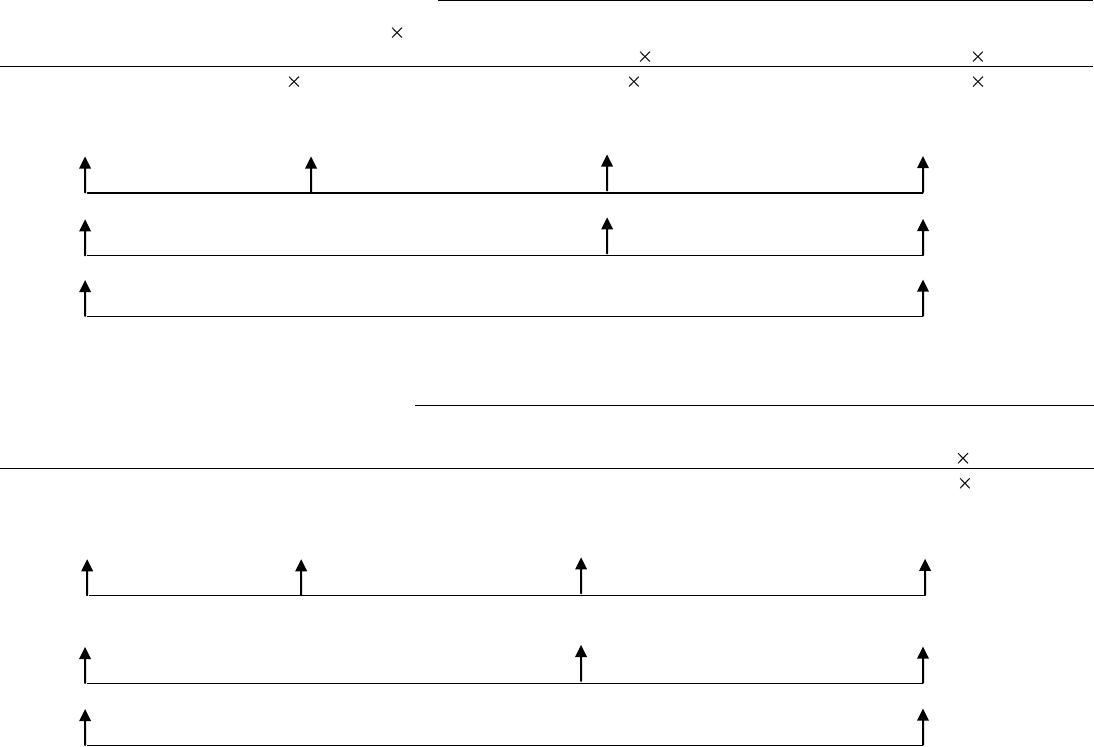
Flexible Budget:
Allocated:
Actual Costs
Actual Input Quantity
Budgeted Input
Quantity Allowed
Budgeted
Budgeted Input
Quantity Allowed
Budgeted
Incurred
Budgeted Rate
for Actual Output Rate
for Actual Output Rate
Variable
411
$30.00
432
$30.00
432
$30.00
Manufacturing
assy. hrs.
per assy. hr.
assy. hrs.
per assy. hr.
assy. hrs.
per assy. hr.
Overhead
$12,741
$12,330
$12,960
$12,960
$411 U $630 F
Spending variance Efficiency variance Never a variance
$219 F
Flexible-budget variance Never a variance
$219 F
Overallocated variable overhead
Flexible Budget:
Allocated:
Actual Costs
Static Budget Lump Sum
Static Budget Lump Sum
Budgeted Input
Allowed
Budgeted
Incurred
Regardless of Output Level
Regardless of Output Level
for Actual Output Rate
Fixed
432
$48.00
Manufacturing
assy. hrs.
per assy. hr.
Overhead
$20,550
$19,200
$19,200
$20,736
$1,350 U $1,536 F
Spending Variance Never a Variance Production-volume variance
$1,350 U $1,536 F
Flexible-budget variance Production-volume variance
$186 F
Overallocated fixed overhead
© 2012 Pearson Education, Inc. Publishing as Prentice Hall. SM Cost Accounting 14/e by Horngren
8-10
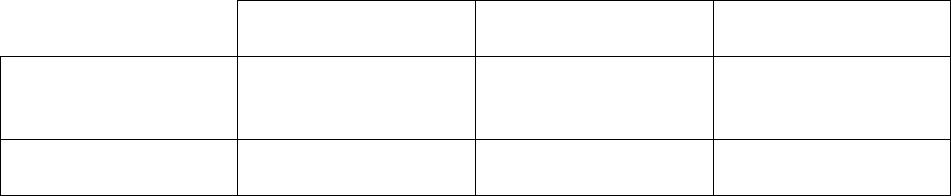
The summary analysis is:
Spending
Variance
Efficiency
Variance
Production-Volume
Variance
Variable
Manufacturing
Overhead
$ 411 U
$630 F
Never a variance
Fixed Manufacturing
Overhead
$1,350 U
Never a variance
$1,536 F
2. Variable Manufacturing Costs and Variances
a. Variable Manufacturing Overhead Control
12,741
Accounts Payable Control and various other accounts
12,741
To record actual variable manufacturing overhead costs incurred
b. Work-in-Process Control
12,960
Variable Manufacturing Overhead Allocated
12,96
To record variable manufacturing overhead allocated.
c. Variable Manufacturing Overhead Allocated
12,960
Variable Manufacturing Overhead Spending Variance
411
Variable Manufacturing Overhead Control
12,74
Variable Manufacturing Overhead Efficiency Variance
630
To isolate variances for the accounting period.
d. Variable Manufacturing Overhead Efficiency Variance
630
Variable Manufacturing Overhead Spending Variance
41
Cost of Goods Sold
2
To write off variable manufacturing overhead variances to cost of goods sold.
© 2012 Pearson Education, Inc. Publishing as Prentice Hall. SM Cost Accounting 14/e by Horngren
8-11
Fixed Manufacturing Costs and Variances
a. Fixed Manufacturing Overhead Control
20,550
Salaries Payable, Acc. Depreciation, various other accounts
20,550
To record actual fixed manufacturing overhead costs incurred.
b. Work-in-Process Control
20,736
Fixed Manufacturing Overhead Allocated
20,736
To record fixed manufacturing overhead allocated.
c. Fixed Manufacturing Overhead Allocated
20,736
Fixed Manufacturing Overhead Spending Variance
1,350
Fixed Manufacturing Overhead Production-Volume Variance
1,536
Fixed Manufacturing Overhead Control
20,550
To isolate variances for the accounting period.
d. Fixed Manufacturing Overhead Production-Volume Variance
1,536
Fixed Manufacturing Overhead Spending Variance
1,350
Cost of Goods Sold
186
To write off fixed manufacturing overhead variances to cost of goods sold.
3. Planning and control of variable manufacturing overhead costs has both a long-run and a
short-run focus. It involves Solutions planning to undertake only value-added overhead activities
(a long-run view) and then managing the cost drivers of those activities in the most efficient way
(a short-run view). Planning and control of fixed manufacturing overhead costs at Solutions have
primarily a long-run focus. It involves undertaking only value-added fixed-overhead activities
for a budgeted level of output. Solutions makes most of the key decisions that determine the
level of fixed-overhead costs at the start of the accounting period.
© 2012 Pearson Education, Inc. Publishing as Prentice Hall. SM Cost Accounting 14/e by Horngren
8-21 (10 15 min.) 4-variance analysis, fill in the blanks.
Variable
Fixed
1. Spending variance
2. Efficiency variance
3. Production-volume variance
4. Flexible-budget variance
5. Underallocated (overallocated) MOH
$200 U
2,200 F
NEVER
2,000 F
2,000 F
$4,600 U
NEVER
1,200 F
4,600 U
3,400 U
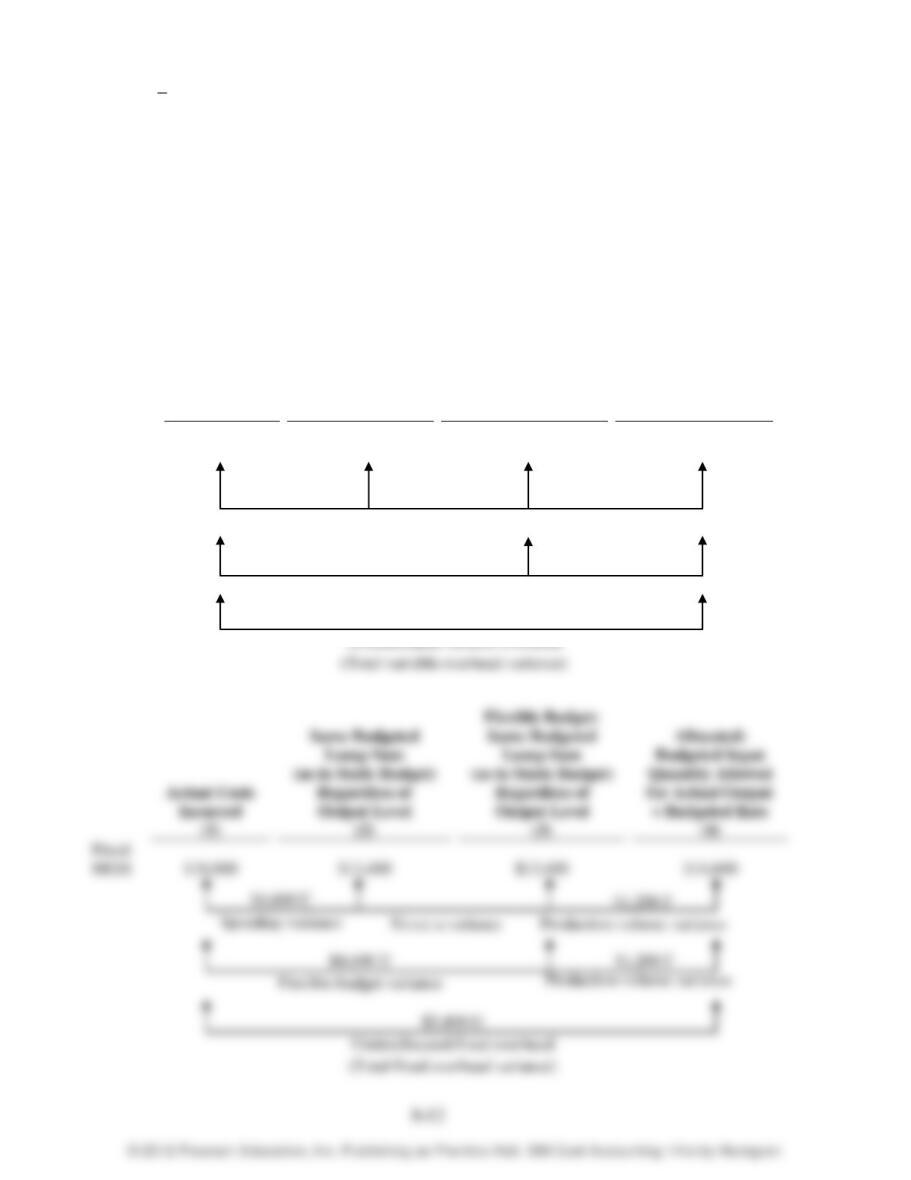
These relationships could be presented in the same way as in Exhibit 8-4.
Actual Costs
Incurred
(1)
Actual Input
Quantity
× Budgeted Rate
(2)
Flexible Budget:
Budgeted Input
Quantity Allowed
for Actual Output
× Budgeted Rate
(3)
Allocated:
Budgeted Input
Quantity Allowed
for Actual Output
× Budgeted Rate
(4)
Variable
MOH
$31,000
$30,800
$33,000
$33,000
$200 U
Spending variance
$2,200 F
Efficiency variance
Never a variance
$2,000 F
Flexible-budget variance
Never a variance
$2,000 F
Actual Costs
(3)
for Actual Output
MOH