3-1
CHAPTER 3
COST–VOLUME–PROFIT ANALYSIS
NOTATION USED IN CHAPTER 3 SOLUTIONS
SP: Selling price
VCU: Variable cost per unit
CMU: Contribution margin per unit
FC: Fixed costs
TOI: Target operating income
3–1 Cost–volume-profit (CVP) analysis examines the behavior of total revenues, total costs,
and operating income as changes occur in the units sold, selling price, variable cost per unit, or
fixed costs of a product.
3–2 The assumptions underlying the CVP analysis outlined in Chapter 3 are
1. Changes in the level of revenues and costs arise only because of changes in the number
of product (or service) units sold.
2. Total costs can be separated into a fixed component that does not vary with the units sold
and a variable component that changes with respect to the units sold.
3. When represented graphically, the behaviors of total revenues and total costs are linear
(represented as a straight line) in relation to units sold within a relevant range and time
period.
4. The selling price, variable cost per unit, and fixed costs are known and constant.
3–3 Operating income is total revenues from operations for the accounting period minus cost
of goods sold and operating costs (excluding income taxes):
Operating income = Total revenues from operations –
Costs of goods sold and operating, costs (excluding income taxes)
Net income is operating income plus nonoperating revenues (such as interest revenue)
minus nonoperating costs (such as interest cost) minus income taxes. Chapter 3 assumes
nonoperating revenues and nonoperating costs are zero. Thus, Chapter 3 computes net income
as:
Net income = Operating income – Income taxes
3–4 Contribution margin is the difference between total revenues and total variable costs.
Contribution margin per unit is the difference between selling price and variable cost per unit.
Contribution–margin percentage is the contribution margin per unit divided by selling price.
3–5 Three methods to express CVP relationships are the equation method, the contribution
margin method, and the graph method. The first two methods are most useful for analyzing
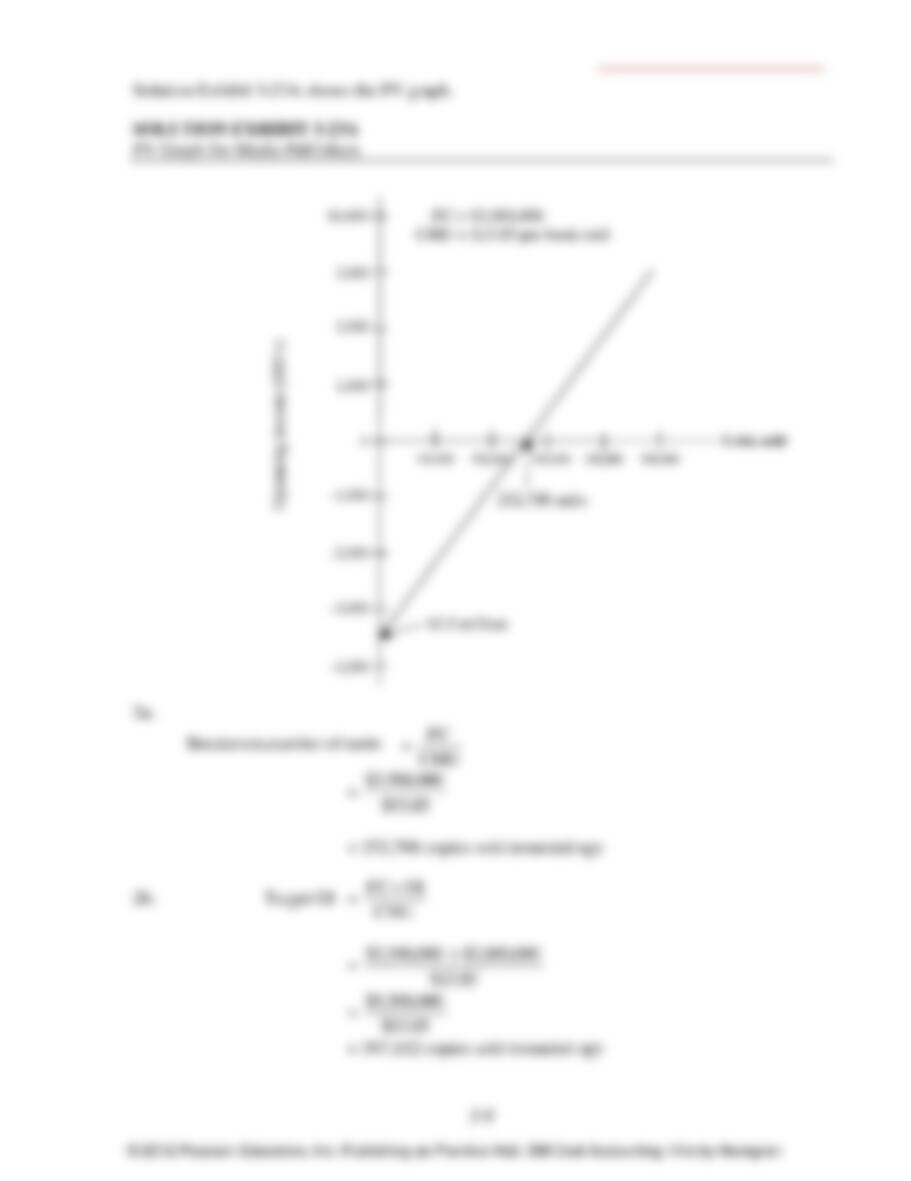
operating income at a few specific levels of sales. The graph method is useful for visualizing the
effect of sales on operating income over a wide range of quantities sold.
© 2012 Pearson Education, Inc. Publishing as Prentice Hall. SM Cost Accounting 14/e by Horngren

3-2
3–6 Breakeven analysis denotes the study of the breakeven point, which is often only an
incidental part of the relationship between cost, volume, and profit. Cost–volume-profit
relationship is a more comprehensive term than breakeven analysis.
3–7 CVP certainly is simple, with its assumption of output as the only revenue and cost
driver, and linear revenue and cost relationships. Whether these assumptions make it simplistic
depends on the decision context. In some cases, these assumptions may be sufficiently accurate
for CVP to provide useful insights. The examples in Chapter 3 (the software package context in
the text and the travel agency example in the Problem for Self–Study) illustrate how CVP can
provide such insights. In more complex cases, the basic ideas of simple CVP analysis can be
expanded.
3–8 An increase in the income tax rate does not affect the breakeven point. Operating income
at the breakeven point is zero, and no income taxes are paid at this point.
3–9 Sensitivity analysis is a ―what–if‖ technique that managers use to examine how an
outcome will change if the original predicted data are not achieved or if an underlying
assumption changes. The advent of the electronic spreadsheet has greatly increased the ability to
explore the effect of alternative assumptions at minimal cost. CVP is one of the most widely
used software applications in the management accounting area.
3–10 Examples include:
Manufacturing––substituting a robotic machine for hourly wage workers.
Marketing––changing a sales force compensation plan from a percent of sales dollars to
a fixed salary.
Customer service––hiring a subcontractor to do customer repair visits on an annual
retainer basis rather than a per–visit basis.
3–11 Examples include:
Manufacturing––subcontracting a component to a supplier on a per–unit basis to avoid
purchasing a machine with a high fixed depreciation cost.
Marketing––changing a sales compensation plan from a fixed salary to percent of sales
dollars basis.
Customer service––hiring a subcontractor to do customer service on a per–visit basis
rather than an annual retainer basis.
3–12 Operating leverage describes the effects that fixed costs have on changes in operating
income as changes occur in units sold, and hence, in contribution margin. Knowing the degree of
operating leverage at a given level of sales helps managers calculate the effect of fluctuations in
sales on operating incomes.
3–13 CVP analysis is always conducted for a specified time horizon. One extreme is a very
short–time horizon. For example, some vacation cruises offer deep price discounts for people
who offer to take any cruise on a day’s notice. One day prior to a cruise, most costs are fixed.
The other extreme is several years. Here, a much higher percentage of total costs typically is
variable.
© 2012 Pearson Education, Inc. Publishing as Prentice Hall. SM Cost Accounting 14/e by Horngren

3-3
CVP itself is not made any less relevant when the time horizon lengthens. What happens
is that many items classified as fixed in the short run may become variable costs with a longer
time horizon.
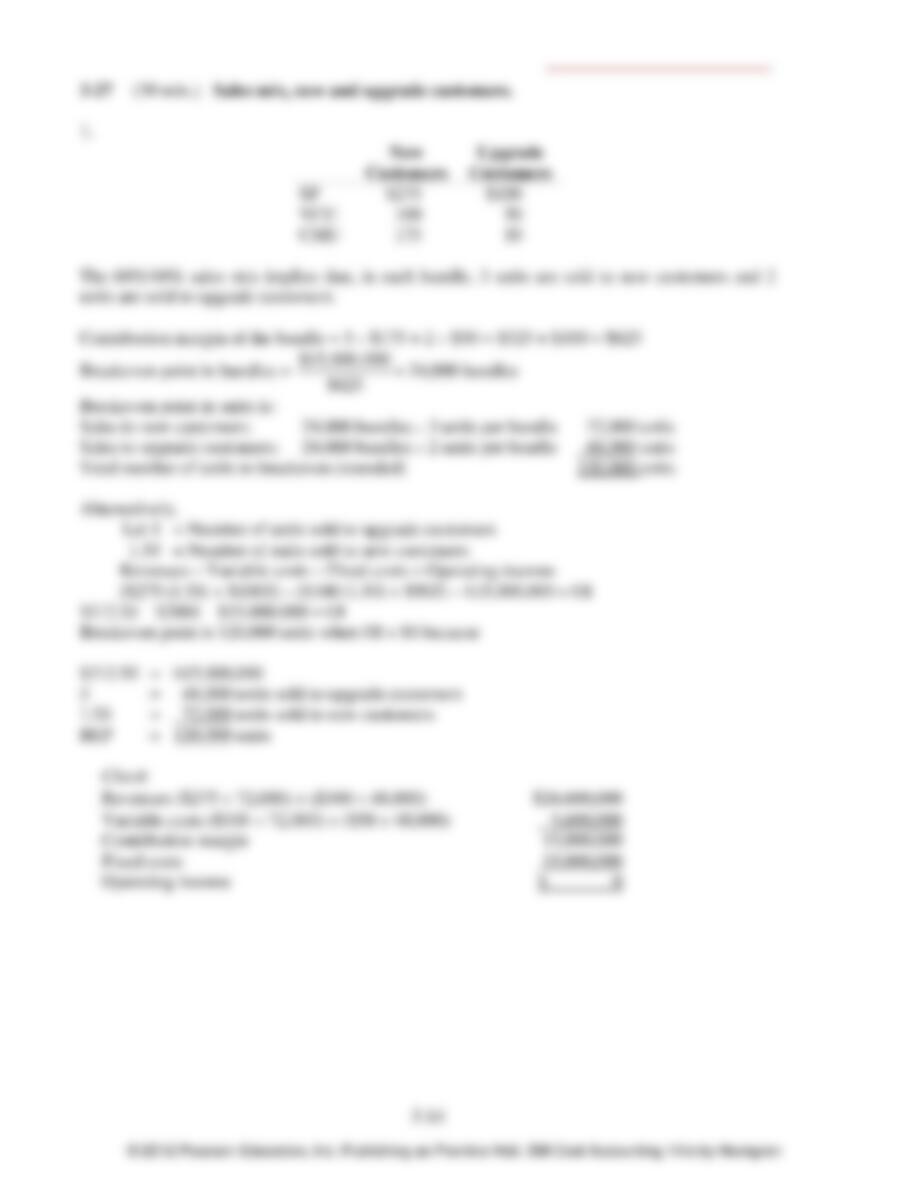
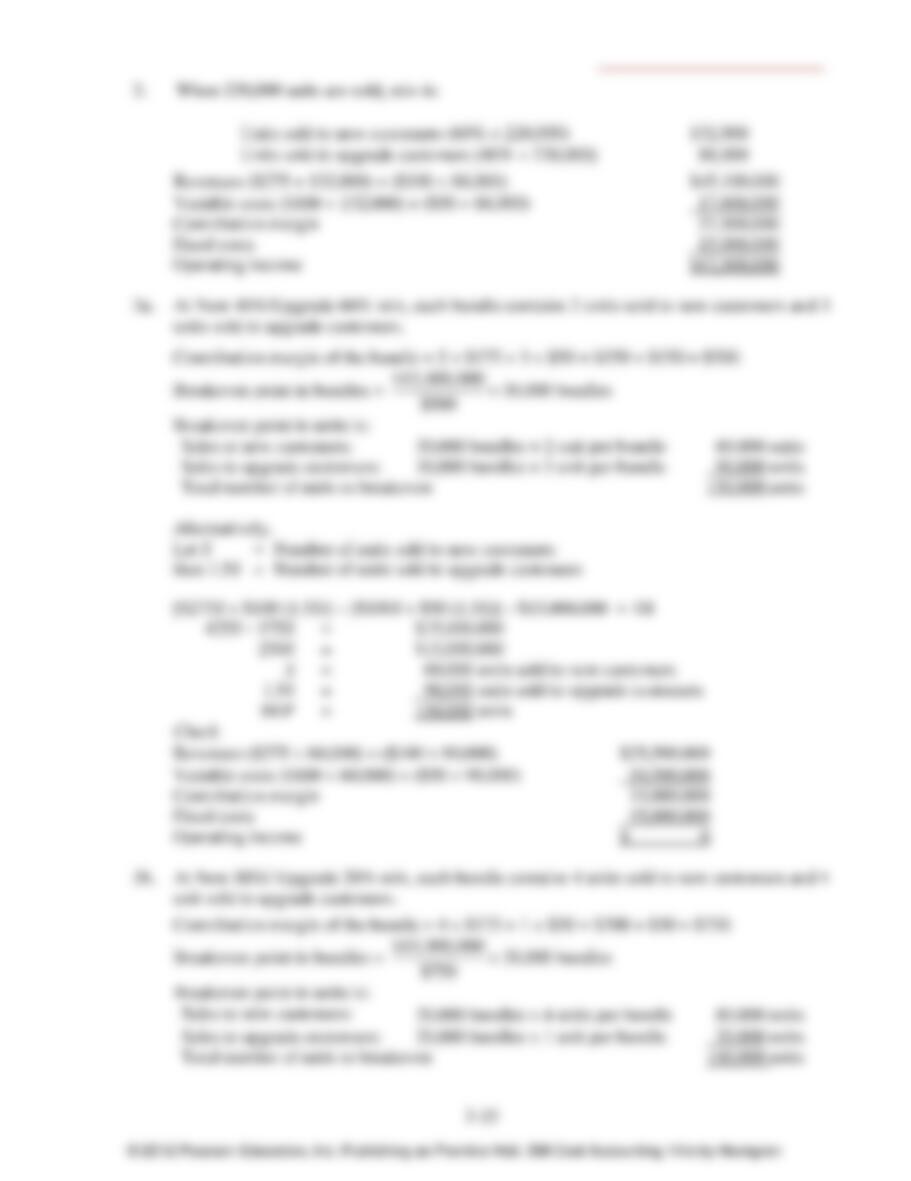
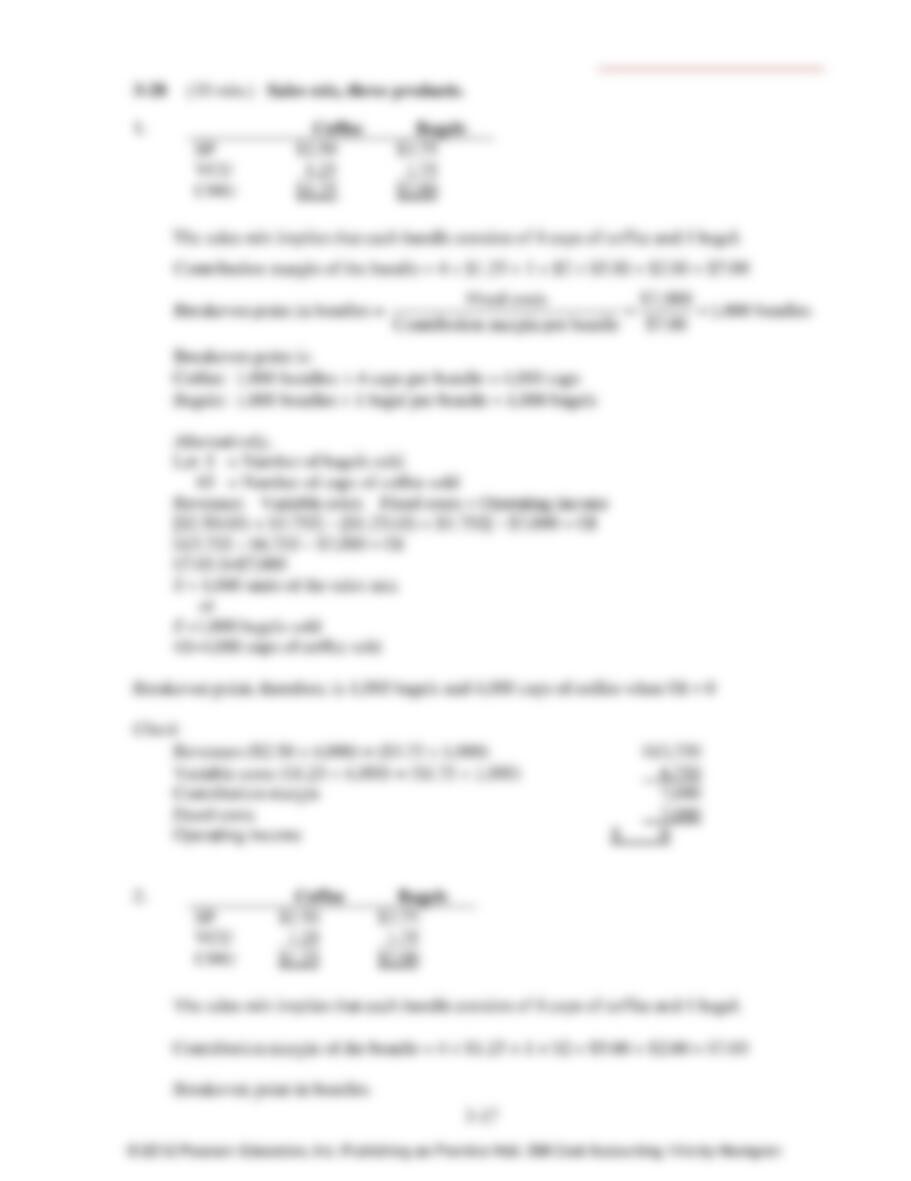
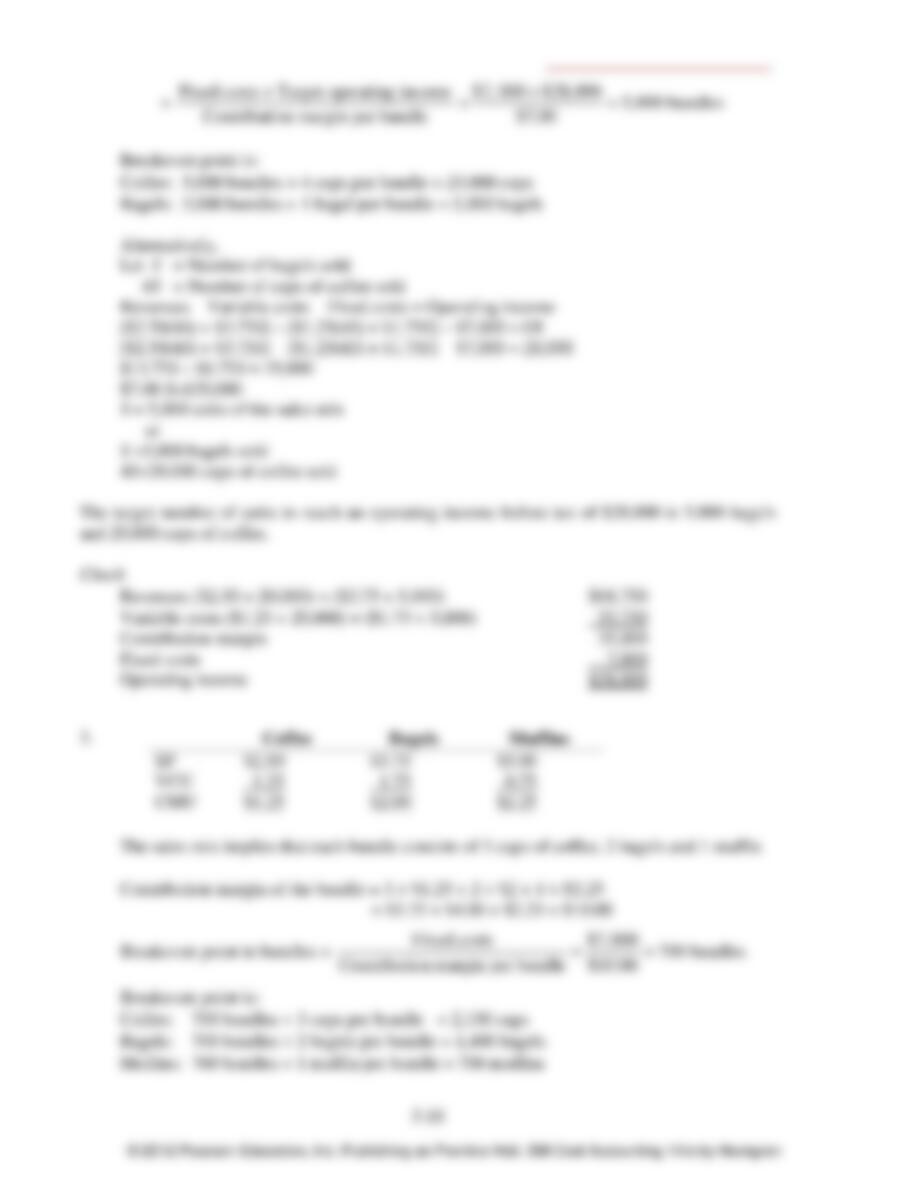
3–14 A company with multiple products can compute a breakeven point by assuming there is a
constant sales mix of products at different levels of total revenue.
3–15 Yes, gross margin calculations emphasize the distinction between manufacturing and
nonmanufacturing costs (gross margins are calculated after subtracting variable and fixed
manufacturing costs). Contribution margin calculations emphasize the distinction between fixed
and variable costs. Hence, contribution margin is a more useful concept than gross margin in
CVP analysis.
3–16 (10 min.) CVP computations.
Variable
Fixed
Total
Operating
Contribution
Contribution
Revenues
Costs
Costs
Costs
Income
Margin
Margin %
a.
$2,000
$ 500
$300
$ 800
$1,200
$1,500
75.0%
b.
2,000
1,500
300
1,800
200
500
25.0%
c.
1,000
700
300
1,000
0
300
30.0%
d.
1,500
900
300
1,200
300
600
40.0%
3–17 (10–15 min.) CVP computations.
1a. Sales ($68 per unit × 410,000 units) $27,880,000
Variable costs ($60 per unit × 410,000 units) 24,600,000
Contribution margin $ 3,280,000
1b. Contribution margin (from above) $3,280,000
Fixed costs 1,640,000
Operating income $1,640,000
2a. Sales (from above) $27,880,000
Variable costs ($54 per unit × 410,000 units) 22,140,000
Contribution margin $ 5,740,000
2b. Contribution margin $5,740,000
Fixed costs 5,330,000
Operating income $ 410,000
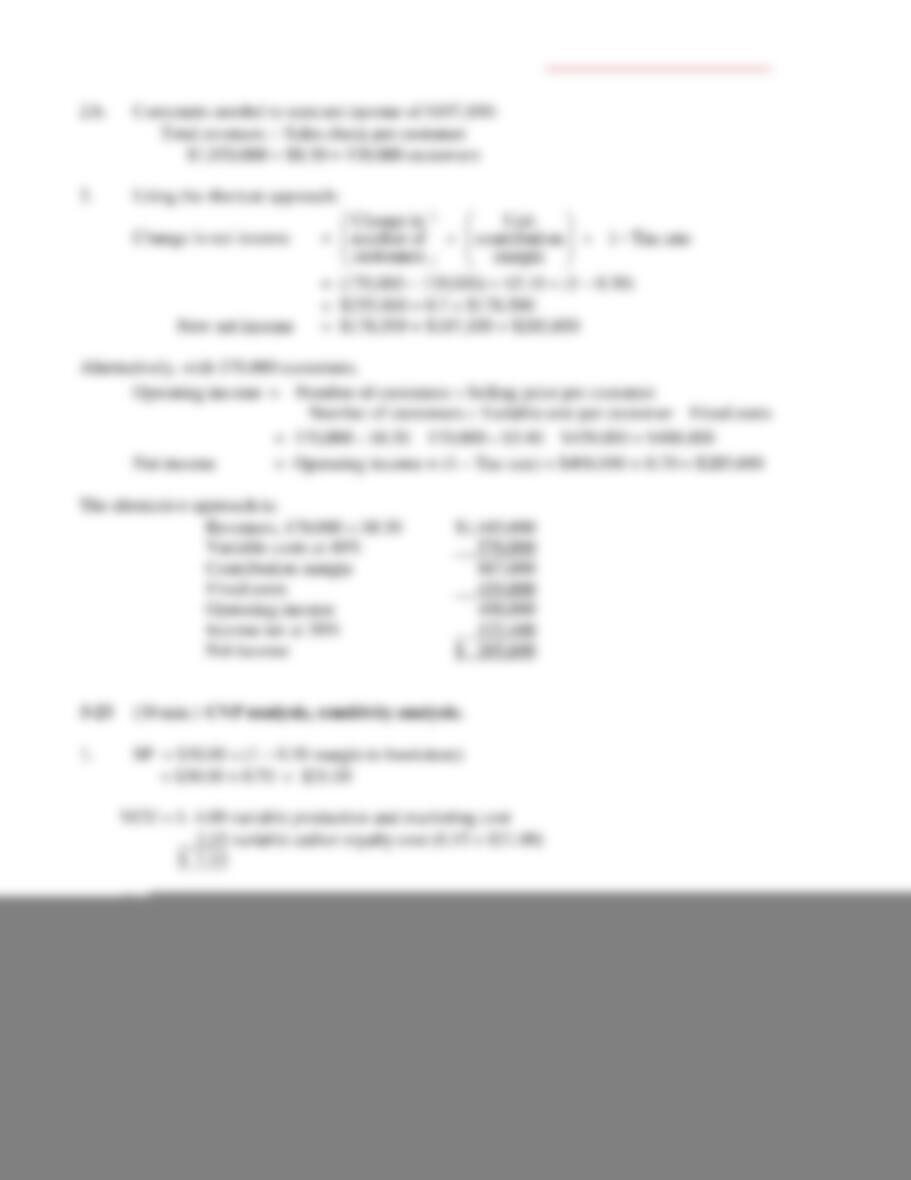
3. Operating income is expected to decrease by $1,230,000 ($1,640,000 − $410,000) if Ms.
Schoenen’s proposal is accepted.
The management would consider other factors before making the final decision. It is
likely that product quality would improve as a result of using state of the art equipment. Due to
increased automation, probably many workers will have to be laid off. Garrett’s management
will have to consider the impact of such an action on employee morale. In addition, the proposal
increases the company’s fixed costs dramatically. This will increase the company’s operating
leverage and risk.
© 2012 Pearson Education, Inc. Publishing as Prentice Hall. SM Cost Accounting 14/e by Horngren
3-4
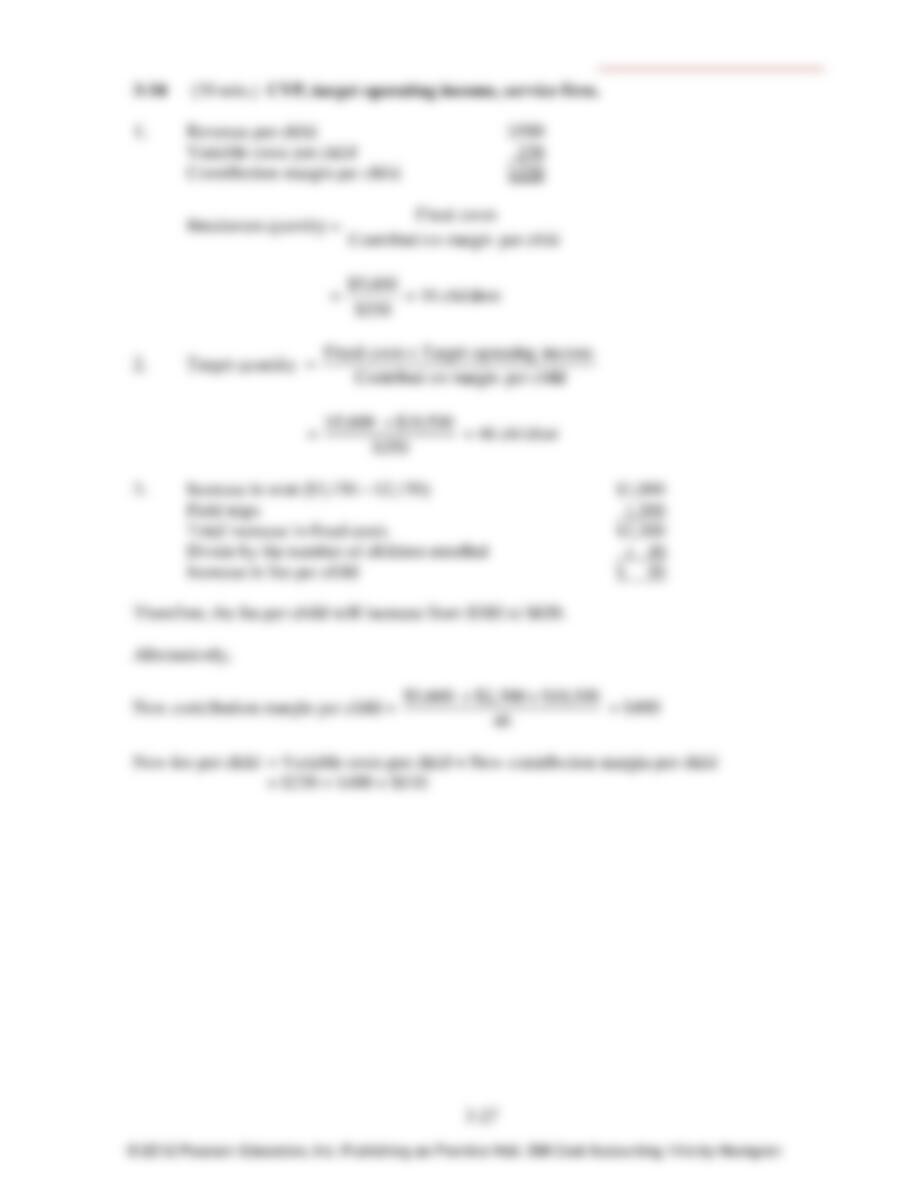
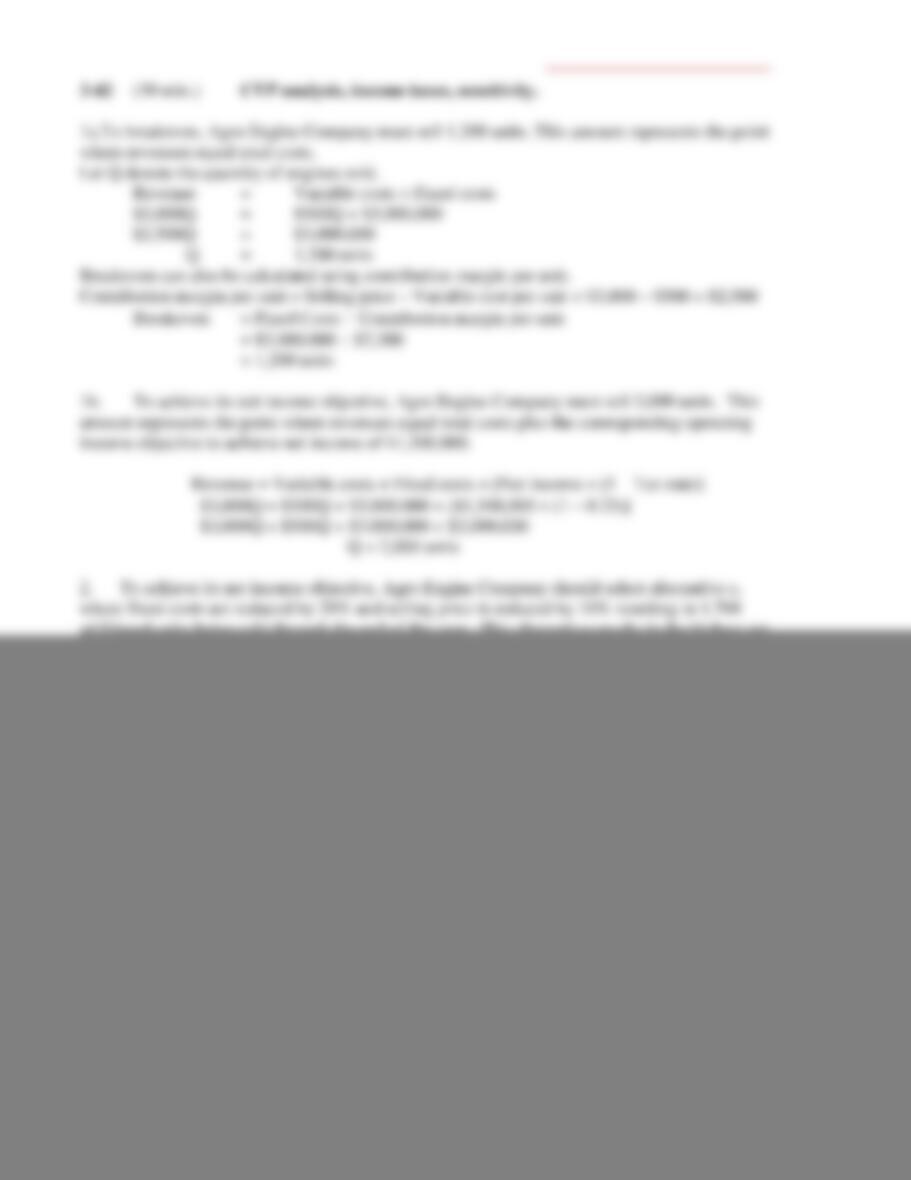
3–18 (35–40 min.) CVP analysis, changing revenues and costs.
1a. SP = 6% × $1,500 = $90 per ticket
VCU = $43 per ticket
CMU = $90 – $43 = $47 per ticket
FC = $23,500 a month
Q =
CMU
FC
=
per ticket $47
$23,500
= 500 tickets
1b. Q =
CMU
TOI FC
=
per ticket $47
$17,000 $23,500
=
per ticket $47
$40,500
= 862 tickets (rounded up)
2a. SP = $90 per ticket
VCU = $40 per ticket
CMU = $90 – $40 = $50 per ticket
FC = $23,500 a month
Q =
CMU
FC
=
per ticket $50
$23,500
= 470 tickets
2b. Q =
CMU
TOI FC
=
per ticket $50
$17,000 $23,500
=
per ticket $50
$40,500
= 810 tickets
3a. SP = $60 per ticket
VCU = $40 per ticket
CMU = $60 – $40 = $20 per ticket
FC = $23,500 a month
Q =
CMU
FC
=
per ticket $20
$23,500
= 1,175 tickets
© 2012 Pearson Education, Inc. Publishing as Prentice Hall. SM Cost Accounting 14/e by Horngren
3-5
3b. Q =
CMU
TOI FC
=
per ticket $20
$17,000 $23,500
=
per ticket $20
$40,500
= 2,025 tickets
The reduced commission sizably increases the breakeven point and the number of tickets
required to yield a target operating income of $17,000:
6%
Commission Fixed
(Requirement 2) Commission of $60
Breakeven point 470 1,175
Attain OI of $10,000 810 2,025
4a. The $5 delivery fee can be treated as either an extra source of revenue (as done below) or
as a cost offset. Either approach increases CMU $5:
SP = $65 ($60 + $5) per ticket
VCU = $40 per ticket
CMU = $65 – $40 = $25 per ticket
FC = $23,500 a month
Q =
CMU
FC
=
per ticket $25
$23,500
= 940 tickets
4b. Q =
CMU
TOI FC
=
per ticket $25
$17,000 $23,500
=
per ticket $25
$40,500
= 1,620 tickets
The $5 delivery fee results in a higher contribution margin which reduces both the breakeven
point and the tickets sold to attain operating income of $17,000.
© 2012 Pearson Education, Inc. Publishing as Prentice Hall. SM Cost Accounting 14/e by Horngren

3-6
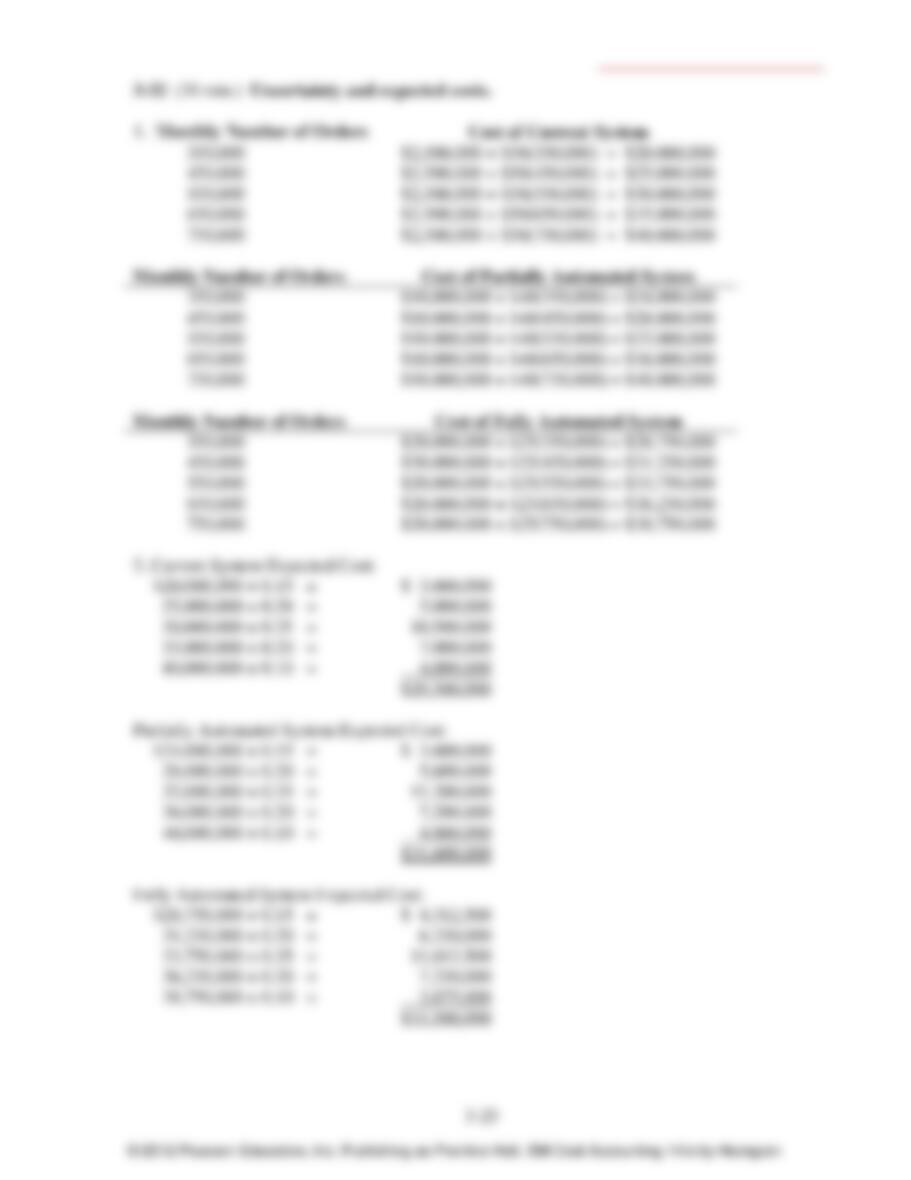
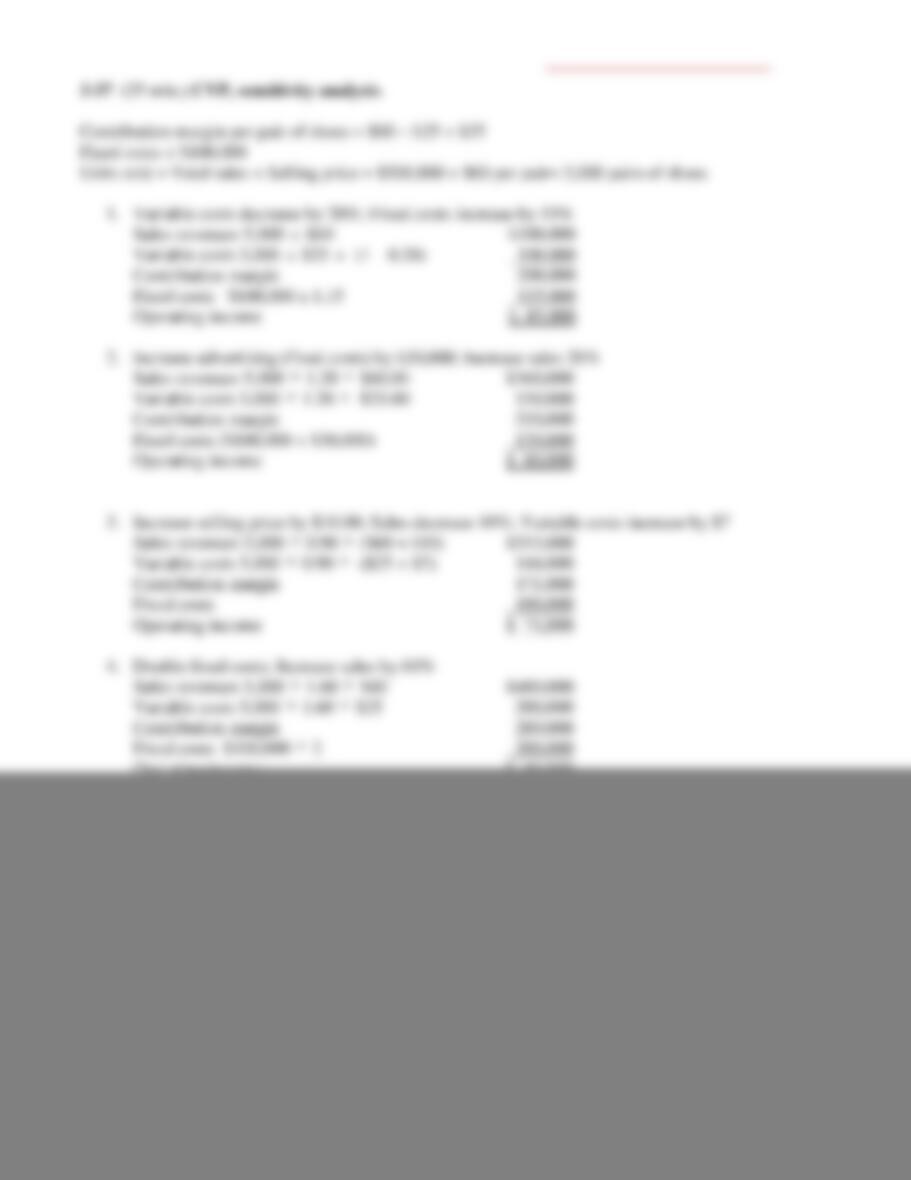
3–19 (20 min.) CVP exercises.
Revenues
Variable
Costs
Contribution
Margin
Fixed
Costs
Budgeted
Operating
Income
Orig.
$10,000,000G
$8,000,000G
$2,000,000
$1,800,000G
$200,000
1.
10,000,000
7,800,000
2,200,000a
1,800,000
400,000
2.
10,000,000
8,200,000
1,800,000b
1,800,000
0
3.
10,000,000
8,000,000
2,000,000
1,890,000c
110,000
4.
10,000,000
8,000,000
2,000,000
1,710,000d
290,000
5.
10,800,000e
8,640,000f
2,160,000
1,800,000
360,000
6.
9,200,000g
7,360,000h
1,840,000
1,800,000
40,000
7.
11,000,000i
8,800,000j
2,200,000
1,980,000k
220,000
8.
10,000,000
7,600,000l
2,400,000
1,890,000m
510,000
Gstands for given.
a$2,000,000 × 1.10; b$2,000,000 × 0.90; c$1,800,000 × 1.05; d$1,800,000 × 0.95; e$10,000,000 × 1.08;
f$8,000,000 × 1.08; g$10,000,000 × 0.92; h$8,000,000 × 0.92; i$10,000,000 × 1.10; j$8,000,000 × 1.10;
k$1,800,000 × 1.10; l$8,000,000 × 0.95; m$1,800,000 × 1.05
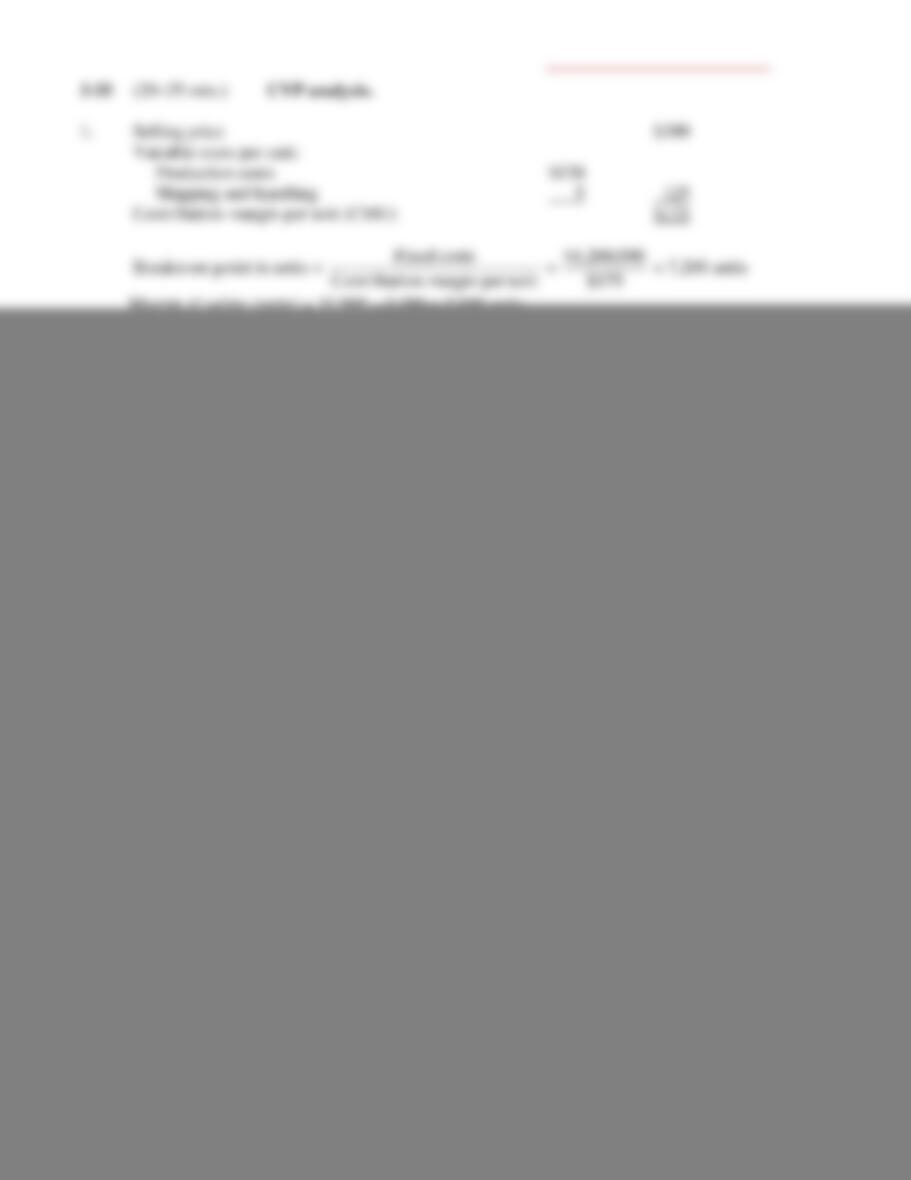
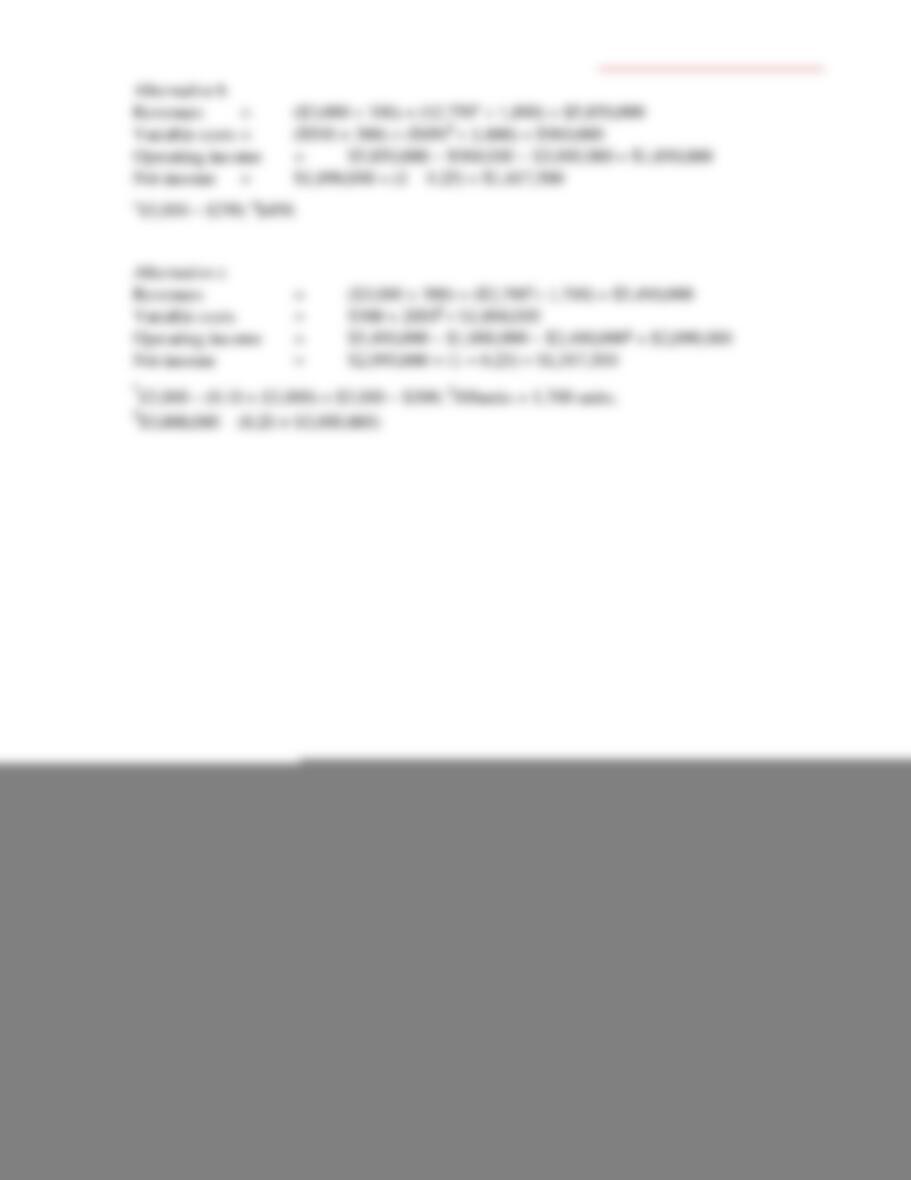
3–20 (20 min.) CVP exercises.
1a. [Units sold (Selling price – Variable costs)] – Fixed costs = Operating income
[5,000,000 ($0.50 – $0.30)] – $900,000 = $100,000
1b. Fixed costs ÷ Contribution margin per unit = Breakeven units
$900,000 ÷ [($0.50 – $0.30)] = 4,500,000 units
Breakeven units × Selling price = Breakeven revenues
4,500,000 units × $0.50 per unit = $2,250,000
or,
Contribution margin ratio =
price Selling
costs Variable price Selling–
=
$0.50
$0.30 – $0.50
= 0.40
Fixed costs ÷ Contribution margin ratio = Breakeven revenues
$900,000 ÷ 0.40 = $2,250,000
2.
5,000,000 ($0.50 – $0.34) – $900,000
=
$ (100,000)
3.
[5,000,000 (1.1) ($0.50 – $0.30)] – [$900,000 (1.1)]
=
$ 110,000
4.
[5,000,000 (1.4) ($0.40 – $0.27)] – [$900,000 (0.8)]
=
$ 190,000
5.
$900,000 (1.1) ÷ ($0.50 – $0.30)
=
4,950,000 units
6.
($900,000 + $20,000) ÷ ($0.55 – $0.30)
=
3,680,000 units
© 2012 Pearson Education, Inc. Publishing as Prentice Hall. SM Cost Accounting 14/e by Horngren
3–21 (10 min.) CVP analysis, income taxes.
1. Monthly fixed costs = $48,200 + $68,000 + $13,000 = $129,200
Contribution margin per unit = $27,000 – $23,000 – $600 = $ 3,400
Breakeven units per month =
Monthly fixed costs
Contribution margin per unit
=
$129,200
$3,400 per car
= 38 cars
2. Tax rate 40%
Target net income $51,000
Target operating income =
Target net income $51,000 $51,000
1 – tax rate(1 0.40) 0.60
$85,000
Quantity of output units
required to be sold
=
Fixed costs + Target operating income $129, 200 $85,000
Contribution margin per unit $3, 400
63 cars
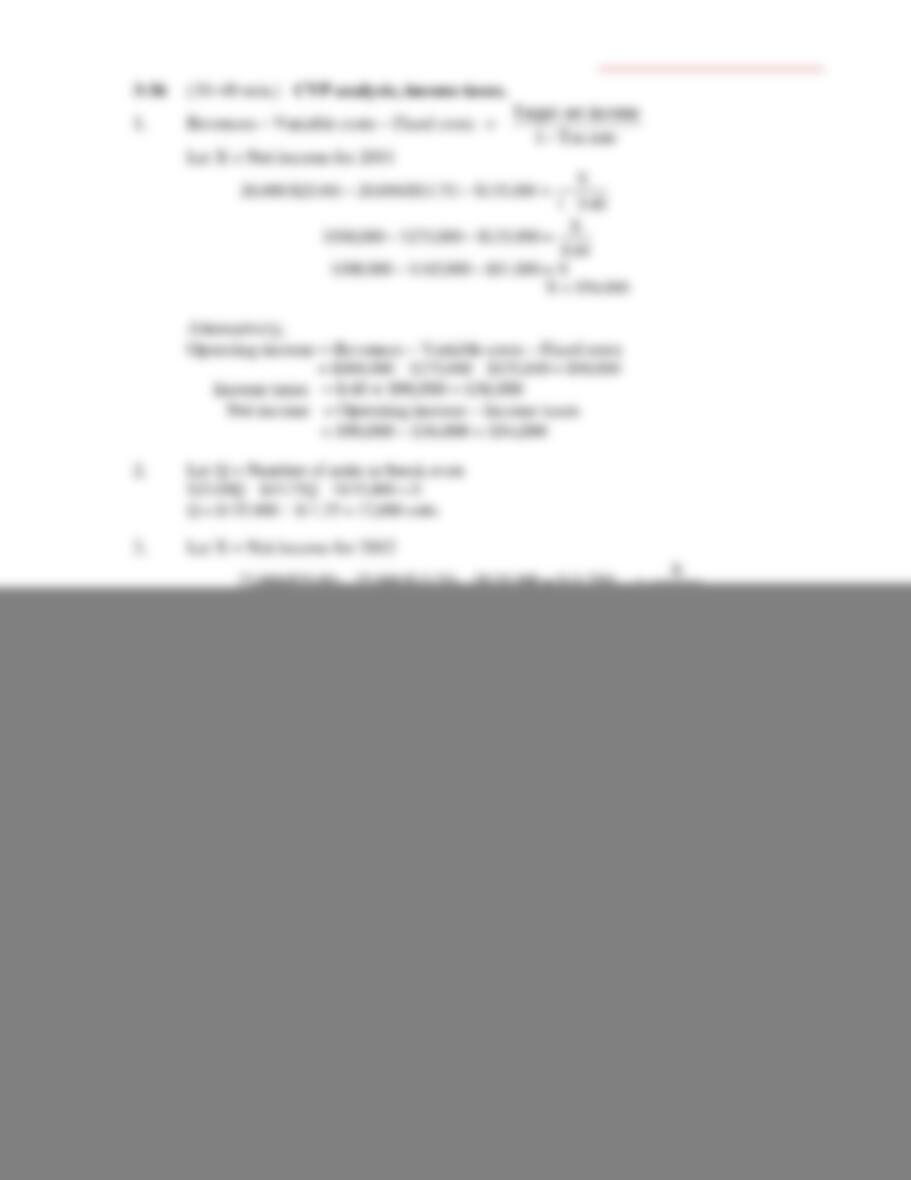
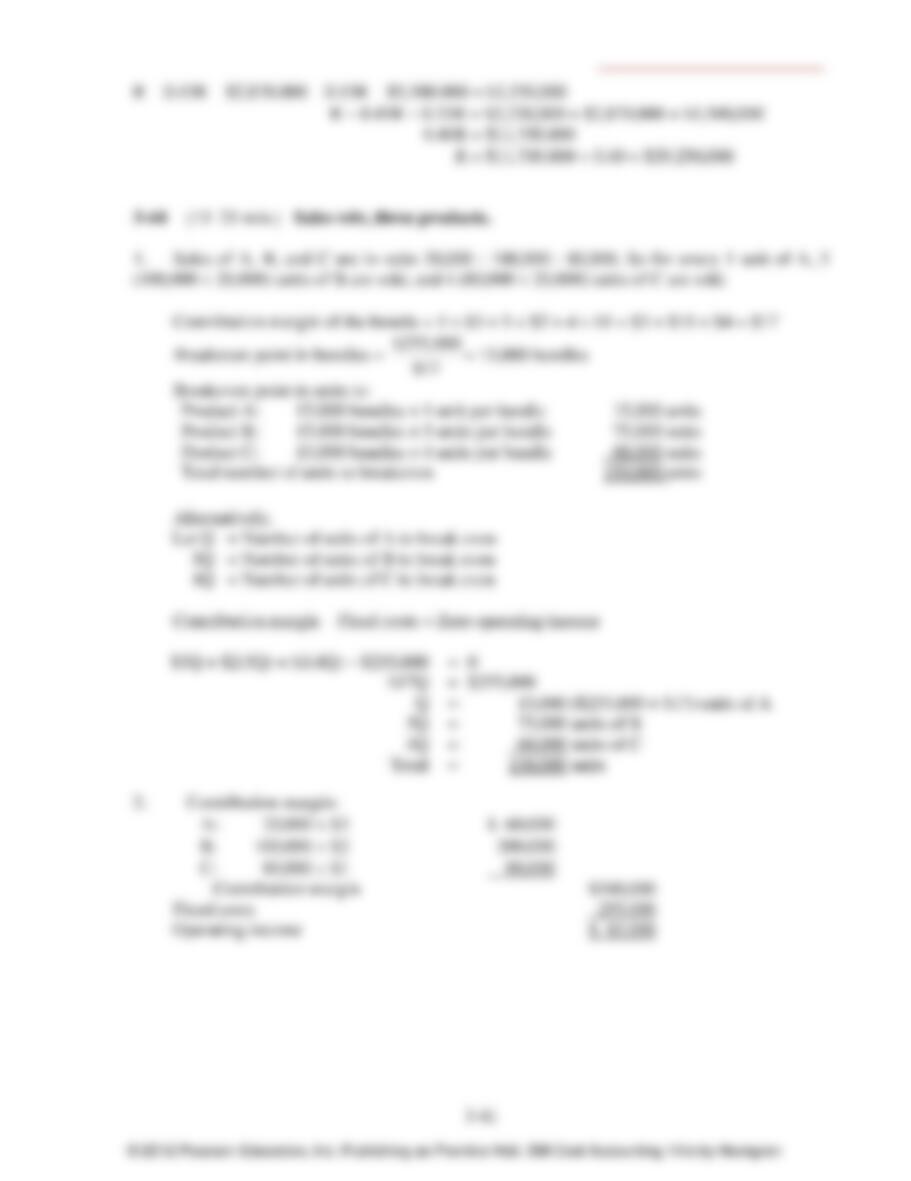
3–22 (20–25 min.) CVP analysis, income taxes.
1. Variable cost percentage is $3.40 $8.50 = 40%
Let R = Revenues needed to obtain target net income
R – 0.40R – $459,000 =
30.01
100,107$
0.60R = $459,000 + $153,000