16–1
CHAPTER 16
COST ALLOCATION: JOINT PRODUCTS AND BYPRODUCTS
16–1 Exhibit 16–1 presents many examples of joint products from four different general
industries. These include:
Industry Separable Products at the Splitoff Point
Food Processing:
• Lamb • Lamb cuts, tripe, hides, bones, fat
• Turkey • Breasts, wings, thighs, poultry meal
Extractive:
• Petroleum • Crude oil, natural gas
16–2 A joint cost is a cost of a production process that yields multiple products simultaneously.
A separable cost is a cost incurred beyond the splitoff point that is assignable to each of the
specific products identified at the splitoff point.
16–3 The distinction between a joint product and a byproduct is based on relative sales value.
A joint product is a product from a joint production process (a process that yields two or more
products) that has a relatively high total sales value. A byproduct is a product that has a relatively
low total sales value compared to the total sales value of the joint (or main) products.
16–4 A product is any output that has a positive sales value (or an output that enables a
company to avoid incurring costs). In some joint–cost settings, outputs can occur that do not have
a positive sales value. The offshore processing of hydrocarbons yields water that is recycled back
into the ocean as well as yielding oil and gas. The processing of mineral ore to yield gold and
silver also yields dirt as an output, which is recycled back into the ground.
16–5 The chapter lists the following six reasons for allocating joint costs:
1. Computation of inventoriable costs and cost of goods sold for financial accounting
purposes and reports for income tax authorities.
2. Computation of inventoriable costs and cost of goods sold for internal reporting purposes.
3. Cost reimbursement under contracts when only a portion of a business‘s products or
services is sold or delivered under cost–plus contracts.
4. Insurance settlement computations for damage claims made on the basis of cost
information of joint products or byproducts.
5. Rate regulation when one or more of the jointly–produced products or services are subject
to price regulation.
6. Litigation in which costs of joint products are key inputs.
16–6 The joint production process yields individual products that are either sold this period or
held as inventory to be sold in subsequent periods. Hence, the joint costs need to be allocated
between total production rather than just those sold this period.
16–7 This situation can occur when a production process yields separable outputs at the splitoff
point that do not have selling prices available until further processing. The result is that selling
prices are not available at the splitoff point to use the sales value at splitoff method. Examples
include processing in integrated pulp and paper companies and in petro–chemical operations.
© 2012 Pearson Education, Inc. Publishing as Prentice Hall. SM Cost Accounting 14/e by Horngren
16–2
16–8 Both methods use market selling–price data in allocating joint costs, but they differ in
which sales–price data they use. The sales value at splitoff method allocates joint costs to joint
products on the basis of the relative total sales value at the splitoff point of the total production of
these products during the accounting period. The net realizable value method allocates joint costs
to joint products on the basis of the relative net realizable value (the final sales value minus the
separable costs of production and marketing) of the total production of the joint products during
the accounting period.
16–9 Limitations of the physical measure method of joint–cost allocation include:
a. The physical weights used for allocating joint costs may have no relationship to the
revenue-producing power of the individual products.
b. The joint products may not have a common physical denominator––for example, one
may be a liquid while another a solid with no readily available conversion factor.
16–10 The NRV method can be simplified by assuming (a) a standard set of post–splitoff point
processing steps, and (b) a standard set of selling prices. The use of (a) and (b) achieves the same
benefits that the use of standard costs does in costing systems.
16–11 The constant gross–margin percentage NRV method takes account of the post–splitoff
point ―profit‖ contribution earned on individual products, as well as joint costs, when making
cost assignments to joint products. In contrast, the sales value at splitoff point and the NRV
methods allocate only the joint costs to the individual products.
16–12 No. Any method used to allocate joint costs to individual products that is applicable to
the problem of joint product–cost allocation should not be used for management decisions
regarding whether a product should be sold or processed further. When a product is an inherent
result of a joint process, the decision to process further should not be influenced by either the
size of the total joint costs or by the portion of the joint costs assigned to particular products.
Joint costs are irrelevant for these decisions. The only relevant items for these decisions are the
incremental revenue and the incremental costs beyond the splitoff point.
16–13 No. The only relevant items are incremental revenues and incremental costs when
making decisions about selling products at the splitoff point or processing them further.
Separable costs are not always identical to incremental costs. Separable costs are costs incurred
beyond the splitoff point that are assignable to individual products. Some separable costs may
not be incremental costs in a specific setting (e.g., allocated manufacturing overhead for post–
splitoff processing that includes depreciation).
16–14 Two methods to account for byproducts are:
a. Production method—recognizes byproducts in the financial statements at the time
production is completed.
b. Sales method—delays recognition of byproducts until the time of sale.
16–15 The sales byproduct method enables a manager to time the sale of byproducts to affect
reported operating income. A manager who was below the targeted operating income could
adopt a ―fire–sale‖ approach to selling byproducts so that the reported operating income exceeds
the target. This illustrates one dysfunctional aspect of the sales method for byproducts.
© 2012 Pearson Education, Inc. Publishing as Prentice Hall. SM Cost Accounting 14/e by Horngren

16–3
16–16 (20-30 min.) Joint–cost allocation, insurance settlement.
1. (a) Sales value at splitoff method:
Pounds
of
Product
Wholesale
Selling Price
per Pound
Sales
Value
at Splitoff
Weighting:
Sales Value
at Splitoff
Joint
Costs
Allocated
Allocated
Costs per
Pound
Breasts
Wings
Thighs
Bones
Feathers
100
20
40
80
10
250
$0.55
0.20
0.35
0.10
0.05
$55.00
4.00
14.00
8.00
0.50
$81.50
0.675
0.049
0.172
0.098
0.006
1.000
$33.75
2.45
8.60
4.90
0.30
$50.00
0.3375
0.1225
0.2150
0.0613
0.0300
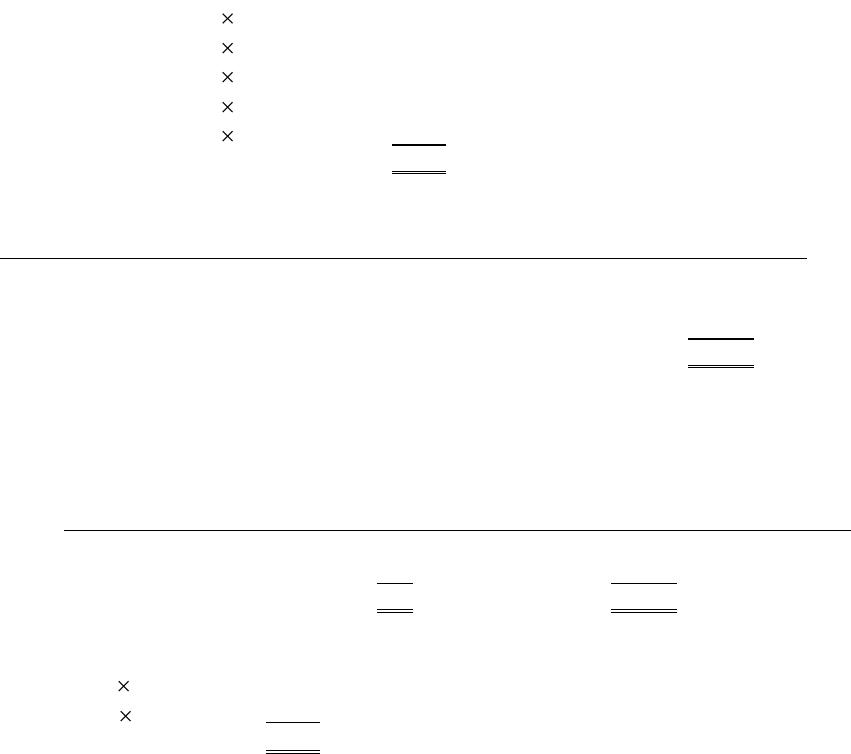
Costs of Destroyed Product
Breasts: $0.3375 per pound 40 pounds = $13.50
Wings: $0.1225 per pound 15 pounds = 1.84
$15.34
b. Physical measure method:
Pounds
of
Product
Weighting:
Physical
Measures
Joint
Costs
Allocated
Allocated
Costs per
Pound
Breasts
Wings
Thighs
Bones
Feathers
100
20
40
80
10
250
0.400
0.080
0.160
0.320
0.040
1.000
$20.00
4.00
8.00
16.00
2.00
$50.00
$0.200
0.200
0.200
0.200
0.200
Costs of Destroyed Product
Breast: $0.20 per pound 40 pounds = $ 8
Wings: $0.20 per pound 15 pounds = 3
$11
Note: Although not required, it is useful to highlight the individual product profitability figures:
Sales Value at
Splitoff Method
Physical
Measures Method
Product
Sales
Value
Joint Costs
Allocated
Gross
Income
Joint Costs
Allocated
Gross
Income
Breasts
Wings
Thighs
Bones
Feathers
$55.00
4.00
14.00
8.00
0.50
$33.75
2.45
8.60
4.90
0.30
$21.25
1.55
5.40
3.10
0.20
$20.00
4.00
8.00
16.00
2.00
$35.00
0.00
6.00
(8.00)
(1.50)
© 2012 Pearson Education, Inc. Publishing as Prentice Hall. SM Cost Accounting 14/e by Horngren
16–4
2. The sales–value at splitoff method captures the benefits–received criterion of cost
allocation and is the preferred method. The costs of processing a chicken are allocated to
products in proportion to the ability to contribute revenue. Quality Chicken’s decision to process
chicken is heavily influenced by the revenues from breasts and thighs. The bones provide
relatively few benefits to Quality Chicken despite their high physical volume.
The physical measures method shows profits on breasts and thighs and losses on bones
and feathers. Given that Quality Chicken has to jointly process all the chicken products, it is non–
intuitive to single out individual products that are being processed simultaneously as making
losses while the overall operations make a profit. Quality Chicken is processing chicken mainly
for breasts and thighs and not for wings, bones, and feathers, while the physical measure method
allocates a disproportionate amount of costs to wings, bones and feathers.
16–17 (10 min.) Joint products and byproducts (continuation of 16–16).
1. Ending inventory:
Breasts 15 $0.3375 = $5.06
Wings 4 0.1225 = 0.49
Thighs 6 0.2150 = 1.29
Bones 5 0.0613 = 0.31
Feathers 2 0.0300 = 0.06
$7.21
2.
Joint products
Byproducts
Net Realizable Values of
byproducts:
Breasts
Wings
Wings
$ 4.00
Thighs
Bones
Bones
8.00
Feathers
Feathers
0.50
$12.50
Joint costs to be allocated:
Joint costs – Net Realizable Values of byproducts = $50 – $12.50 = $37.50
Pounds
of
Product
Wholesale
Selling Price
per Pound
Sales
Value
at Splitoff
Weighting:
Sales Value
at Splitoff
Joint
Costs
Allocated
Allocated
Costs Per
Pound
Breast
100
$0.55
$55
55 ÷ 69
$29.89
$0.2989
Thighs
40
0.35
14
14 ÷ 69
7.61
0.1903
$69
$37.50
Ending inventory:
Breasts 15 $0.2989
$4.48
Thighs 6 0.1903
1.14
$5.62
3. Treating all products as joint products does not require judgments as to whether a product
is a joint product or a byproduct. Joint costs are allocated in a consistent manner to all products
for the purpose of costing and inventory valuation. In contrast, the approach in requirement 2
lowers the joint cost by the amount of byproduct net realizable values and results in inventory
values being shown for only two of the five products, the ones (perhaps arbitrarily) designated as
being joint products.
© 2012 Pearson Education, Inc. Publishing as Prentice Hall. SM Cost Accounting 14/e by Horngren
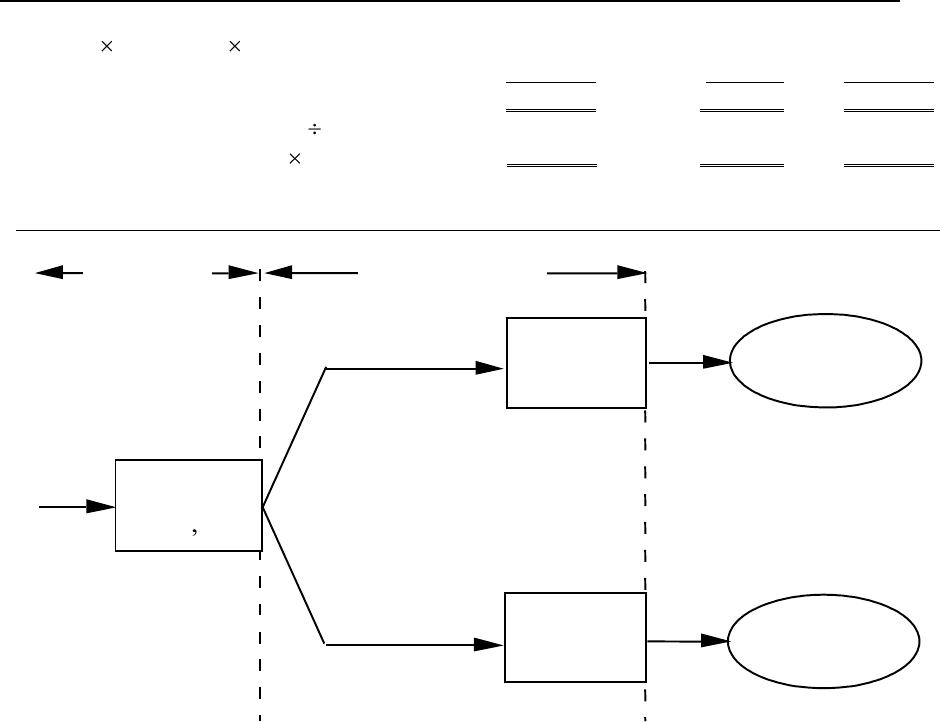
16–5
16–18 (10 min.) Net realizable value method.
A diagram of the situation is in Solution Exhibit 16–18.
Corn Syrup
Corn Starch
Total
Final sales value of total production,
12,500 $50; 6,250 $25
$625,000
$156,250
$781,250
Deduct separable costs
375,000
93,750
468,750
Net realizable value at splitoff point
$250,000
$ 62,500
$312,500
Weighting, $250,000; $62,500 $312,500
0.8
0.2
Joint costs allocated, 0.8; 0.2 $325,000
$260,000
$ 65,000
$325,000
SOLUTION EXHIBIT 16–18 (all numbers are in thousands)
Corn Starch:
6,250 cases at
$25 per case
Corn Syrup:
12,500 cases at
$50 per case
Processing
$325 000
Processing
$375,000
Processing
$93,750
Splitoff
Point
Joint Costs
Separable Costs
© 2012 Pearson Education, Inc. Publishing as Prentice Hall. SM Cost Accounting 14/e by Horngren
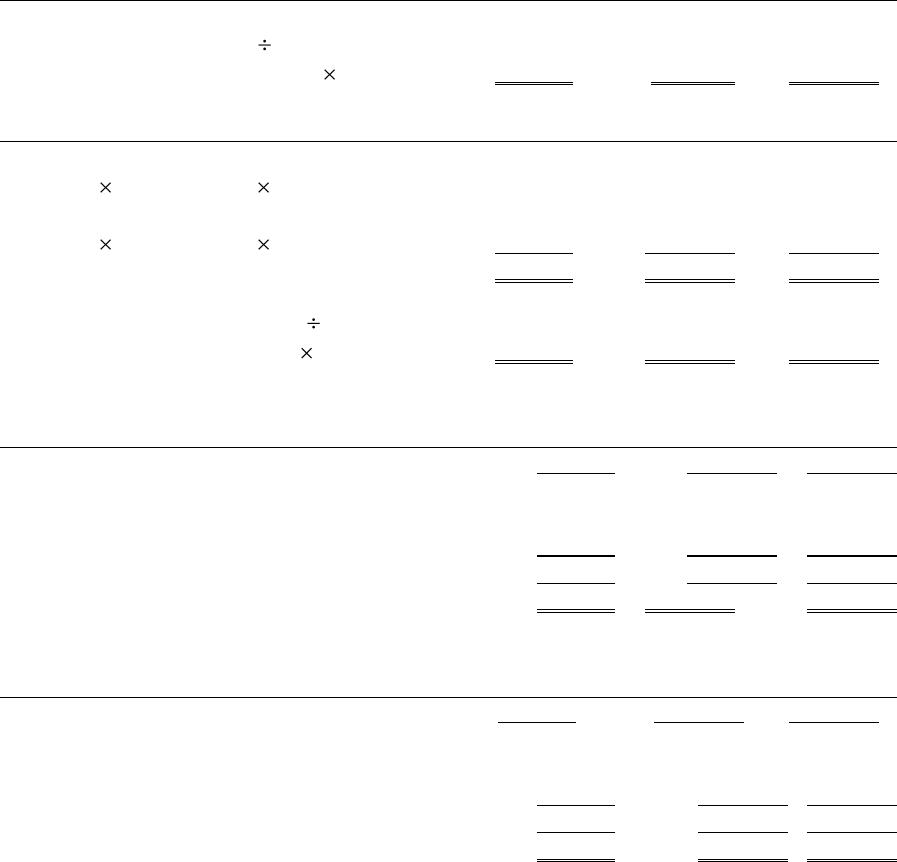
16–6
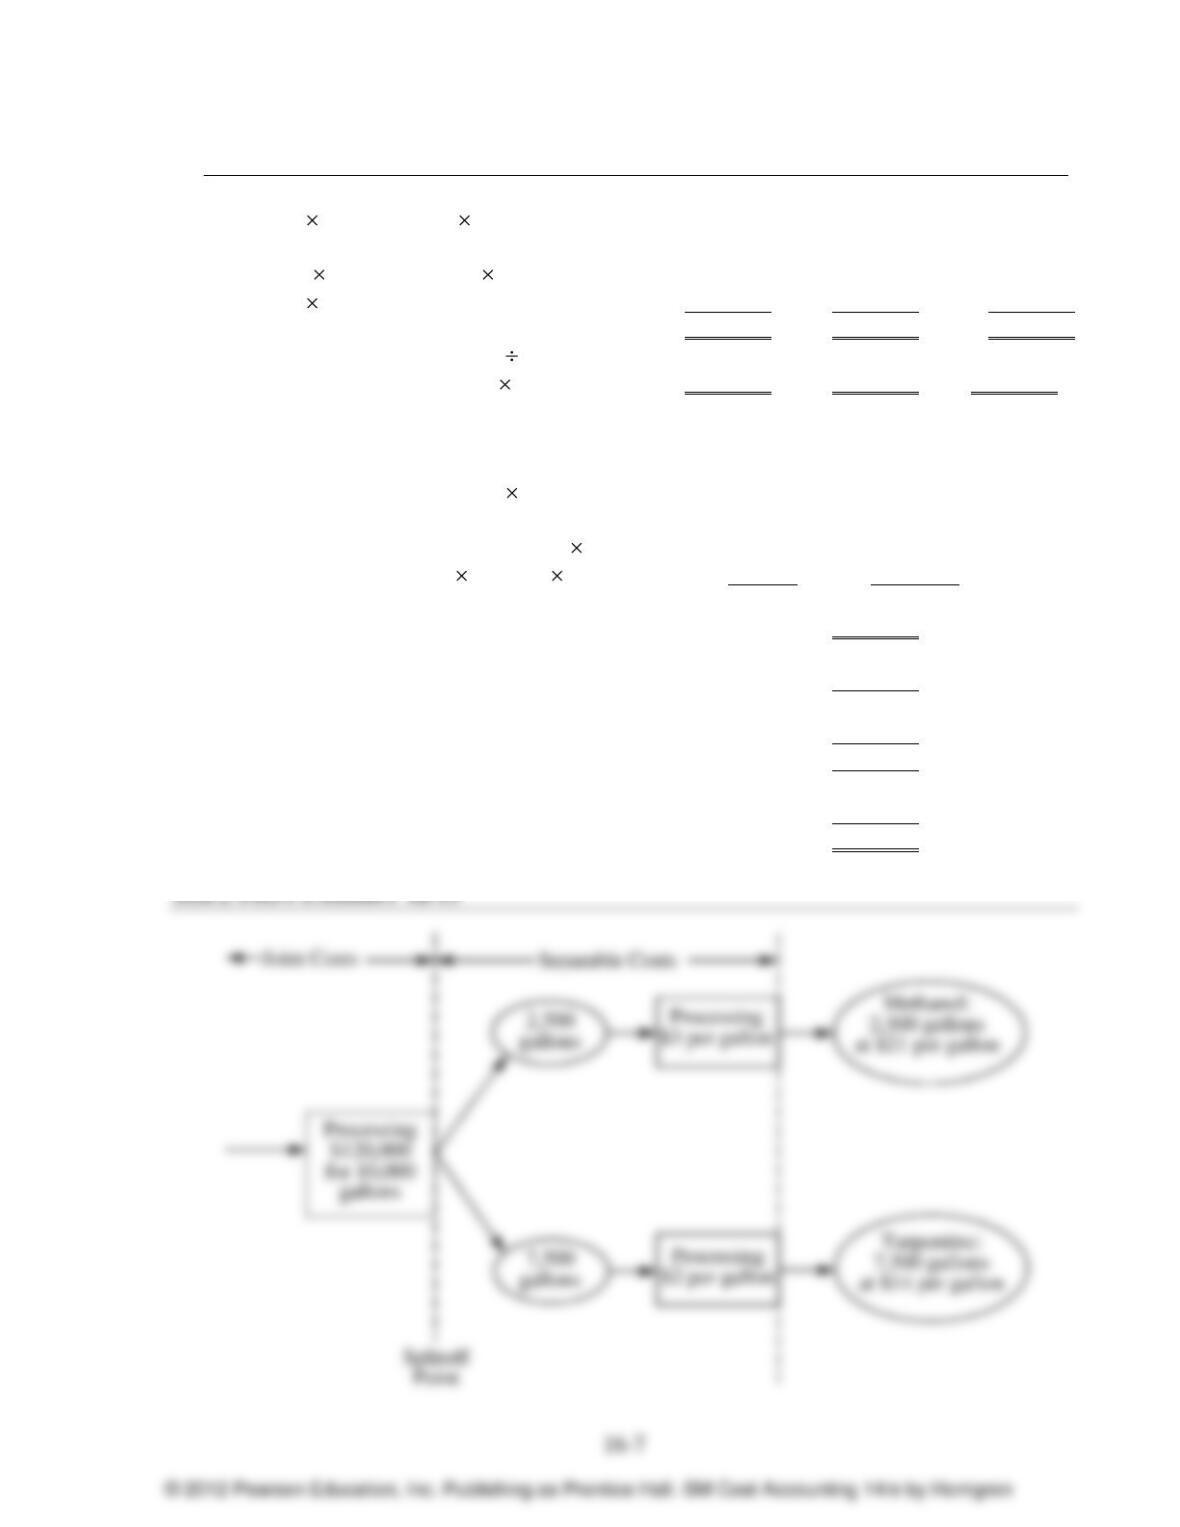
16–19 (40 min.) Alternative joint–cost–allocation methods, further–process decision.
A diagram of the situation is in Solution Exhibit 16–19.
1.
Methanol
Turpentine
Total
Physical measure of total production (gallons) 2,500 7,500 10,000
Weighting, 2,500; 7,500 10,000 0.25 0.75
Joint costs allocated, 0.25; 0.75 $120,000 $30,000 $ 90,000 $120,000
2.
Methanol
Turpentine
Total
Final sales value of total production,
2,500 $21.00; 7,500 $14.00 $52,500 $105,000 $157,500
Deduct separable costs,
2,500 $3.00; 7,500 $2.00 7,500 15,000 22,500
Net realizable value at splitoff point $45,000 $ 90,000 $135,000
Weighting, $45,000; $90,000 $135,000 1/3 2/3
Joint costs allocated, 1/3; 2/3 $120,000 $40,000 $ 80,000 $120,000
3. a. Physical–measure (gallons) method:
Methanol
Turpentine
Total
Revenues $52,500 $105,000 $157,500
Cost of goods sold:
Joint costs 30,000 90,000 120,000
Separable costs 7,500 15,000 22,500
Total cost of goods sold 37,500 105,000 142,500
Gross margin $15,000 $ 0 $ 15,000
b. Estimated net realizable value method:
Methanol
Turpentine
Total
Revenues $52,500 $105,000 $157,500
Cost of goods sold:
Joint costs 40,000 80,000 120,000
Separable costs 7,500 15,000 22,500
Total cost of goods sold 47,500 95,000 142,500
Gross margin $ 5,000 $ 10,000 $ 15,000
© 2012 Pearson Education, Inc. Publishing as Prentice Hall. SM Cost Accounting 14/e by Horngren
4.
Alcohol Bev.
Turpentine
Total
Final sales value of total production,
2,500 $60.00; 7,500 $14.00 $150,000 $105,000 $255,000
Deduct separable costs,
(2,500 $12.00) + (0.20 $150,000);
7,500 $2.00 60,000 15,000 75,000
Net realizable value at splitoff point $ 90,000 $ 90,000 $180,000
Weighting, $90,000; $90,000 $180,000 0.50 0.50
Joint costs allocated, 0.5; 0.5 $120,000 $ 60,000 $ 60,000 $120,000
An incremental approach demonstrates that the company should use the new process:
Incremental revenue,
($60.00 – $21.00) 2,500 $ 97,500
Incremental costs:
Added processing, $9.00 2,500 $22,500
Taxes, (0.20 $60.00) 2,500 30,000 (52,500)
Incremental operating income from
further processing $ 45,000
Proof: Total sales of both products $255,000
Joint costs 120,000
Separable costs 75,000
Cost of goods sold 195,000
New gross margin 60,000
Old gross margin 15,000
Difference in gross margin $ 45,000