14–1
CHAPTER 14
COST ALLOCATION, CUSTOMER–PROFITABILITY
ANALYSIS, AND SALES–VARIANCE ANALYSIS
14–1 Disagree. Cost accounting data plays a key role in many management planning and
control decisions. The division president will be able to make better operating and strategy
decisions by being involved in key decisions about cost pools and cost allocation bases. Such an
understanding, for example, can help the division president evaluate the profitability of different
customers.
14–2 Exhibit 14–1 outlines four purposes for allocating costs:
1. To provide information for economic decisions.
2. To motivate managers and other employees.
3. To justify costs or compute reimbursement amounts.
4. To measure income and assets.
14–3 Exhibit 14–2 lists four criteria used to guide cost allocation decisions:
1. Cause and effect.
2. Benefits received.
3. Fairness or equity.
4. Ability to bear.
The cause–and–effect criterion and the benefits–received criterion are the dominant criteria when
the purpose of the allocation is related to the economic decision purpose or the motivation
purpose.
14–4 Disagree. In general, companies have three choices regarding the allocation of corporate
costs to divisions: allocate all corporate costs, allocate some corporate costs (those ―controllable‖
by the divisions), and allocate none of the corporate costs. Which one of these is appropriate
depends on several factors: the composition of corporate costs, the purpose of the costing
exercise, and the time horizon, to name a few. For example, one can easily justify allocating all
corporate costs when they are closely related to the running of the divisions and when the
purpose of costing is, say, pricing products or motivating managers to consume corporate
resources judiciously.
14–5 Disagree. If corporate costs allocated to a division can be reallocated to the indirect cost
pools of the division on the basis of a logical cause–and–effect relationship, then it is in fact
preferable to do so—this will result in fewer division indirect cost pools and a more cost–
effective cost allocation system. This reallocation of allocated corporate costs should only be
done if the allocation base used for each division indirect cost pool has the same cause–and–effect
relationship with every cost in that indirect cost pool, including the reallocated corporate cost.
Note that we observe such a situation with corporate human resource management (CHRM)
costs in the case of CAI, Inc., described in the chapter—these allocated corporate costs are
included in each division’s five indirect cost pools. (On the other hand, allocated corporate
treasury cost pools are kept in a separate cost pool and are allocated on a different cost–allocation
base than the other division cost pools.)
© 2012 Pearson Education, Inc. Publishing as Prentice Hall. SM Cost Accounting 14/e by Horngren

14–2
14–6 Customer profitability analysis highlights to managers how individual customers
differentially contribute to total profitability. It helps managers to see whether customers who
contribute sizably to total profitability are receiving a comparable level of attention from the
organization.
14–7 Companies that separately record (a) the list price and (b) the discount have sufficient
information to subsequently examine the level of discounting by each individual customer and
by each individual salesperson.
14–8 No. A customer–profitability profile highlights differences in current period‘s profitability
across customers. Dropping customers should be the last resort. An unprofitable customer in one
period may be highly profitable in subsequent future periods. Moreover, costs assigned to
individual customers need not be purely variable with respect to short–run elimination of sales to
those customers. Thus, when customers are dropped, costs assigned to those customers may not
disappear in the short run.
14–9 Five categories in a customer cost hierarchy are identified in the chapter. The examples
given relate to the Spring Distribution Company used in the chapter:
Customer output–unit–level costs—costs of activities to sell each unit (case) to a customer.
An example is product-handling costs of each case sold.
Customer batch–level costs—costs of activities that are related to a group of units (cases)
sold to a customer. Examples are costs incurred to process orders or to make deliveries.
Customer–sustaining costs—costs of activities to support individual customers, regardless
of the number of units or batches of product delivered to the customer. Examples are costs
of visits to customers or costs of displays at customer sites.
Distribution–channel costs—costs of activities related to a particular distribution channel
rather than to each unit of product, each batch of product, or specific customers. An
example is the salary of the manager of Spring’s retail distribution channel.
Corporate–sustaining costs—costs of activities that cannot be traced to individual
customers or distribution channels. Examples are top management and general
administration costs.
14–10 Charting cumulative profits by customer or product type generates a whale curve. This
provides information on the profitability of your customers and clearly identifies the most
profitable from the least profitable.
14–11 Using the levels approach introduced in Chapter 7, the sales–volume variance is a Level 2
variance. By sequencing through Level 3 (sales–mix and sales–quantity variances) and then
Level 4 (market–size and market–share variances), managers can gain insight into the causes of a
specific sales–volume variance caused by changes in the mix and quantity of the products sold as
well as changes in market size and market share.
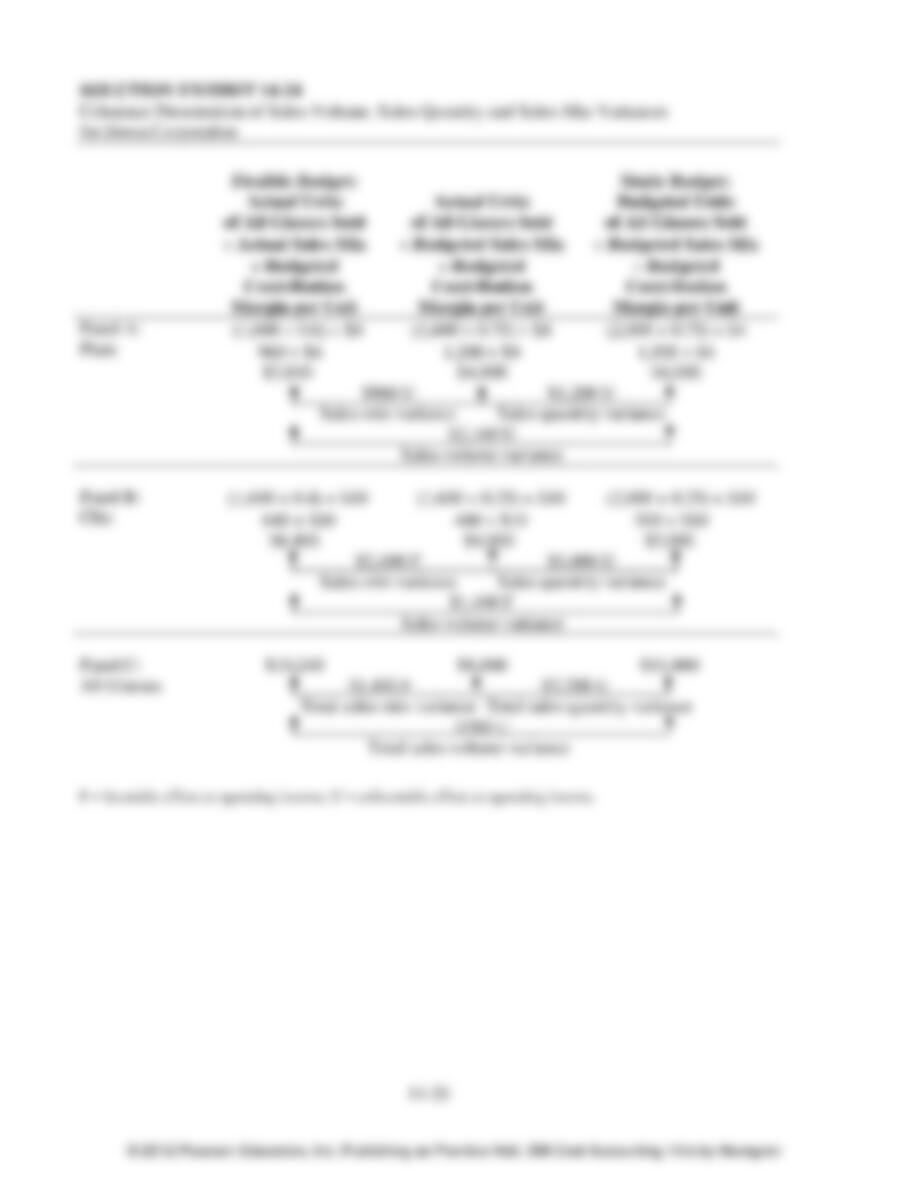
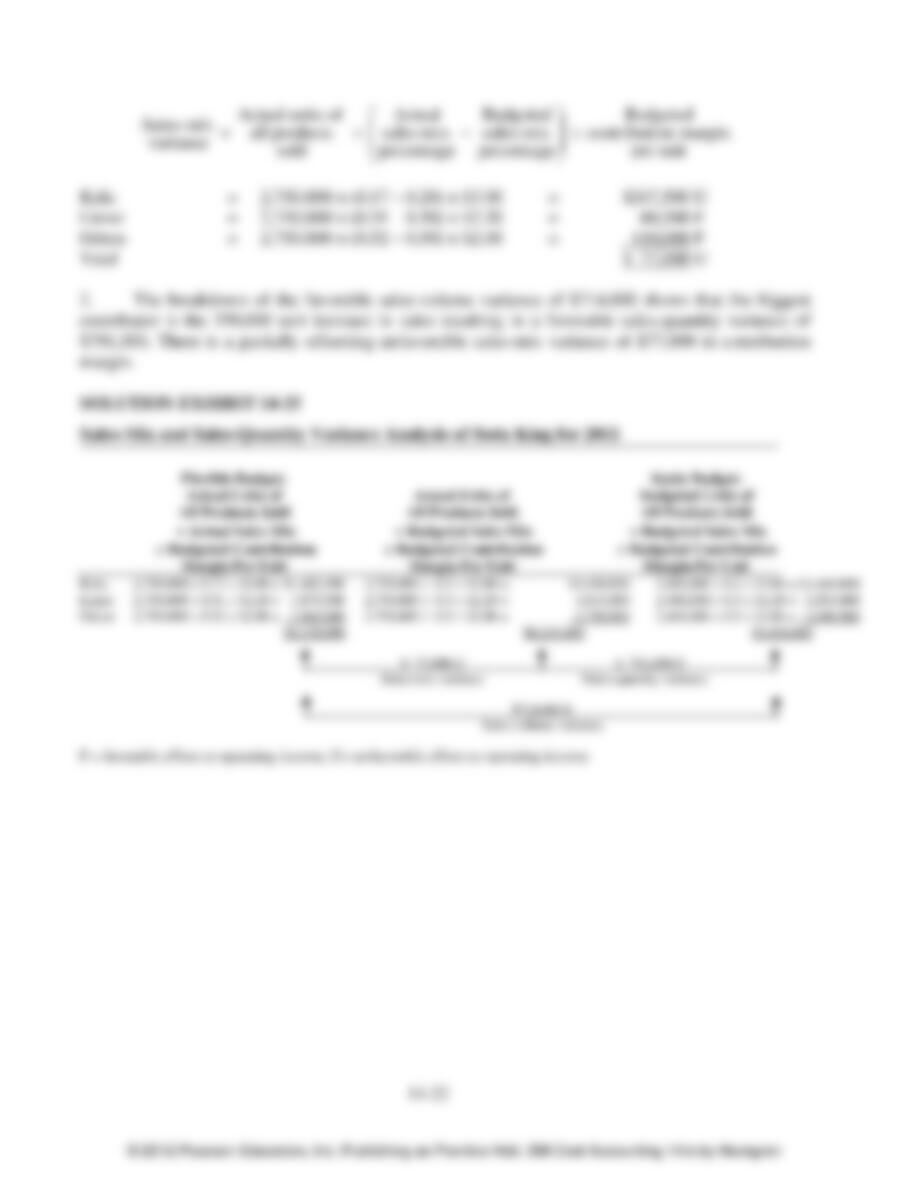
14–12 The total sales–mix variance arises from differences in the budgeted contribution margin
of the actual and budgeted sales mix. The composite unit concept enables the effect of individual
product changes to be summarized in a single intuitive number by using weights based on the
mix of individual units in the actual and budgeted mix of products sold.
© 2012 Pearson Education, Inc. Publishing as Prentice Hall. SM Cost Accounting 14/e by Horngren

14–3
14–13 A favorable sales–quantity variance arises because the actual units of all products sold
exceed the budgeted units of all products sold.
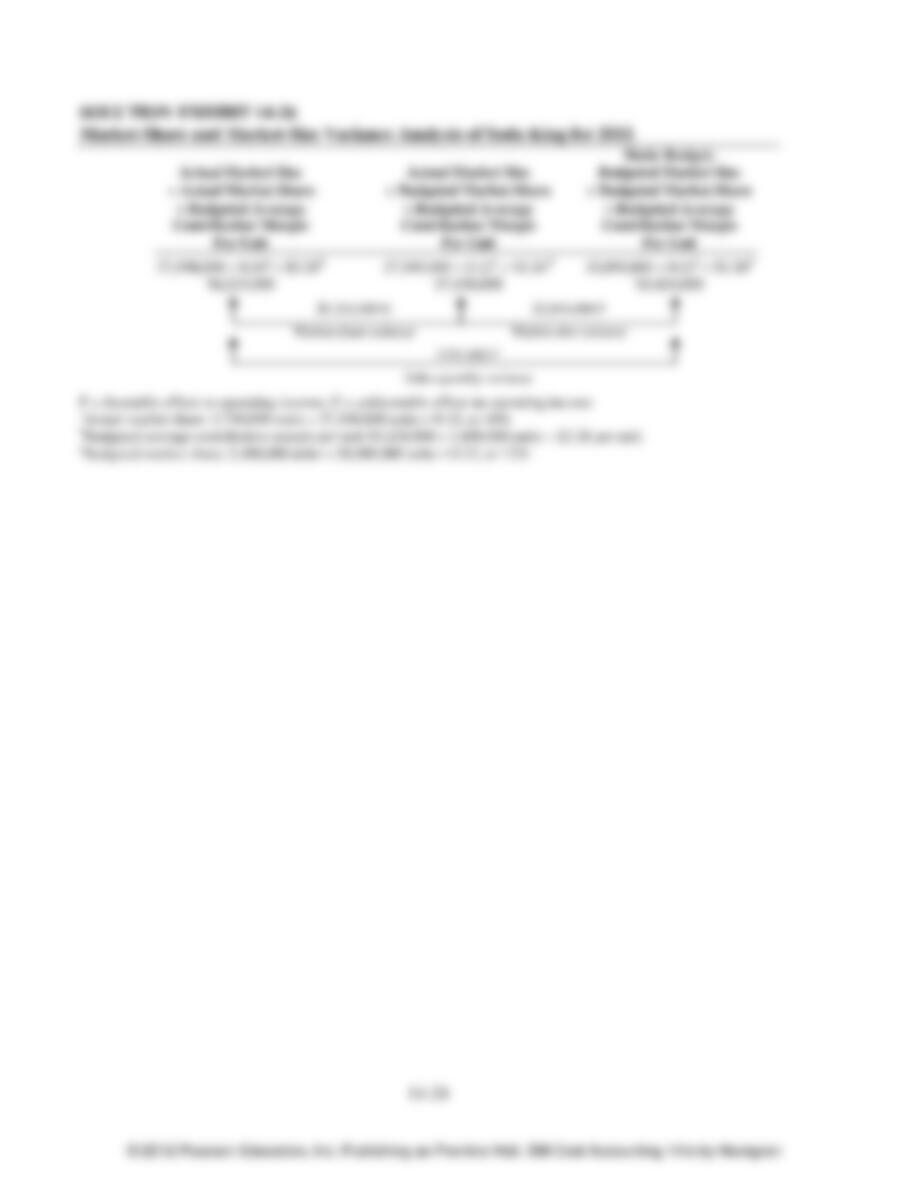
14–14 The sales–quantity variance can be decomposed into (a) a market–size variance (which
arises when the actual total market size in units is different from the budgeted market size in
units), and (b) a market share variance (which arises when the actual market share of a company
is different from its budgeted market share). Both variances use the budgeted average
contribution margin per unit.
14–15 The direct materials efficiency variance is a Level 3 variance. Further insight into this
variance can be gained by moving to a Level 4 analysis where the effect of mix and yield
changes are quantified. The mix variance captures the effect of a change in the relative
percentage use of each input relative to that budgeted. The yield variance captures the effect of a
change in the total number of inputs required to obtain a given output relative to that budgeted.
14–16 (15-20 min.) Cost allocation in hospitals, alternative allocation criteria.
1. Direct costs = $2.40
Indirect costs ($11.52 – $2.40) = $9.12
Overhead rate = Error!= 380%
2. The answers here are less than clear–cut in some cases.
Overhead Cost Item
Allocation Criteria
Processing of paperwork for purchase
Supplies room management fee
Operating-room and patient-room handling costs
Administrative hospital costs
University teaching-related costs
Malpractice insurance costs
Cost of treating uninsured patients
Profit component
Cause and effect
Benefits received
Cause and effect
Benefits received
Ability to bear
Ability to bear or benefits received
Ability to bear
None. This is not a cost.
3. Assuming that Meltzer’s insurance company is responsible for paying the $4,800 bill,
Meltzer probably can only express outrage at the amount of the bill. The point of this question is
to note that even if Meltzer objects strongly to one or more overhead items, it is his insurance
company that likely has the greater incentive to challenge the bill. Individual patients have very
little power in the medical arena. In contrast, insurance companies have considerable power and
may decide that certain costs are not reimbursable—for example, the costs of treating uninsured
patients.
© 2012 Pearson Education, Inc. Publishing as Prentice Hall. SM Cost Accounting 14/e by Horngren

14–4
14–17 (15 min.) Cost Allocation and Decision Making
1. Allocations based on revenues.
Arizona
Colorado
Delaware
Florida
Total
1. Revenues
7,800,000
8,500,000
6,200,000
5,500,000
28,000,000
2. % revenues
(7,800,000; 8,500,000;
6,200,000; 5,500,000 ÷
28,000,000)
27.86%
30.36%
22.14%
19.64%
100%
3. Allocated headquarter cost
(Row 2 × $5,600,000)
$1,560,160
$1,700,160
$1,239,840
$1,099,840
$5,600,000
Arizona
Colorado
Delaware
Florida
Total
Segment margin
$2,500,000
$4,400,000
$1,900,000
$ 900,000
$9,700,000
Less: Headquarter costs
1,560,160
1,700,160
1,239,840
1,099,840
5,600,000
Division margin
$ 939,840
$2,699,840
$ 660,160
$ (199,840)
$4,100,000
Allocations based on direct costs.
Arizona
Colorado
Delaware
Florida
Total
1. Direct Costs
$5,300,000
$4,100,000
$4,300,000
$4,600,000
$18,300,000
2. % direct costs
$5,300,000; $4,100,000;
$4,300,000; $4,600,000
÷ $18,300,000
28.96%
22.40%
23.50%
25.14%
100%
3. Allocated headquarter cost
(Row 2 × $5,600,000)
$1,621,760
$1,254,400
$1,316,000
$1,407,840
$ 5,600,000
Arizona
Colorado
Delaware
Florida
Total
Segment margin
$2,500,000
$4,400,000
$1,900,000
$ 900,000
$9,700,000
Less: Headquarter costs
1,621,760
1,254,400
1,316,000
1,407,840
5,600,000
Division margin
$ 878,240
$3,145,600
$ 584,000
$ (507,840)
$4,100,000
Allocations based on segment margin.
Arizona
Colorado
Delaware
Florida
Total
1. Segment Margins
$2,500,000
$4,400,000
$1,900,000
$900,000
$9,700,000
2. % segment margins
$2,500,000; $4,400,000;
$1,900,000; $900,000
÷ $9,700,000
25.77%
45.36%
19.59%
9.28%
100%
3. Allocated headquarter cost
(Row 2 × $5,600,000)
$1,443,120
$2,540,160
$1,097,040
$519,680
$5,600,000
© 2012 Pearson Education, Inc. Publishing as Prentice Hall. SM Cost Accounting 14/e by Horngren

14–5
Arizona
Colorado
Delaware
Florida
Total
Segment margin
$2,500,000
$4,400,000
$1,900,000
$900,000
$9,700,000
Less: Headquarter costs
1,443,120
2,540,160
1,097,040
519,680
5,600,000
Division margin
$1,056,880
$1,859,840
$ 802,960
$380,320
$4,100,000
Allocations based on number of employees.
Arizona
Colorado
Delaware
Florida
Total
1. Number of Employees
2,000
4,000
1,500
500
8,000
2. % segment margins
$2,000; $4,000; $1,500; 500
÷ $8,000
25%
50%
18.75%
6.25%
100%
3. Allocated headquarter cost
(Row 2 × $5,600,000)
$1,400,000
$2,800,000
$1,050,000
$350,000
$5,600,000
Arizona
Colorado
Delaware
Florida
Total
Segment margin
$2,500,000
$4,400,000
$1,900,000
$900,000
$9,700,000
Less: Headquarter costs
1,400,000
2,800,000
1,050,000
350,000
5,600,000
Division margin
$1,100,000
$1,600,000
$ 850,000
$550,000
$4,100,000
2. The Florida Division manager will prefer the number of employees as the allocation base
because it results in the highest operating margin for the division.
3. The Arizona Division and the Delaware Division receive roughly the same percentage
allocation of headquarter costs regardless of the allocation base used (Arizona range =
25%-29%; Delaware range = 18.75%–23.5%). However, the Colorado Division and the
Florida Division vary widely (Colorado range = 22.4%–50%; Florida range = 6.25%–
25.1%). All four methods are reasonable options, but none clearly meets the cause–and-
effect criterion for selecting the allocation base. If larger divisions tend to consume more
of headquarters’ resources, then using division revenues or number of employees seem to
be the best choices. Without compelling reason to change, Greenbold should stay with the
division revenues as the allocation base.
Another alternative is to use segment margin as the allocation base on the grounds that
this best captures the ability of different divisions to bear corporate overhead costs.
4. If Greenbold elects to use direct costs as the allocation base, the Florida Division will
appear to have a $507,840 operating loss. Even so, the Florida Division generates a
$900,000 segment margin before allocating the cost of the corporate headquarters. As seen
in the analysis in requirement 1, different allocation bases yield different operating incomes
for the Florida Division, with the direct cost allocation base being the lowest. The Florida
Division should not be closed because 1) the choice of allocation base is not based on a
cause–and–effect relation (i.e., it is arbitrary), and 2) the division earns positive segment
margin which contributes to covering the cost of the corporate headquarters. The Florida
Division should only be closed if closing it will save more than $507,840 in corporate
headquarter costs – a highly unlikely scenario.
© 2012 Pearson Education, Inc. Publishing as Prentice Hall. SM Cost Accounting 14/e by Horngren

14–6
14–18 (30 min.) Cost allocation to divisions.
1.
Hotel
Restaurant
Casino
Rembrandt
Revenue
$16,425,000
$5,256,000
$12,340,000
$34,021,000
Direct costs
9,819,260
3,749,172
4,248,768
17,817,200
Segment margin
$ 6,605,740
$1,506,828
$ 8,091,232
16,203,800
Fixed overhead costs
14,550,000
Income before taxes
$ 1,653,800
Segment margin %
40.22%
28.67%
65.57%
2.
Hotel
Restaurant
Casino
Rembrandt
Direct costs
$9 819 260
$3 749 172
$4 248 768
$17 817 200
Direct cost %
55.11%
21.04%
23.85%
100.00%
Square footage
80,000
16,000
64,000
160,000
Square footage %
50.00%
10.00%
40.00%
100.00%
Number of employees
200
50
250
500
Number of employees %
40.00%
10.00%
50.00%
100.00%
A: Cost allocation based on direct costs:
Hotel
Restaurant
Casino
Rembrandt
Revenue
$16,425,000
$ 5,256,000
$12,340,000
$34,021,000
Direct costs
9,819,260
3,749,172
4,248,768
17,817,200
Segment margin
6,605,740
1,506,828
8,091,232
16,203,800
Allocated fixed overhead costs
8,018,505
3,061,320
3,470,175
14,550,000
Segment pre-tax income
$ (1,412,765)
$(1,554,492)
$ 4,621,057
$ 1,653,800
Segment pre-tax income % of rev.
-8.60%
-29.58%
37.45%
B: Cost allocation based on floor space:
Hotel
Restaurant
Casino
Rembrandt
Allocated fixed overhead costs
$ 7,275,000
$ 1,455,000
$ 5,820,000
$14,550,000
Segment pre-tax income
$ (669,260)
$ 51,828
$ 2,271,232
$ 1,653,800
Segment pre-tax income % of rev.
-4.07%
0.99%
18.41%
C: Cost allocation based on number of employees
Hotel
Restaurant
Casino
Rembrandt
Allocated fixed overhead costs
$ 5,820,000
$ 1,455,000
$ 7,275,000
$14,550,000
Segment pre-tax income
$ 785,740
$ 51,828
$ 816,232
$ 1,653,800
Segment pre-tax income % of rev.
4.78%
0.99%
6.61%
© 2012 Pearson Education, Inc. Publishing as Prentice Hall. SM Cost Accounting 14/e by Horngren

14–7
3. Requirement 2 shows the dramatic effect of the choice of cost allocation base on segment
pre–tax income as a percentage of revenues:
Pre-tax Income Percentage
Allocation Base
Hotel
Restaurant
Casino
Direct costs
–8.60%
–29.58%
37.45%
Floor space
–4.07
0.99
18.41
Number of employees
4.78
0.99
6.61
The decision context should guide (a) whether costs should be allocated, and (b) the
preferred cost allocation base. Decisions about, say, performance measurement, may be made on
a combination of financial and nonfinancial measures. It may well be that Rembrandt may prefer
to exclude allocated costs from the financial measures to reduce areas of dispute.
Where cost allocation is required, the cause–and–effect and benefits–received criteria are
recommended in Chapter 14. The $14,550,000 is a fixed overhead cost. This means that on a
short–run basis, the cause–and–effect criterion is not appropriate but Rembrandt could attempt to
identify the cost drivers for these costs in the long run when these costs are likely to be more
variable. Rembrandt should look at how the $14,550,000 cost benefits the three divisions. This
will help guide the choice of an allocation base in the short run.
4. The analysis in requirement 2 should not guide the decision on whether to shut down any
of the divisions. The overhead costs are fixed costs in the short run. It is not clear how these
costs would be affected in the long run if Rembrandt shut down one of the divisions. Also, each
division is not independent of the other two. A decision to shut down, say, the restaurant, likely
would negatively affect the attendance at the casino and possibly the hotel. Rembrandt should
examine the future revenue and future cost implications of different resource investments in the
three divisions. This is a future–oriented exercise, whereas the analysis in requirement 2 is an
analysis of past costs.
© 2012 Pearson Education, Inc. Publishing as Prentice Hall. SM Cost Accounting 14/e by Horngren

14–8
14–19 (25 min.) Cost allocation to divisions.
Percentages for various allocation bases (old and new):
Pulp
Paper
Fibers
Total
(1) Division margin percentages
$2,400,000; $7,100,000; $9,500,000
$19,000,000
12.63157%
37.36843%
50.0%
100.0%
(2) Share of employees
$350; 250; 400 1,000
35.0
25.0
40.0
100.0
(3) Share of floor space
35,000; 24,000; 66,000 125,000
28.0
19.2
52.8
100.0
(4) Share of total division administrative costs
$2,000,000; $1,800,000; $3,200,000
$7,000,000
28.57142
25.71428
45.71428
100.0
1.
Pulp
Paper
Fibers
Total
(5) Division margin
$2,400,000
$ 7,100,000
$ 9,500,000
$19,000,000
(6) Corporate overhead allocated on segment
margins = (1) $9,000,000
1,136,842
3,363,158
4,500,000
9,000,000
(7) Operating margin with division-margin-based
allocation = (5) – (6)
$1,263,158
$ 3,736,842
$ 5,000,000
$10,000,000
(8) Revenues
$8,500,000
$17,500,000
$24,000,000
$50,000,000
Operating margin as a percentage of revenues
14.9%
21.3%
20.8%
20.0%
2.
Pulp
Paper
Fibers
Total
(5) Division margin
$2,400,000
$ 7,100,000
$ 9,500,000
$19,000,000
HRM costs (alloc. base: no. of
employees)
= (2) $1,800,000
630 ,000
450,000
720,000
1,800,000
Facility costs (alloc. base: floor space)
= (3) $2,700,000
756,000
518,400
1,425,600
2,700,000
Corp. admin (alloc. base: div. admin
costs)
= (4) $4,500,000
1,285,714
1,157,143
2,057,143
4,500,000
Corp. overhead allocated to each division
2,671,714
2,125,543
4,202,743
9,000,000
Operating margin with cause-and-effect
allocation
$(271,714)
$ 4,974,457
$ 5,297,257
$10,000,000
(8) Revenues
$8,500,000
$17,500,000
$24,000,000
$50,000,000
Operating margin as a percentage of
revenues
-3.2%
28.4%
22.1%
20.0 %
© 2012 Pearson Education, Inc. Publishing as Prentice Hall. SM Cost Accounting 14/e by Horngren

14–9
3. When corporate overhead is allocated to the divisions on the basis of division margins
(requirement 1), each division is profitable (has positive operating margin) and the Paper
division is the most profitable (has the highest operating margin percentage) by a slim margin,
while the Pulp division is the least profitable. When Bardem’s suggested bases are used to
allocate the different types of corporate overhead costs (requirement 2), we see that, in fact, the
Pulp division is not profitable (it has a negative operating margin). Paper continues to be the
most profitable and, in fact, it is significantly more profitable than the Fibers division.
If division performance is linked to operating margin percentages, Pulp will resist this
new way of allocating corporate costs, which causes its operating margin of nearly 15% (in the
old scheme) to be transformed into a –3.2% operating margin. The new cost allocation
methodology reveals that, if the allocation bases are reasonable, the Pulp division consumes a
greater share of corporate resources than its share of segment margins would indicate. Pulp
generates 12.6% of the segment margins, but consumes almost 29.7% ($2,671,714
$9,000,000) of corporate overhead resources. Paper will welcome the change—its operating
margin percentage rises the most, and Fiber’s operating margin percentage remains practically
the same.
Note that in the old scheme, Paper was being penalized for its efficiency (smallest share of
administrative costs), by being allocated a larger share of corporate overhead. In the new
scheme, its efficiency in terms of administrative costs, employees, and square footage is being
recognized.
4. The new approach is preferable because it is based on cause–and–effect relationships
between costs and their respective cost drivers in the long run.
Human resource management costs are allocated using the number of employees in each
division because the costs for recruitment, training, etc., are mostly related to the number of
employees in each division. Facility costs are mostly incurred on the basis of space occupied by
each division. Corporate administration costs are allocated on the basis of divisional
administrative costs because these costs are incurred to provide support to divisional
administrations.
To overcome objections from the divisions, Bardem may initially choose not to allocate
corporate overhead to divisions when evaluating performance. He could start by sharing the
results with the divisions, and giving them—particularly the Pulp division—adequate time to
figure out how to reduce their share of cost drivers. He should also develop benchmarks by
comparing the consumption of corporate resources to competitors and other industry standards.
© 2012 Pearson Education, Inc. Publishing as Prentice Hall. SM Cost Accounting 14/e by Horngren

14–10
14–20 (30 min.) Customer profitability, customer–cost hierarchy.
1.
All amounts in thousands of U.S. dollars
Wholesale
Retail
North America
South America
Big Sam
World
Wholesaler
Wholesaler
Stereo
Market
Revenues at list prices
$435,000
$550,000
$150,000
$115,000
Price discounts
30,000
44,000
7,200
520
Revenues (at actual prices)
405,000
506,000
142,800
114,480
Cost of goods sold
330,000
475,000
123,000
84,000
Gross margin
75,000
31,000
19,800
30,480
Customer-level operating costs
Delivery
475
690
220
130
Order processing
750
1,020
175
120
Sales visit
5,400
2,500
2,500
1,400
Total customer-level oper. costs
6,625
4,210
2,895
1,650
Customer-level operating. income
$ 68,375
$ 26,790
$ 16,905
$ 28,830
© 2012 Pearson Education, Inc. Publishing as Prentice Hall. SM Cost Accounting 14/e by Horngren

14–11
2.
Customer Distribution Channels
(all amounts in $000s)
Wholesale Customers
Retail Customers
Total
Total
North America
South America
Total
Big Sam
World
(all customers)
Wholesale
Wholesaler
Wholesaler
Retail
Stereo
Market
(1) = (2) + (5)
(2) = (3) + (4)
(3)
(4)
(5) = (6) + (7)
(6)
(7)
Revenues (at actual prices)
$1,168,280
$911,000
$405,000
$506,000
$257,280
$142,800
$114,480
Customer-level costs
1,027,380
815,835
336,625 a
479,210 a
211,545
125,895 a
85,650 a
Customer-level operating income
140,900
95,165
$ 68,375
$ 26,790
45,735
$ 16,905
$ 28,830
Distribution-channel costs
39,000
34,000
5,000
Distribution-channel-level oper. income
101,900
$ 61,165
$ 40,735
Corporate-sustaining costs
61,000
Operating income
$ 40,900
aCost of goods sold + Total customer–level operating costs from Requirement 1
3. If corporate costs are allocated to the channels, the retail channel will show an operating profit of
$27,735,000 ($40,735,000 – $13,000,000), and the wholesale channel will show an operating profit of
$13,165,000 ($61,165,000 – $48,000,000). The overall operating profit, of course, is still $40,900,000,
as in requirement 2. There is, however, no cause–and–effect or benefits–received relationship between
corporate costs and any allocation base, i.e., the allocation of $48,000,000 to the wholesale channel and
$13,000,000 to the retail channel is arbitrary and not useful for decision–making. Therefore, the
management of Orsack Electronics should not base any performance evaluations or
investment/disinvestment decisions based on these channel–level operating income numbers. They may
want to take corporate costs into account, however, when making long–run pricing decisions.
© 2012 Pearson Education, Inc. Publishing as Prentice Hall. SM Cost Accounting 14/e by Horngren

14–21 (20 30 min.) Customer profitability, service company.
1.
Avery
Okie
Wizard
Grainger
Duran
Revenues
$260,000
$200,000
$322,000
$122,000
$212,000
Technician and equipment cost
182,000
175,000
225,000
107,000
178,000
Gross margin
78,000
25,000
97,000
15,000
34,000
Service call handling
($75 150; 240; 40; 120; 180)
11,250
18,000
3,000
9,000
13,500
Web-based parts ordering
($80 120; 210; 60; 150; 150)
9,600
16,800
4,800
12,000
12,000
Billing/Collection
($50 30; 90; 90; 60; 120)
1,500
4,500
4,500
3,000
6,000
Database maintenance
($10 150; 240; 40; 120; 180)
1,500
2,400
400
1,200
1,800
Customer-level operating income
$ 54,150
$ (16,700)
$ 84,300
$(10,200)
$ 700
$ 322,000
200,000
$1,116,000