13–1
CHAPTER 13
STRATEGY, BALANCED SCORECARD, AND
STRATEGIC PROFITABILITY ANALYSIS
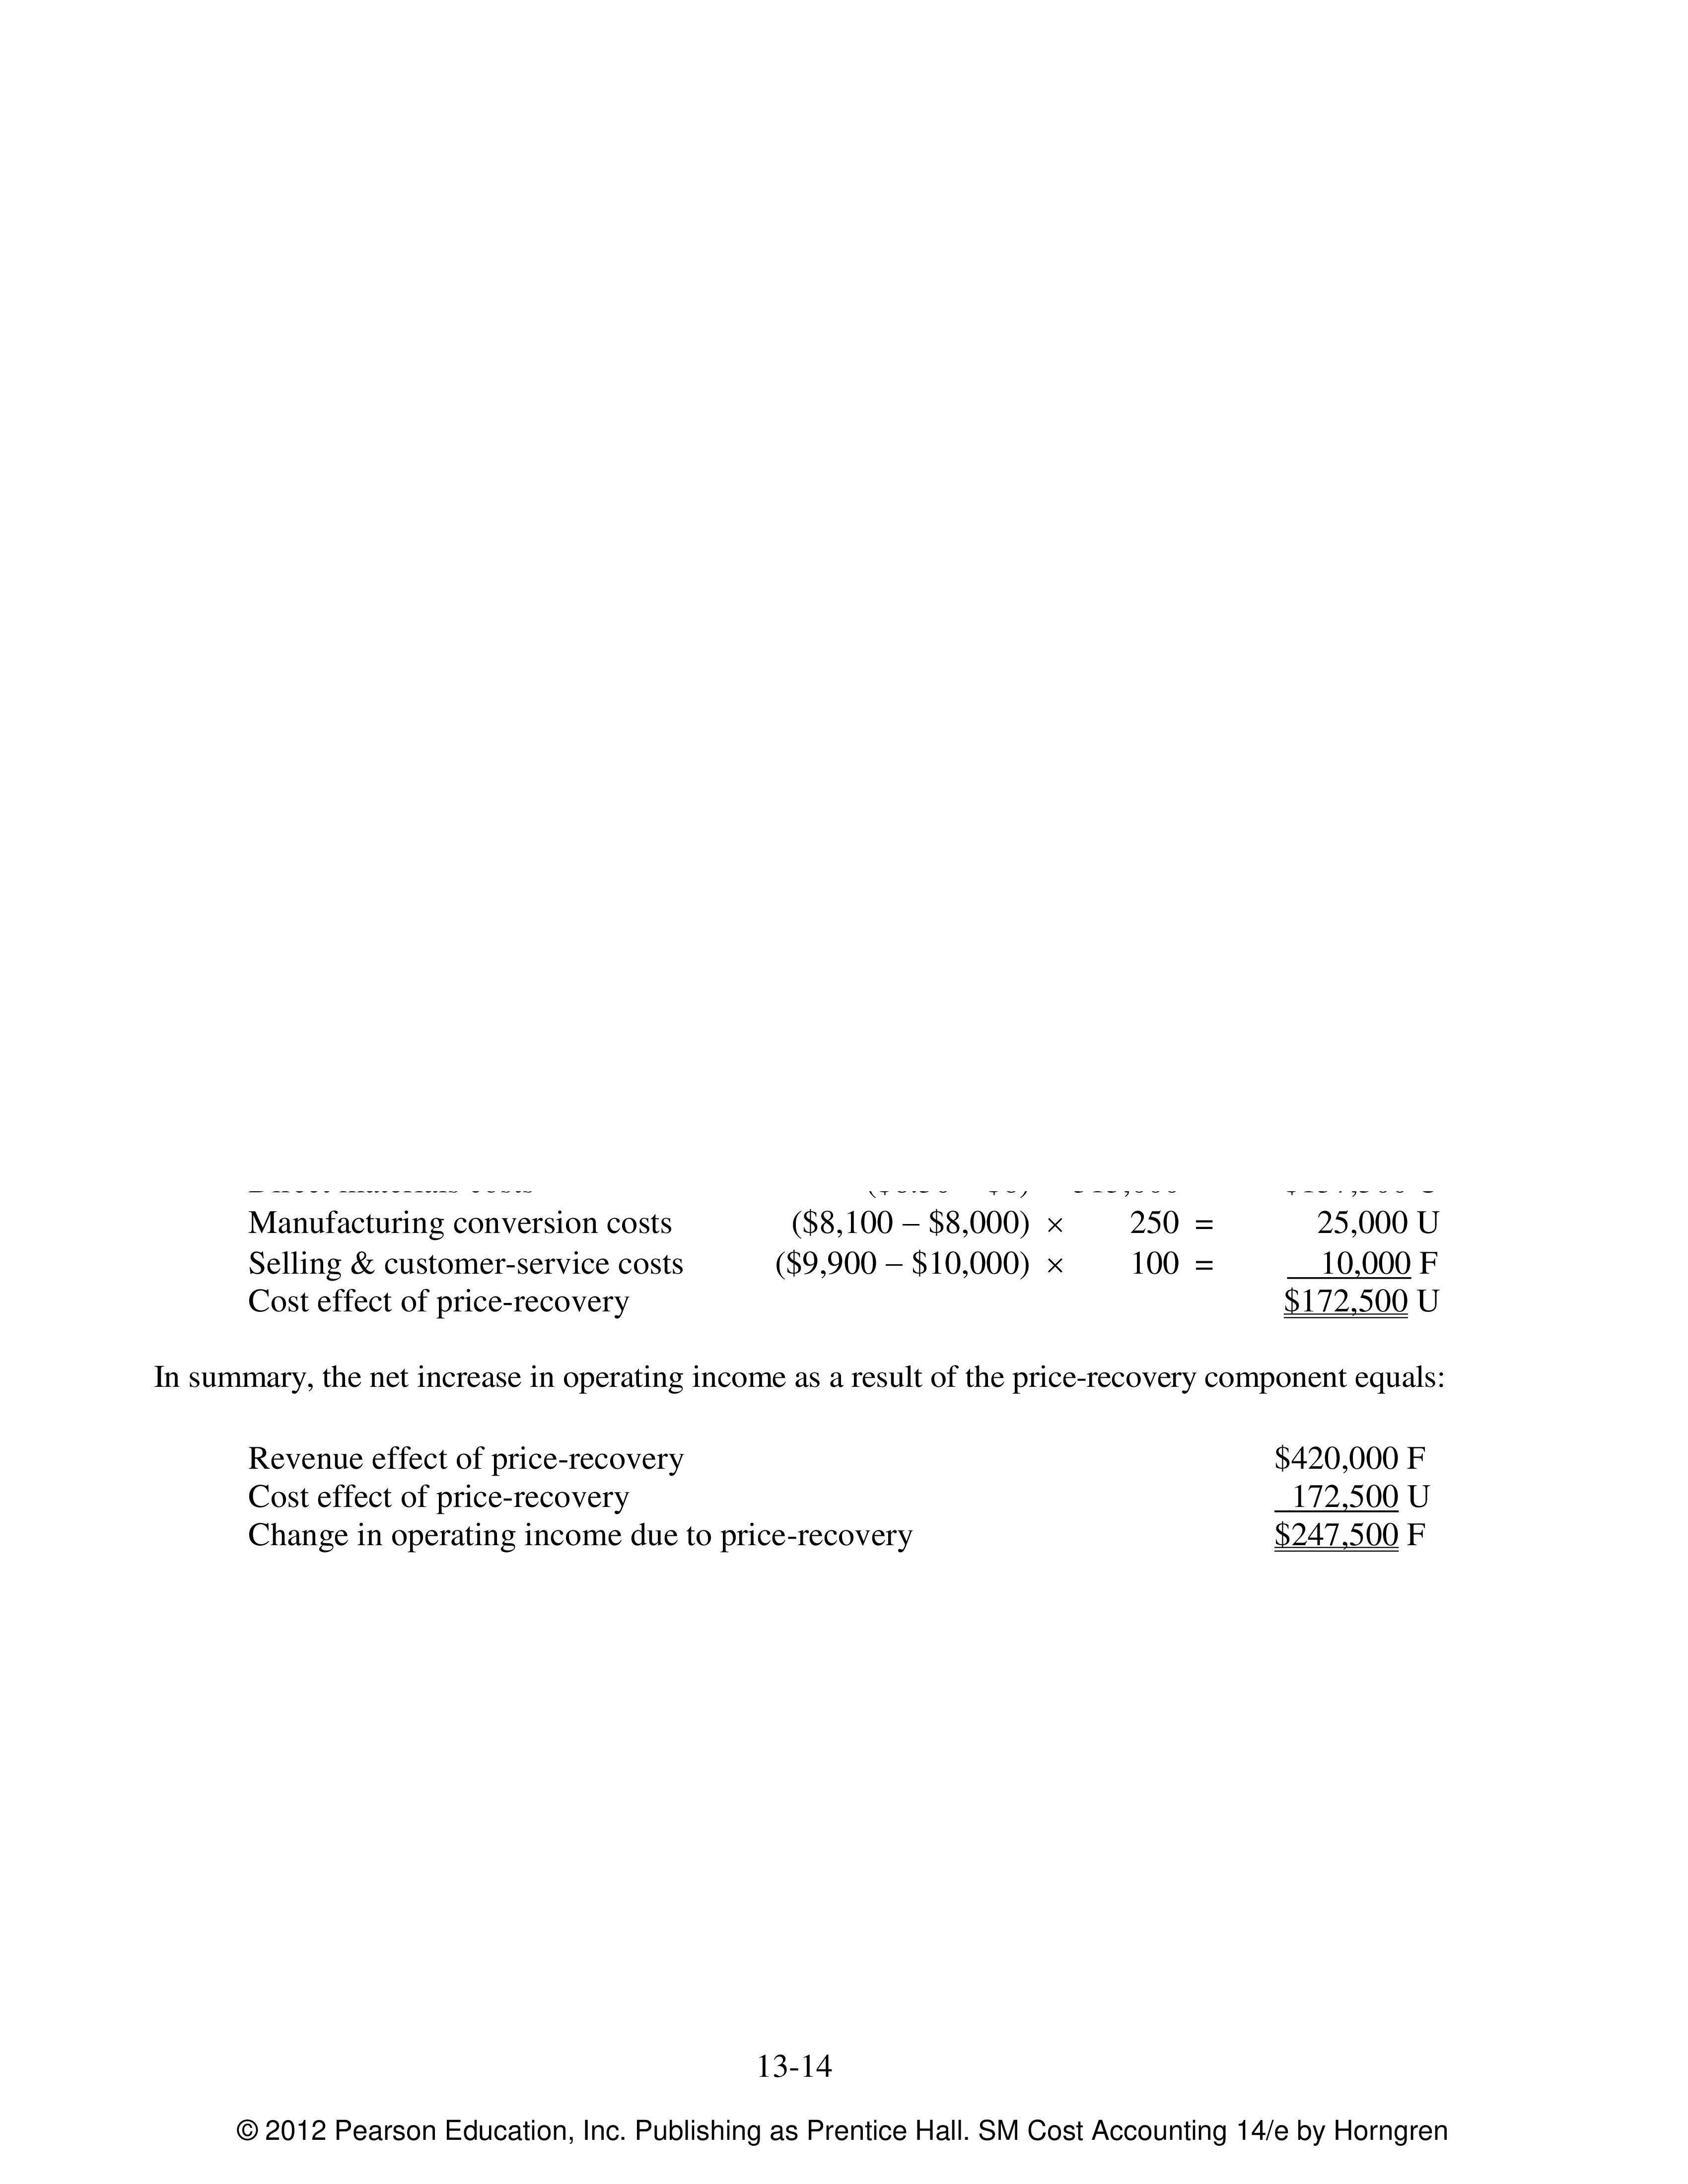
13–1 Strategy specifies how an organization matches its own capabilities with the
opportunities in the marketplace to accomplish its objectives.
13–2 The five key forces to consider in industry analysis are: (a) competitors, (b) potential
entrants into the market, (c) equivalent products, (d) bargaining power of customers, and (e)
bargaining power of input suppliers.
13–3 Two generic strategies are (1) product differentiation, an organization’s ability to offer
products or services perceived by its customers to be superior and unique relative to the products
or services of its competitors and (2) cost leadership, an organization’s ability to achieve lower
costs relative to competitors through productivity and efficiency improvements, elimination of
waste, and tight cost control.
13–4 A customer preference map describes how different competitors perform across various
product attributes desired by customers, such as price, quality, customer service and product
features.
13–5 Reengineering is the fundamental rethinking and redesign of business processes to
achieve improvements in critical measures of performance such as cost, quality, service, speed,
and customer satisfaction.
13–6 The four key perspectives in the balanced scorecard are: (1) Financial perspective—this
perspective evaluates the profitability of the strategy and the creation of shareholder value, (2)
Customer perspective—this perspective identifies the targeted customer and market segments
and measures the company’s success in these segments, (3) Internal business process
perspective—this perspective focuses on internal operations that further both the customer
perspective by creating value for customers and the financial perspective by increasing
shareholder value, and (4) Learning and growth perspective—this perspective identifies the
capabilities the organization must excel at to achieve superior internal processes that create value
for customers and shareholders.
13–7 A strategy map is a diagram that describes how an organization creates value by
connecting strategic objectives in explicit cause–and–effect relationships with each other in the
financial, customer, internal business process, and learning and growth perspectives.
13–8 A good balanced scorecard design has several features:
1. It tells the story of a company’s strategy by articulating a sequence of cause–and–effect
relationships.
2. It helps to communicate the strategy to all members of the organization by translating the
strategy into a coherent and linked set of understandable and measurable operational
targets.
3. It places strong emphasis on financial objectives and measures in for–profit companies.
Nonfinancial measures are regarded as part of a program to achieve future financial
performance.
4. It limits the number of measures to only those that are critical to the implementation of
strategy.
© 2012 Pearson Education, Inc. Publishing as Prentice Hall. SM Cost Accounting 14/e by Horngren
13–2
5. It highlights suboptimal tradeoffs that managers may make when they fail to consider
operational and financial measures together.
13–9 Pitfalls to avoid when implementing a balanced scorecard are:
1. Don’t assume the cause–and–effect linkages are precise; they are merely hypotheses. An
organization must gather evidence of these linkages over time.
2. Don’t seek improvements across all of the measures all of the time.
3. Don’t use only objective measures in the balanced scorecard.
4. Don’t fail to consider both costs and benefits of different initiatives before including
these initiatives in the balanced scorecard.
5. Don’t ignore nonfinancial measures when evaluating managers and employees.
13–10 Three key components in doing a strategic analysis of operating income are:
1. The growth component which measures the change in operating income attributable
solely to the change in quantity of output sold from one year to the next.
2. The price–recovery component which measures the change in operating income
attributable solely to changes in the prices of inputs and outputs from one year to the
next.
3. The productivity component which measures the change in costs attributable to a change
in the quantity and mix of inputs used in the current year relative to the quantity and mix of
inputs that would have been used in the previous year to produce current year output.
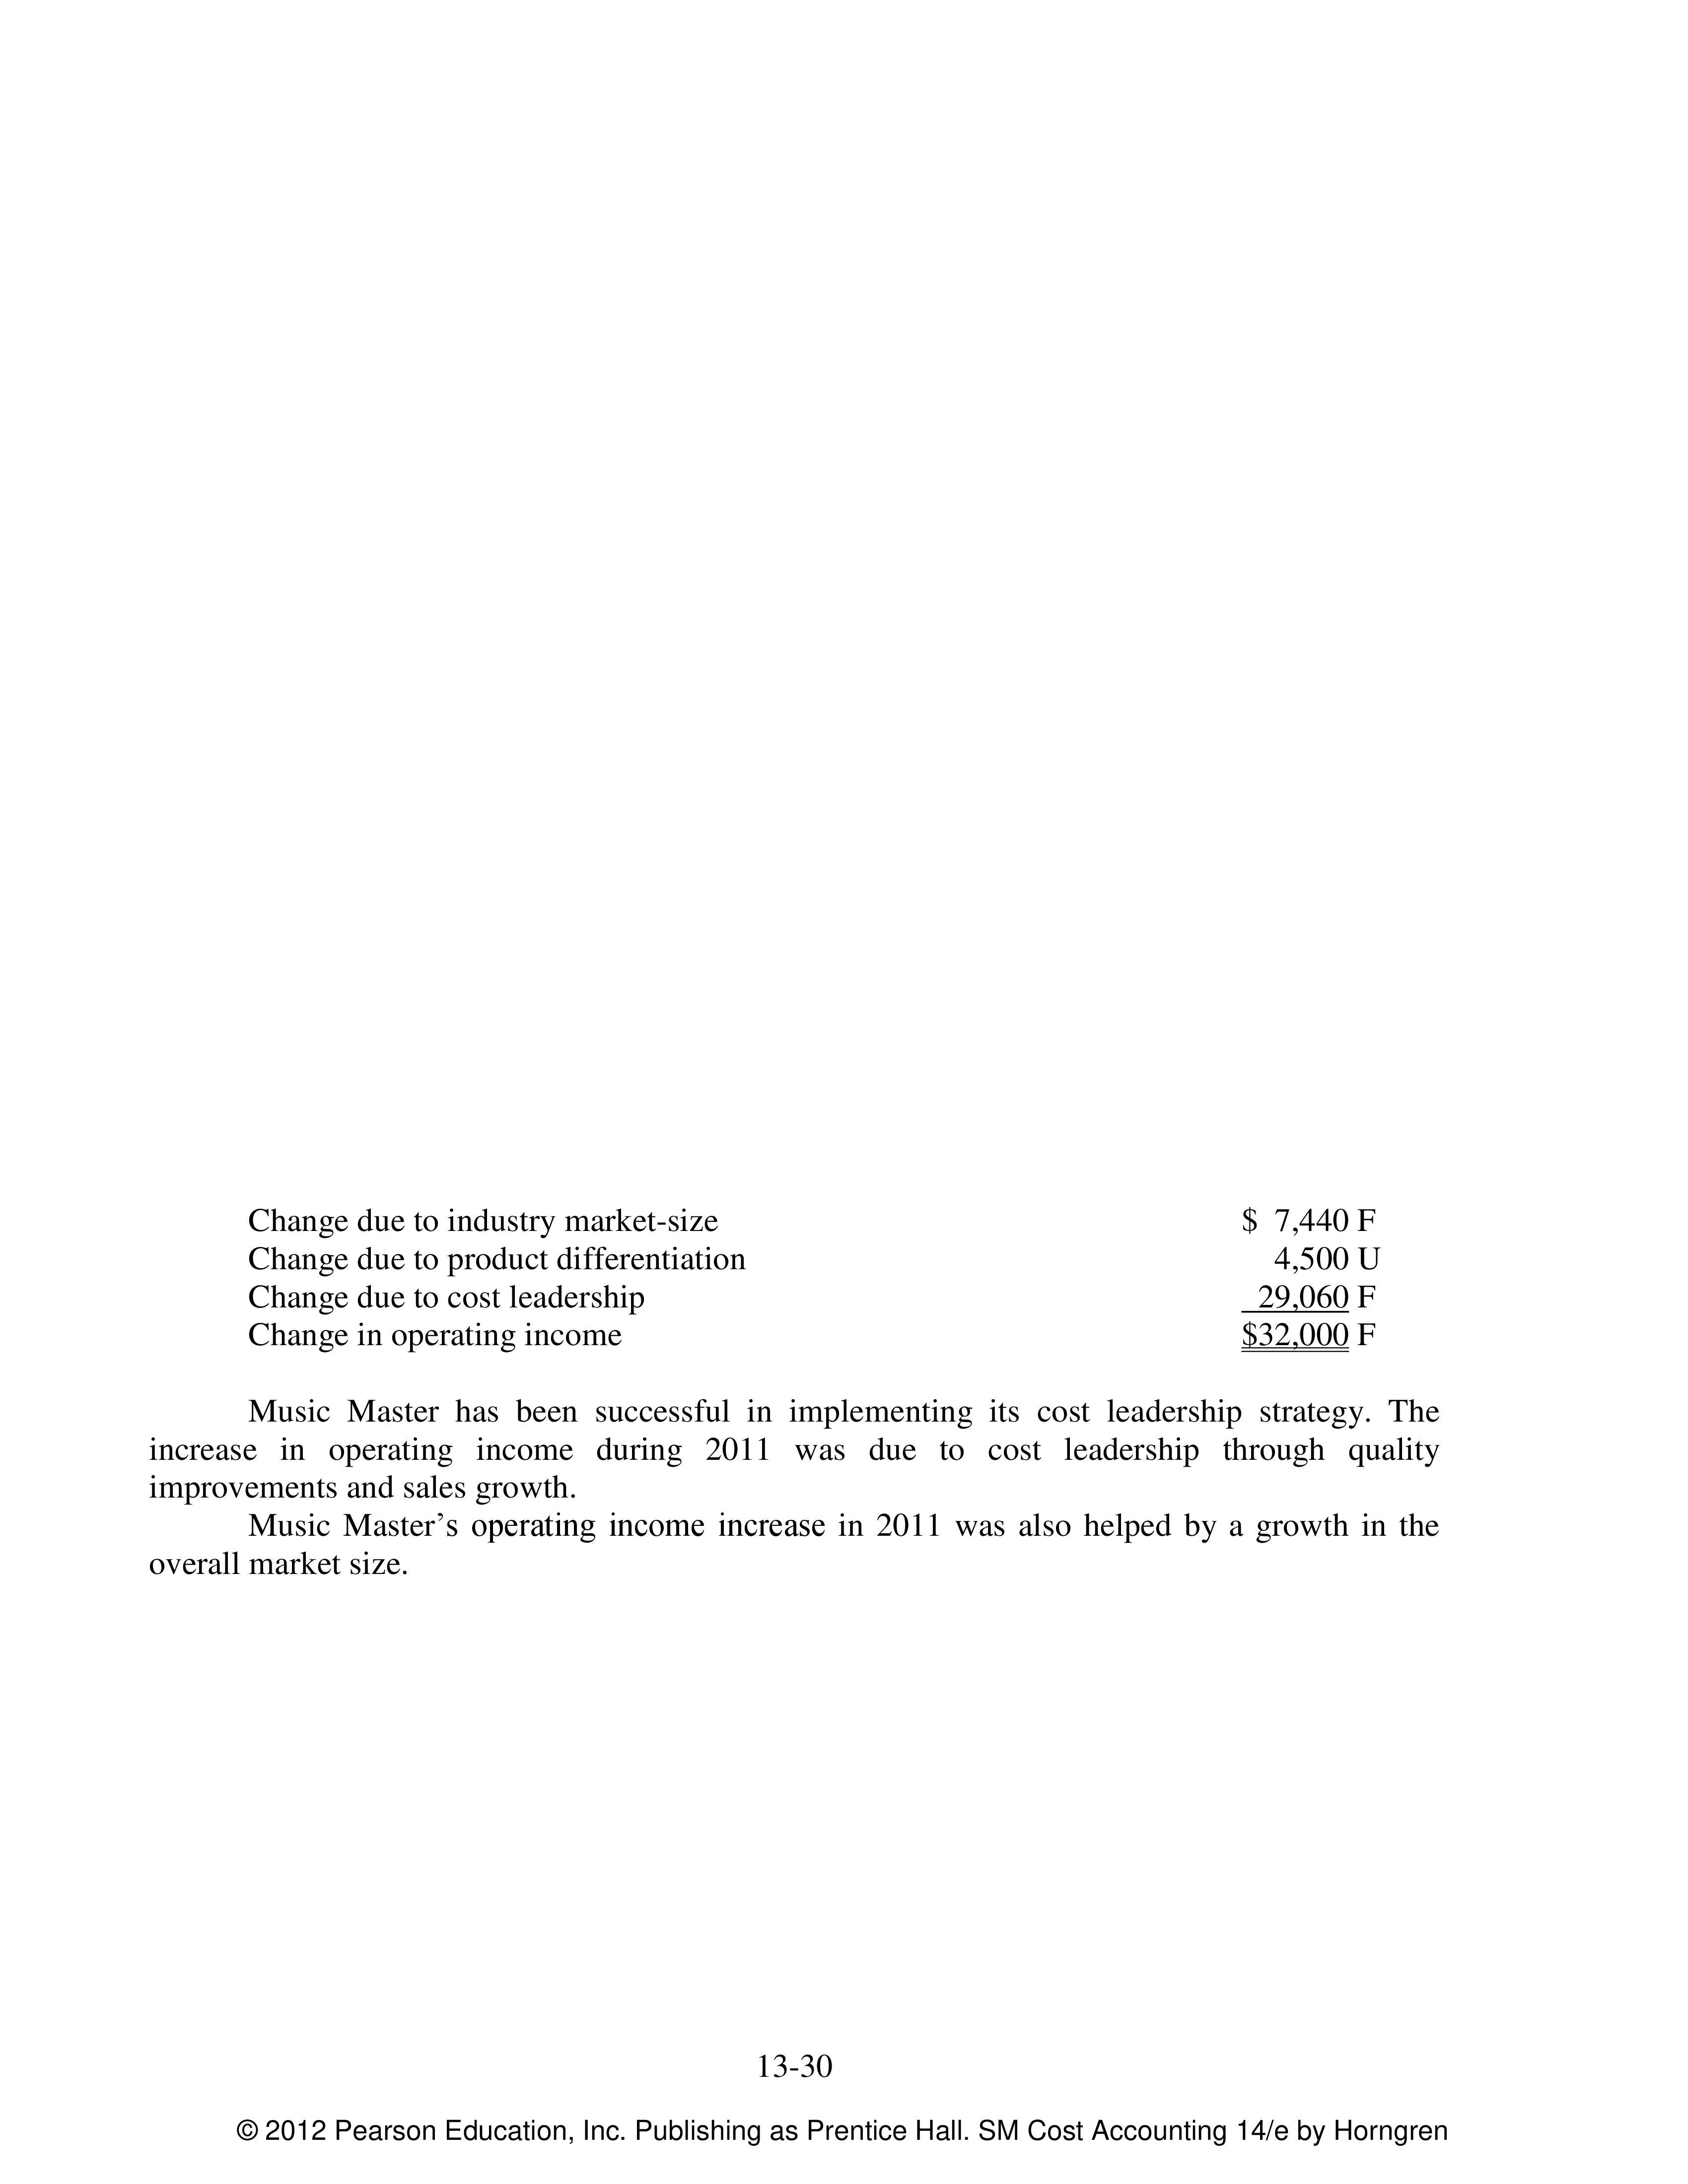
13–11 An analyst can incorporate other factors such as the growth in the overall market and
reductions in selling prices resulting from productivity gains into a strategic analysis of operating
income. By doing so, the analyst can attribute the sources of operating income changes to
particular factors of interests. For example, the analyst will combine the operating income effects
of strategic price reductions and any resulting growth with the productivity component to
evaluate a company’s cost leadership strategy.
13–12 Engineered costs result from a cause–and–effect relationship between the cost driver,
output, and the (direct or indirect) resources used to produce that output. Discretionary costs
arise from periodic (usually annual) decisions regarding the maximum amount to be incurred.
They have no measurable cause–and–effect relationship between output and resources used.
13–13 Downsizing (also called rightsizing) is an integrated approach configuring processes,
products, and people to match costs to the activities that need to be performed to operate
effectively and efficiently in the present and future. Downsizing is an attempt to eliminate
unused capacity.
13–14 A partial productivity measure is the quantity of output produced divided by the quantity
of an individual input used (e.g., direct materials or direct manufacturing labor).
13–15 No. Total factor productivity (TFP) and partial productivity measures work best together
because the strengths of one offset weaknesses in the other. TFP measures are comprehensive,
consider all inputs together, and explicitly consider economic substitution among inputs.
Physical partial productivity measures are easier to calculate and understand and, as in the case
of labor productivity, relate directly to employees’ tasks. Partial productivity measures are also
easier to compare across different plants and different time periods.
© 2012 Pearson Education, Inc. Publishing as Prentice Hall. SM Cost Accounting 14/e by Horngren
13–3
13–16 (15 min.) Balanced scorecard.
1. Ridgecrest’s 2012 strategy is a cost leadership strategy. Ridgecrest plans to grow by
producing high–quality boxes at a low cost delivered to customers in a timely manner.
Ridgecrest’s boxes are not differentiated, and there are many other manufacturers who produce
similar boxes. To succeed, Ridgecrest must produce high–quality boxes at lower costs relative to
competitors through productivity and efficiency improvements.
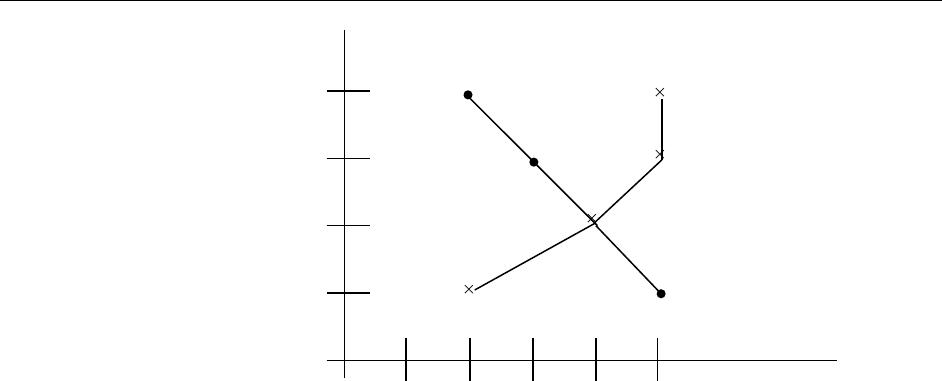
2. Solution Exhibit 13–16A shows the customer preference map for corrugated boxes for
Ridgecrest and Mesa on price, timeliness, quality and design.
SOLUTION EXHIBIT 13–16A
Customer Preference Map for Corrugated Boxes
Price
Delivery Time
Quality
Design
PoorVery good
Attribute Rating
Product Attributes
Kearney
Ridgecrest
1 2 3 4 5
© 2012 Pearson Education, Inc. Publishing as Prentice Hall. SM Cost Accounting 14/e by Horngren
13–4
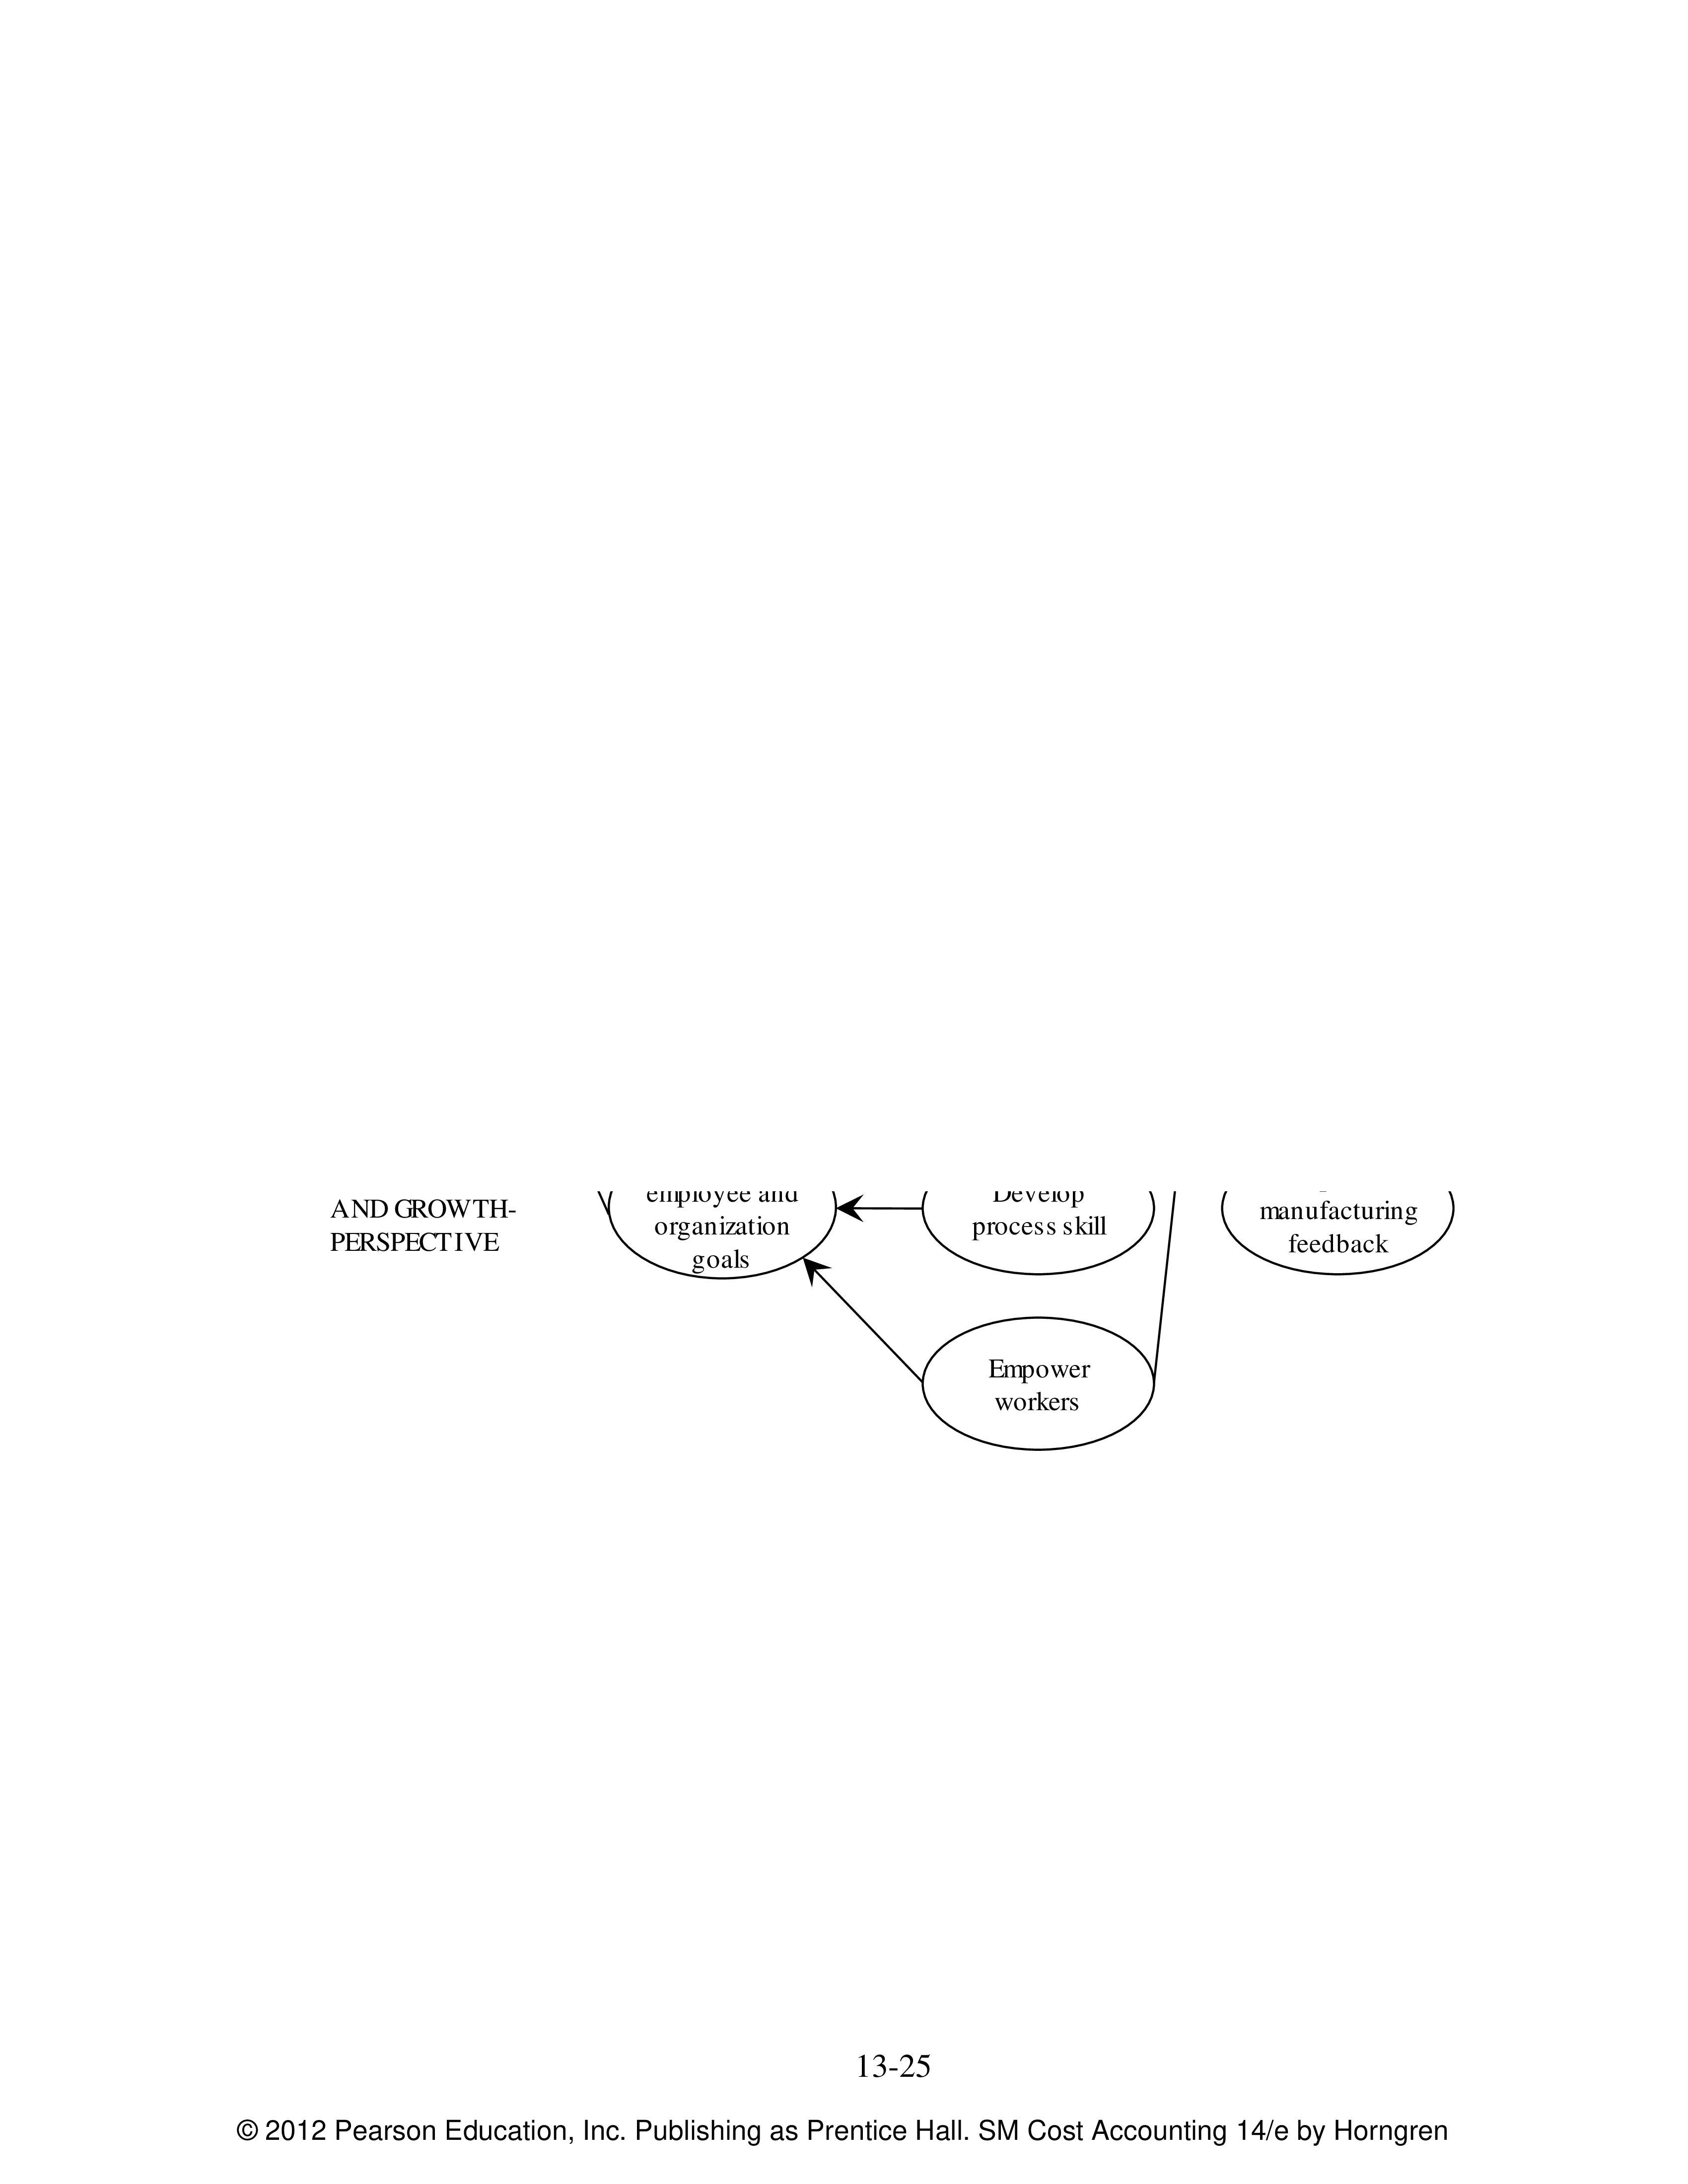
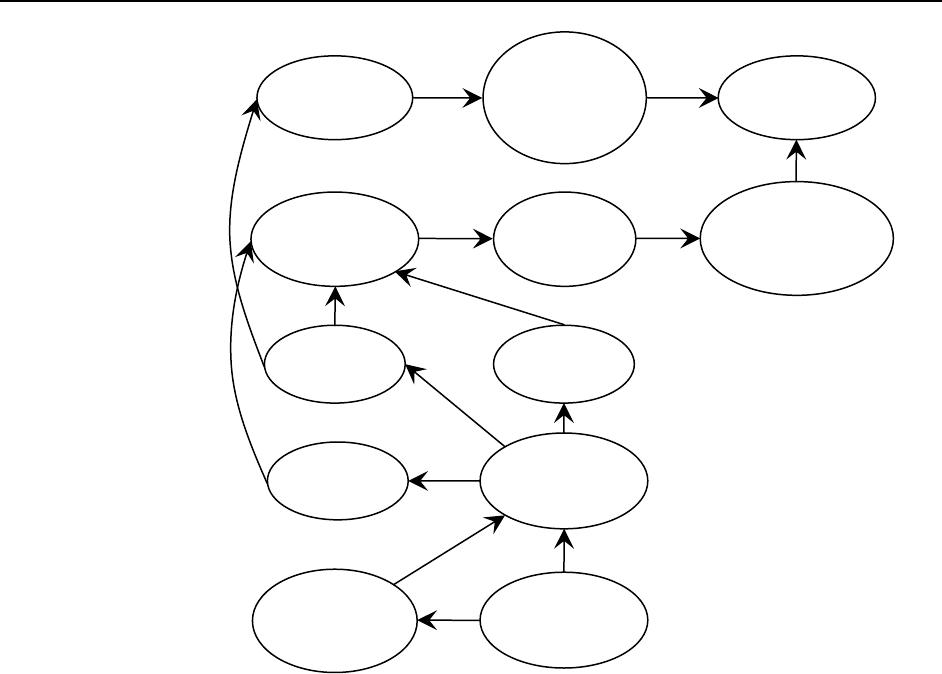
3. Solution Exhibit 13–16B presents the strategy map for Ridgecrest for 2012.
SOLUTION EXHIBIT 13–16B
Strategy Map for Ridgecrest for 2012
FINANCIAL
PERSPECTIVE
CUSTOMER
PERSPECTIVE
INTERNAL–
BUSINESS–
PROCESS
PERSPECTIVE
LEARNING–
AND GROWTH–
PERSPECTIVE
Reduce
Costs
Increase
operating
income from
productivity
Improve
manufacturing
processes
Develop
process skill
Increase
market share in
corrugated
boxes market
Grow
operating
income
Increase
customer
satisfaction
Increase
new
customers
Improve
productivityImprove
quality
Deliver
on–time
Align
employee and
organization
goals
4. Measures that we would expect to see on a Ridgecrest’s balanced scorecard for 2012 are
Financial Perspective
(1) Operating income from productivity gain, (2) operating income from growth, (3) cost
reductions in key areas.
These measures evaluate whether Ridgecrest has successfully reduced costs and generated
growth through cost leadership.
Customer Perspective
(1) Market share in corrugated boxes market, (2) number of new customers, (3) customer
satisfaction index. The logic is that improvements in these customer measures are
leading indicators of whether Ridgecrest’s cost leadership strategy is succeeding with its
customers and helping it to achieve superior financial performance.
(2)
Internal Business Process Perspective
(1) Productivity, (2) order delivery time, (3) on–time delivery, (4) number of major process
improvements.
Improvements in these measures are key drivers of achieving cost leadership and are
expected to lead to more satisfied customers and in turn to superior financial performance
© 2012 Pearson Education, Inc. Publishing as Prentice Hall. SM Cost Accounting 14/e by Horngren
13–5
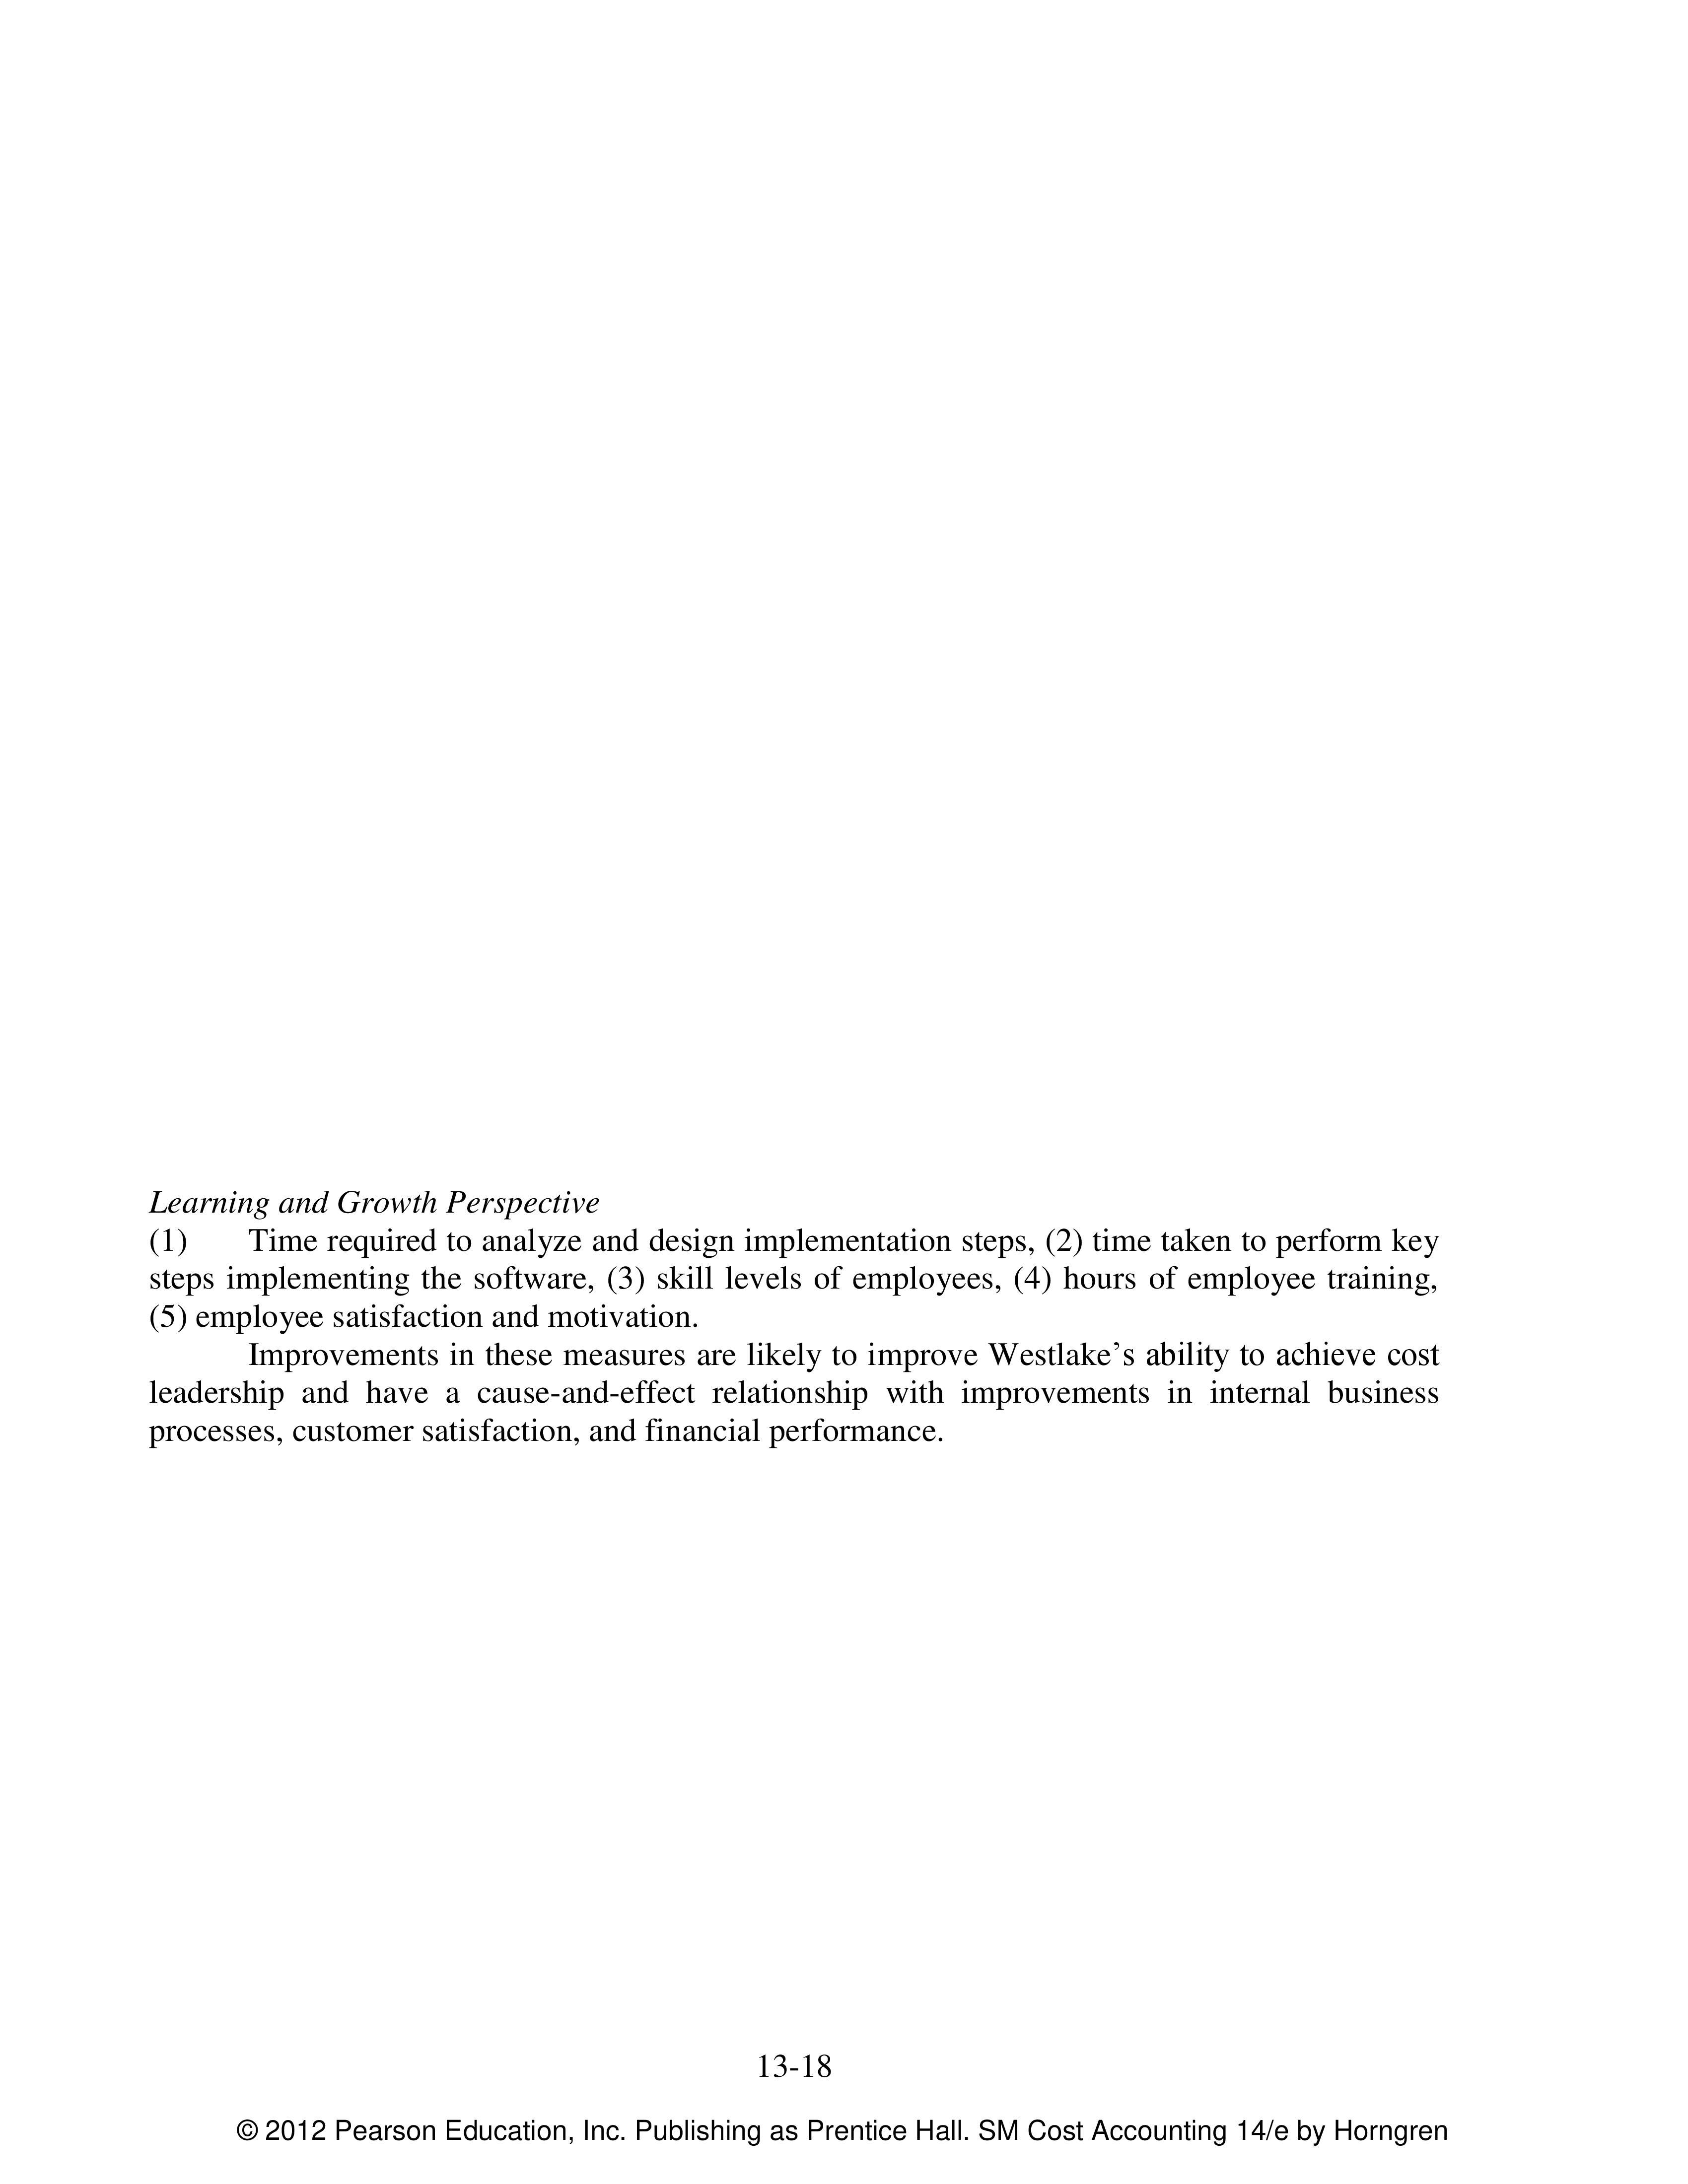
Learning and Growth Perspective
(1) Percentage of employees trained in process and quality management, (2) employee
satisfaction ratings.
Improvements in these measures aim to improve Ridgecrest’s ability to achieve cost
leadership and have a cause–and–effect relationship with improvements in internal business
processes, which in turn lead to customer satisfaction and financial performance.
13–17 (20 min.) Analysis of growth, price–recovery, and productivity components
(continuation of 13–16).
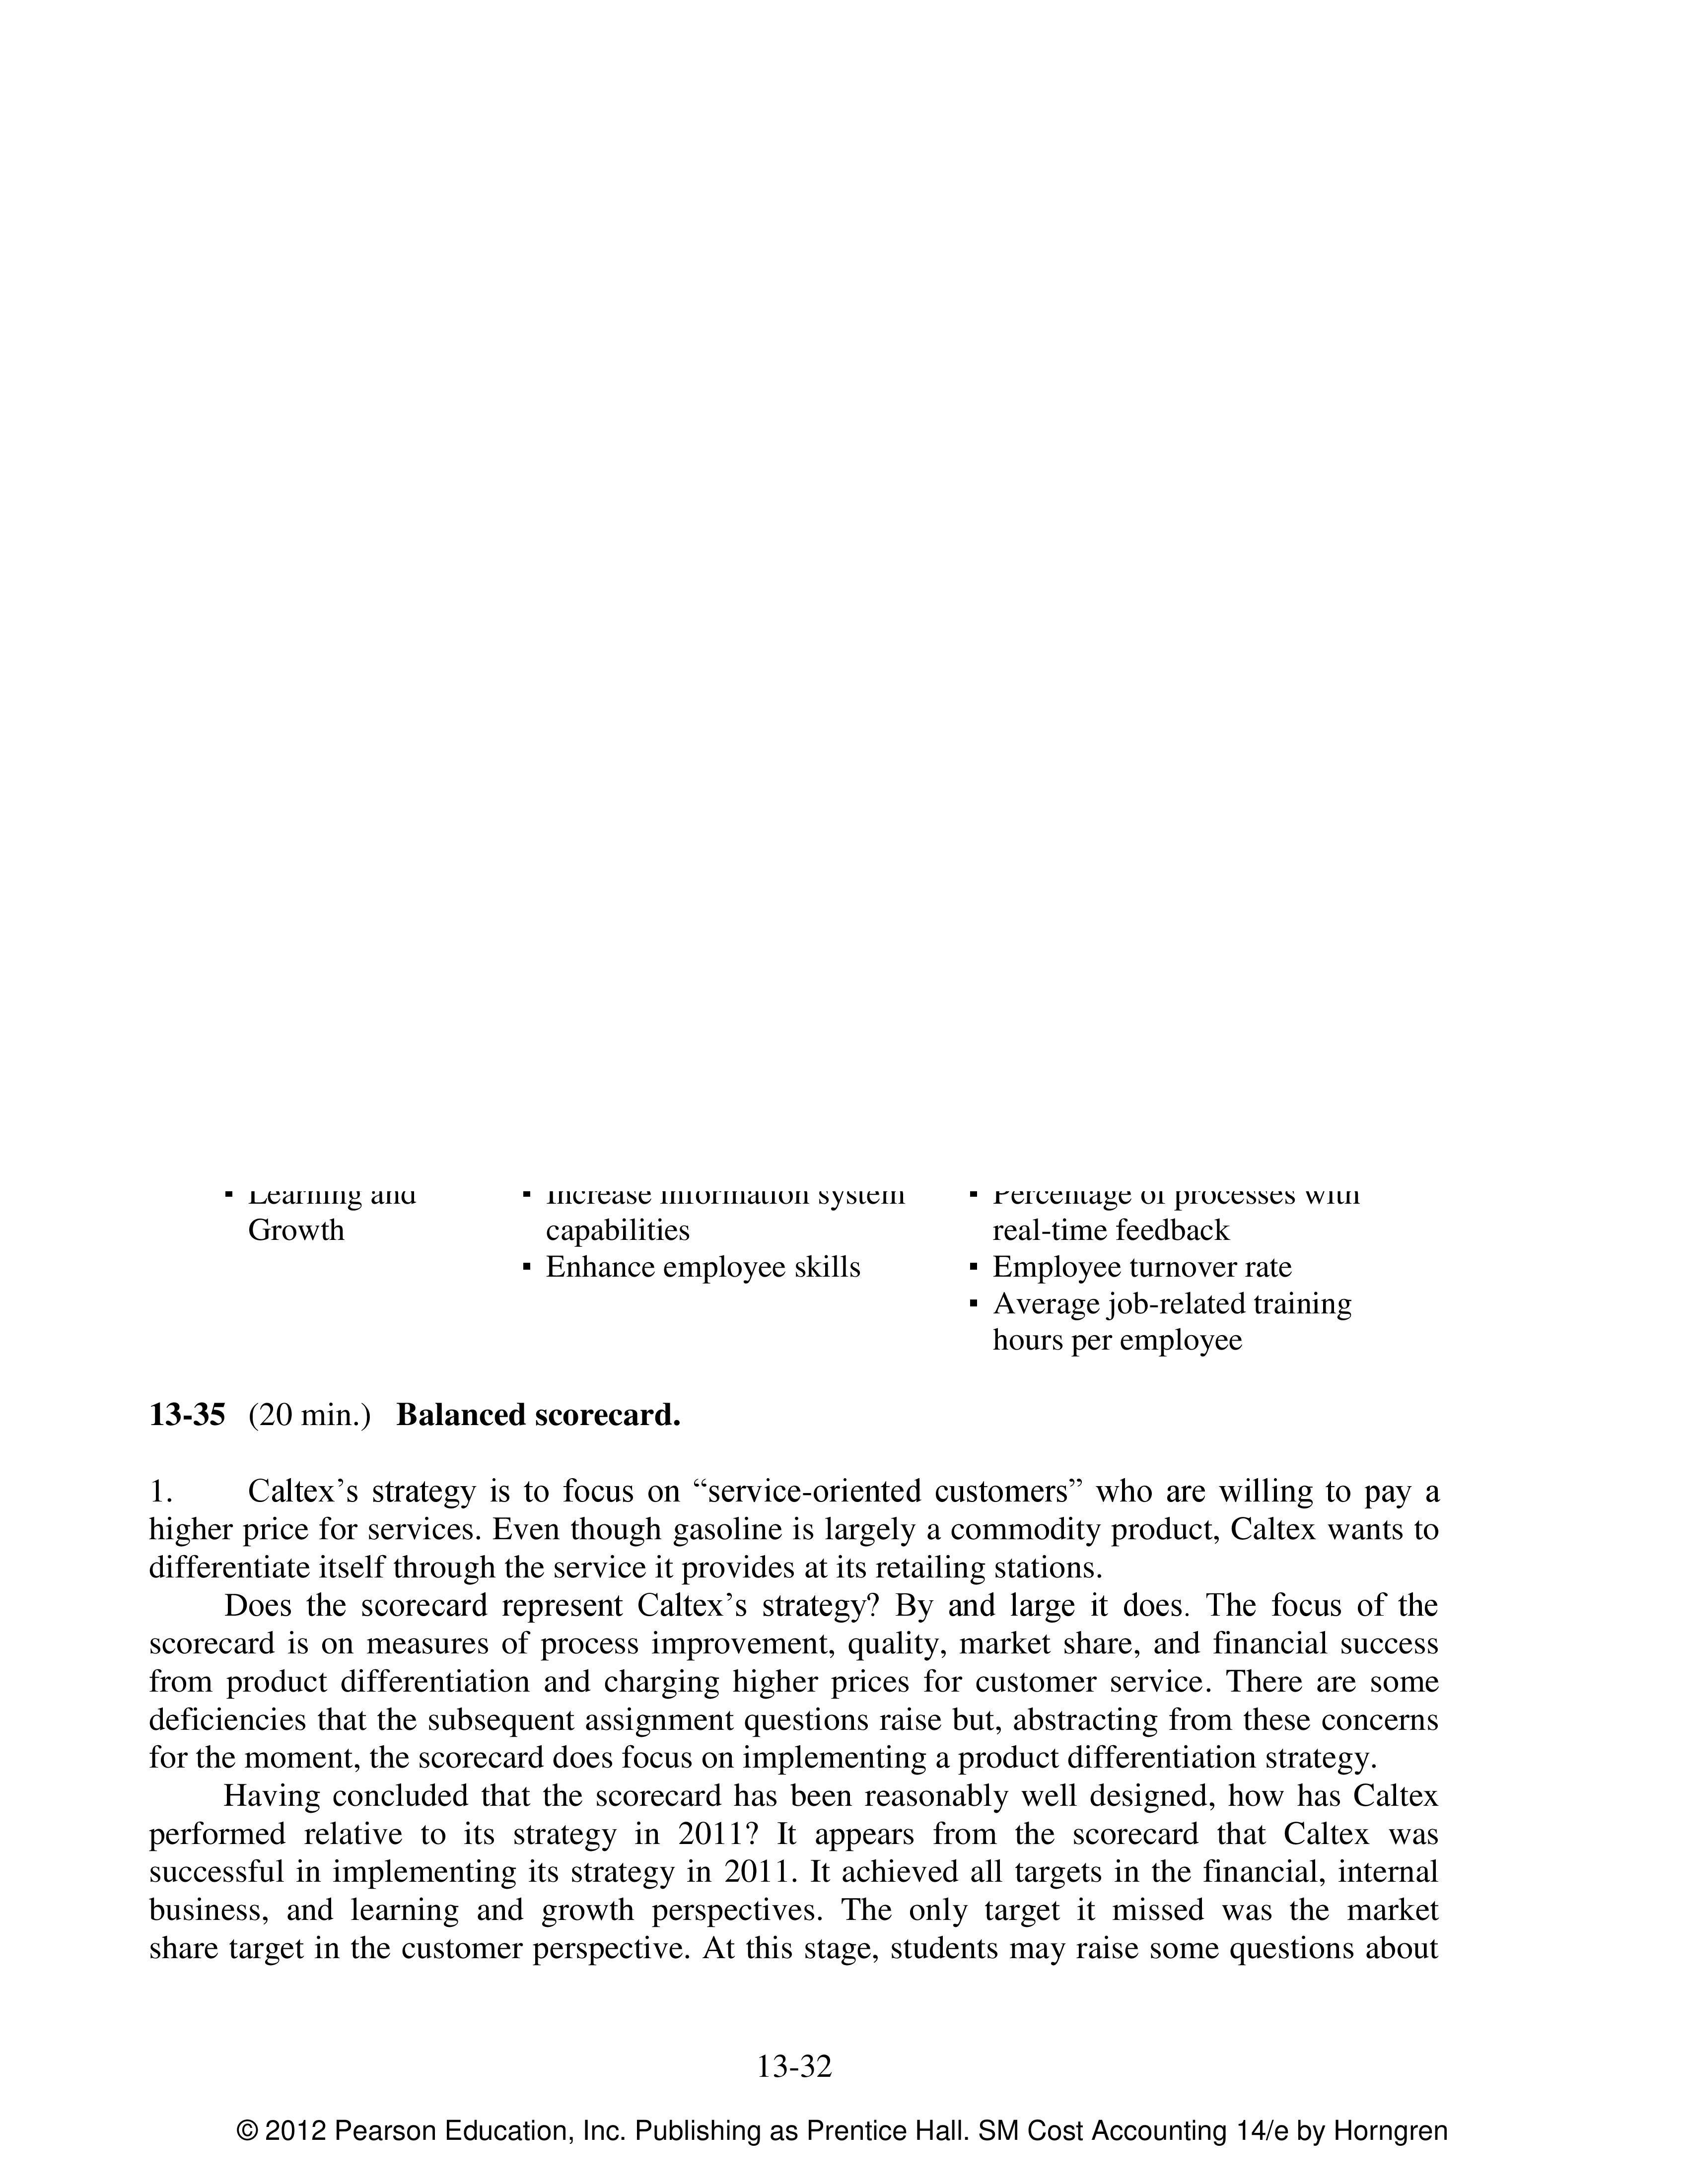
1. Ridgecrest’s operating income gain is consistent with the cost leadership strategy
identified in requirement 1 of Exercise 13–16. The increase in operating income in 2012 was
driven by the $150,000 gain in productivity in 2012. Ridgecrest took advantage of its
productivity gain to reduce the prices of its boxes and to fuel growth. It increased market share
by growing even though the total market size was unchanged.
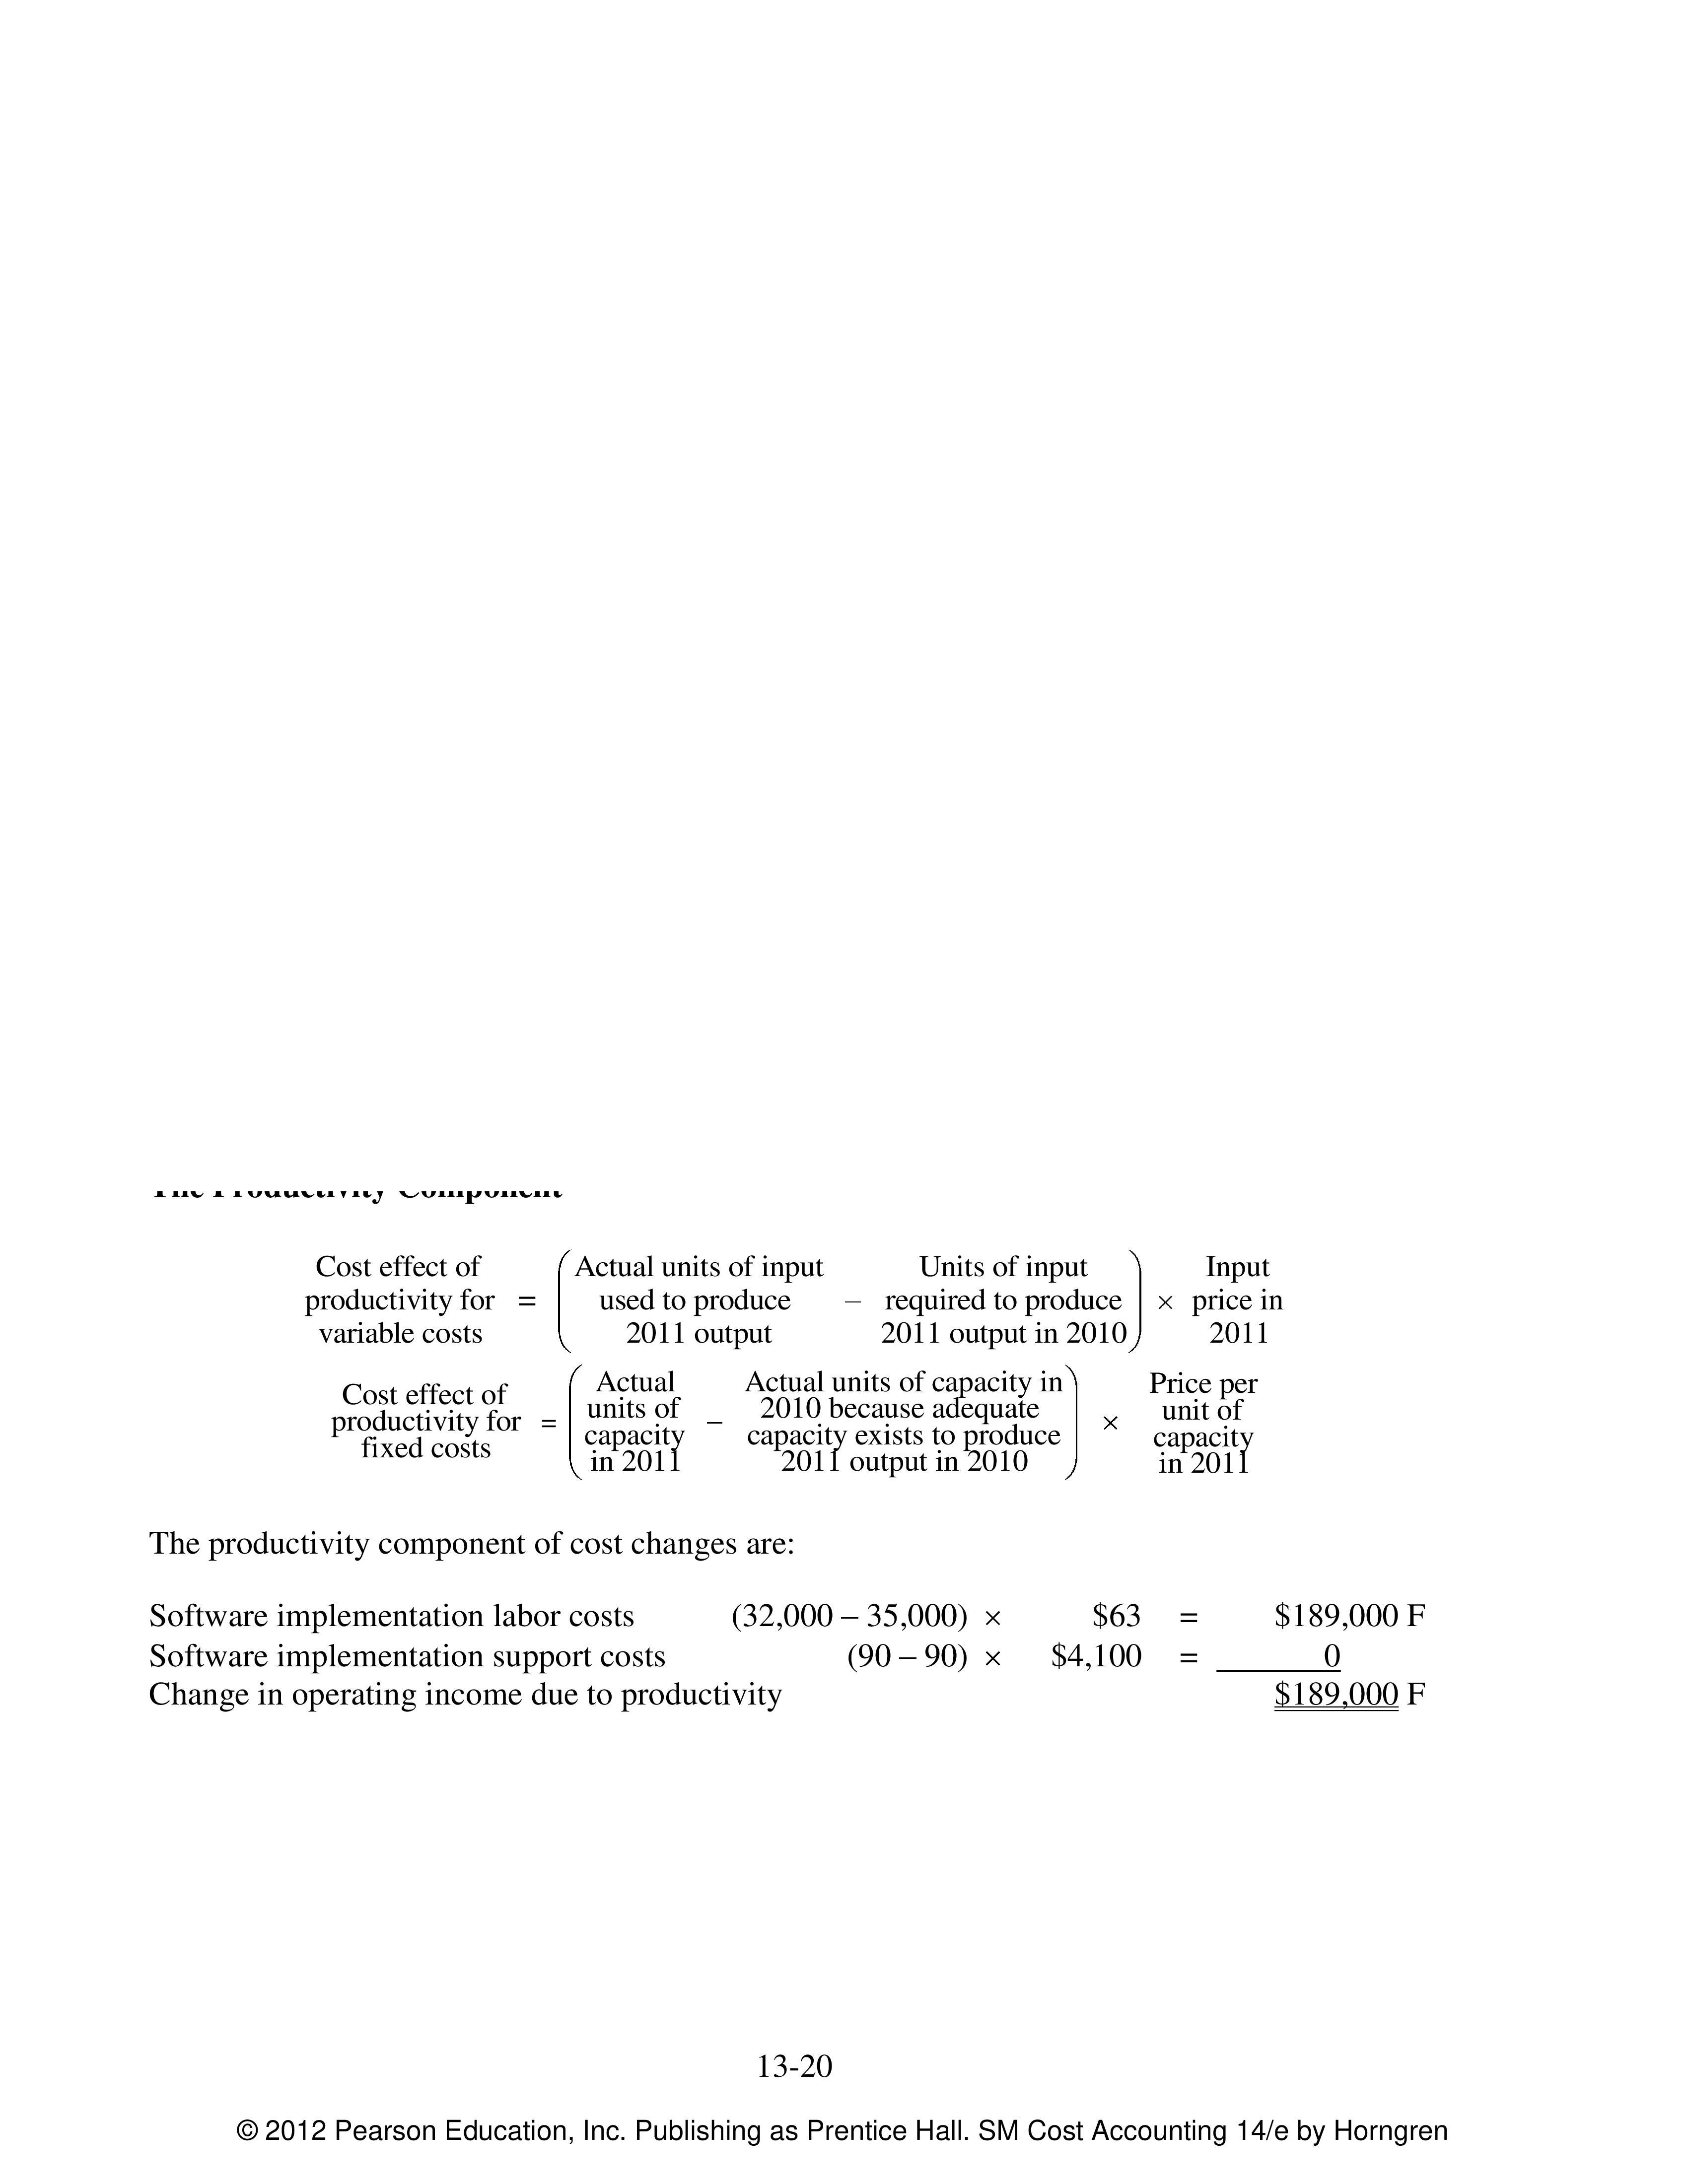
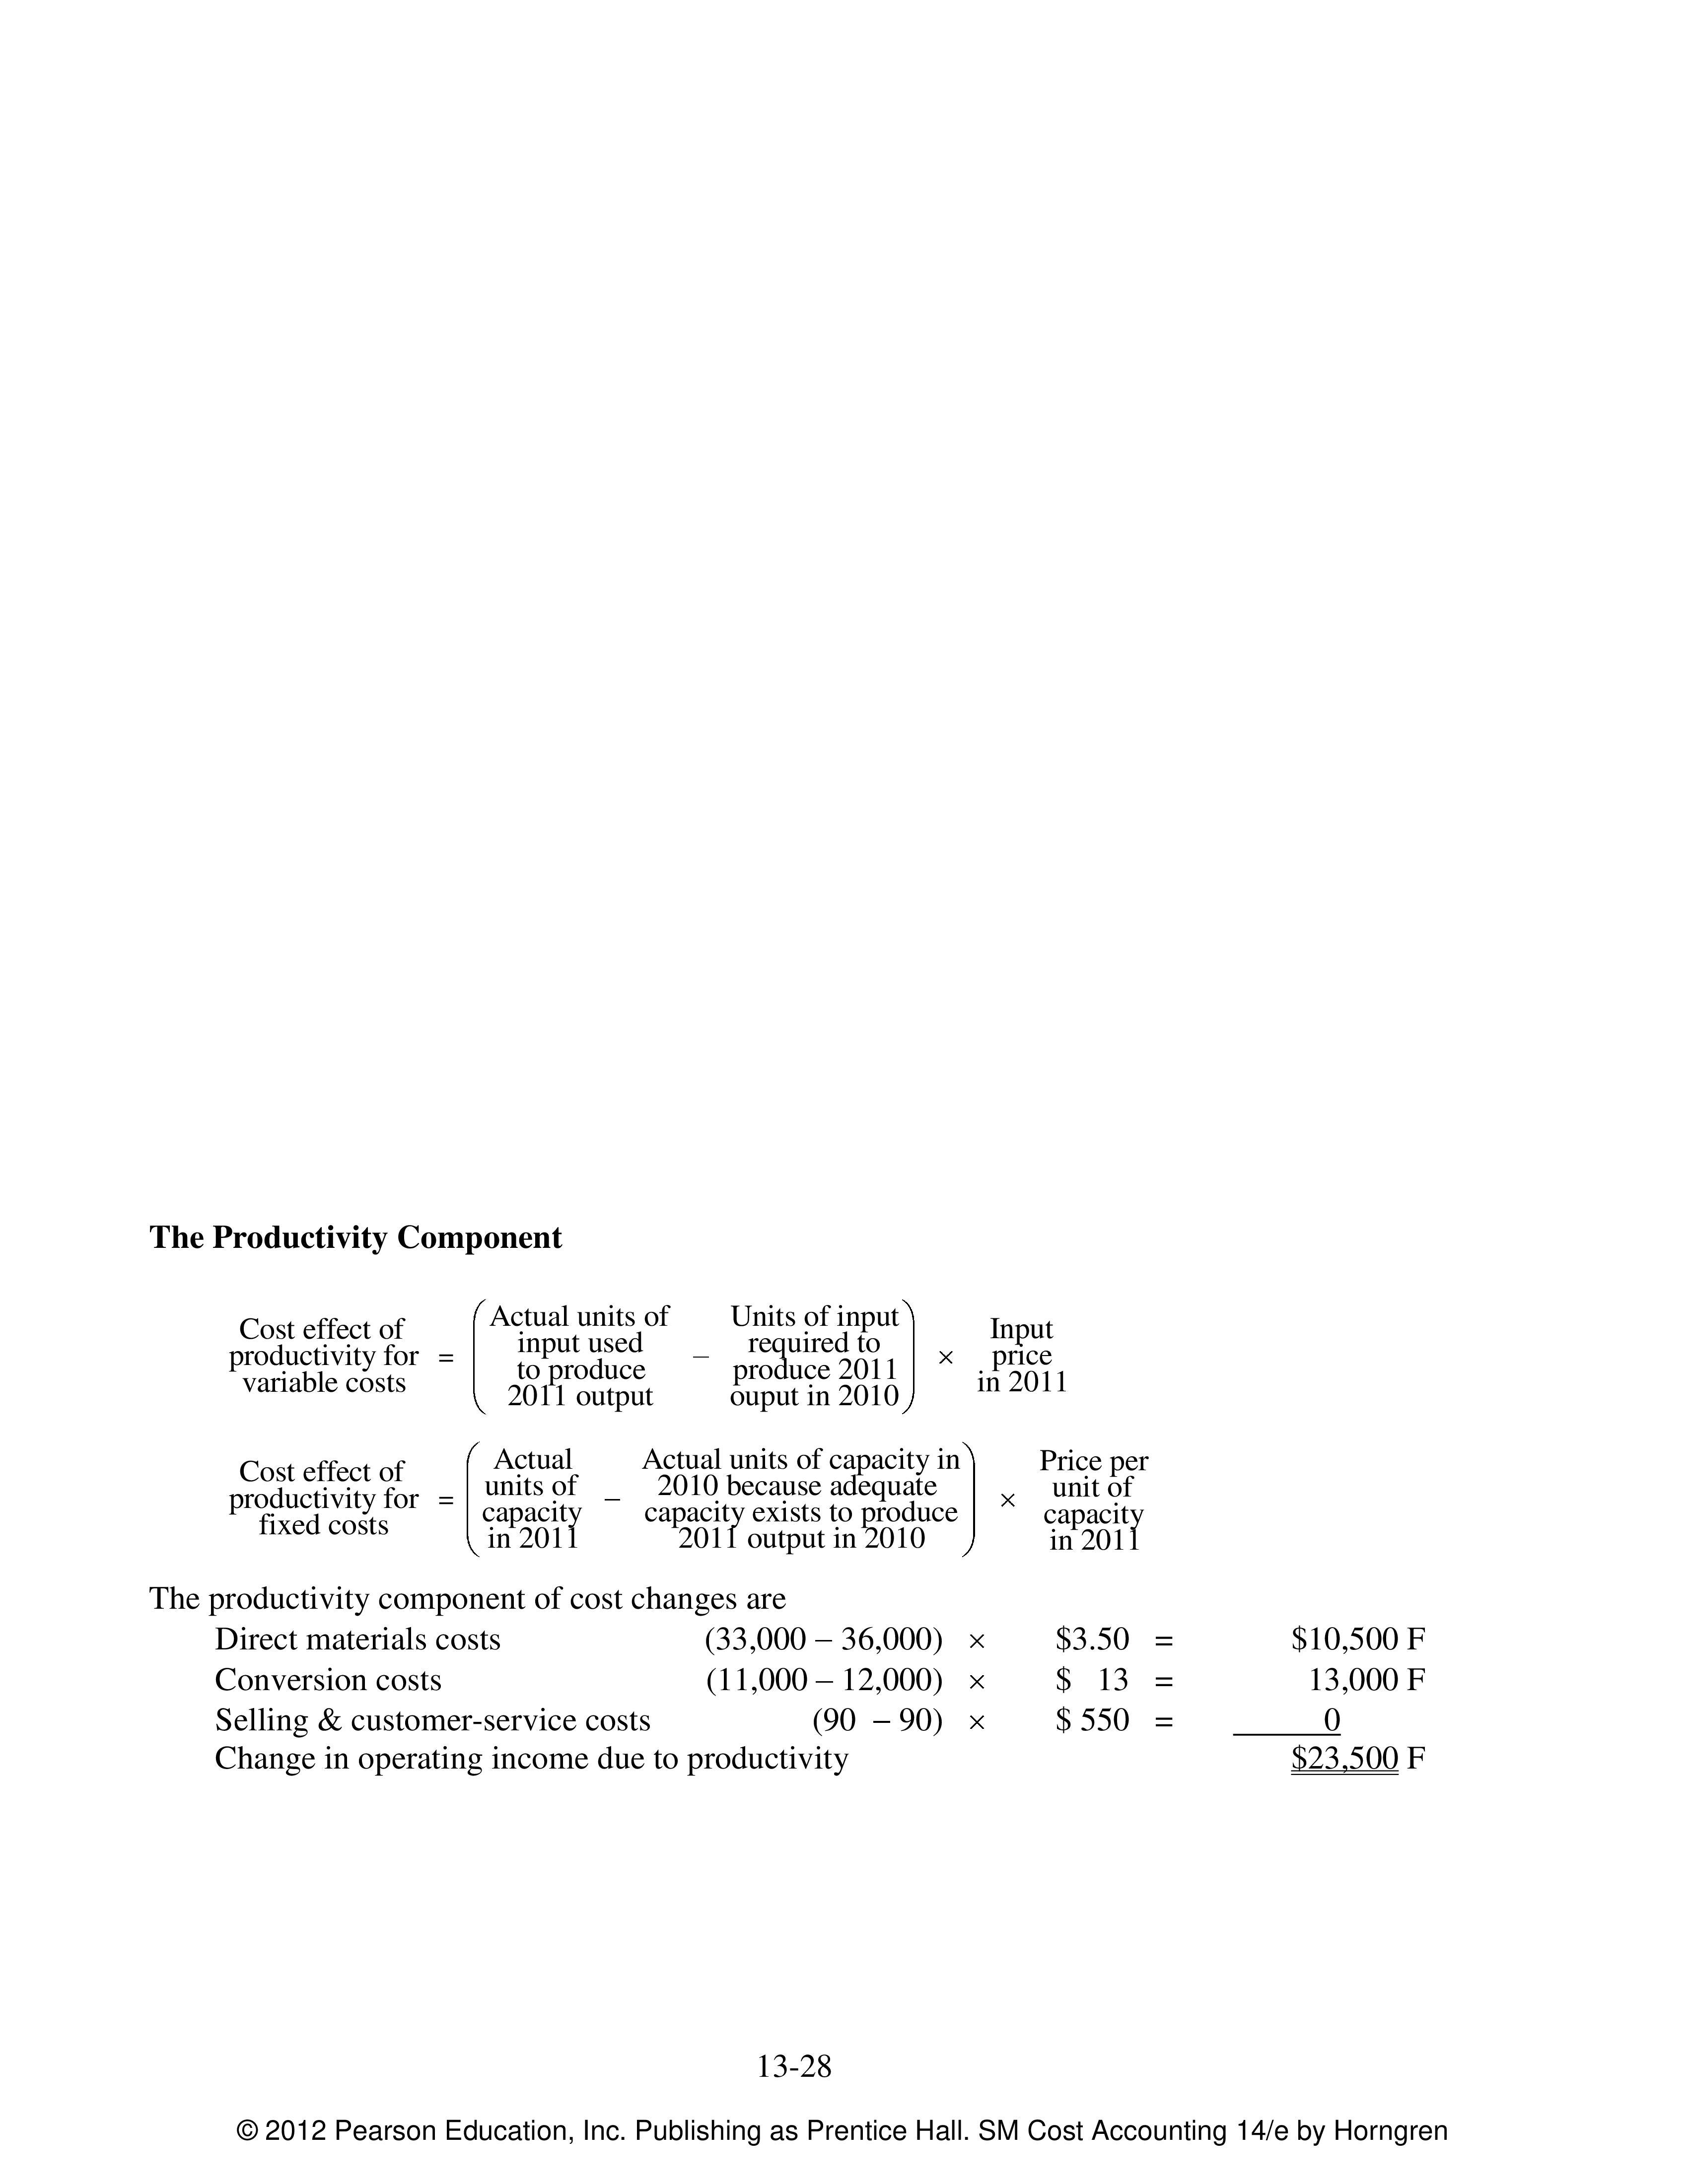
2. The productivity component measures the change in costs attributable to a change in the
quantity and mix of inputs used in a year relative to the quantity and mix of inputs that would
have been used in a previous year to produce the current year output. It measures the amount by
which operating income increases and costs decrease through the productive use of input
quantities. When comparing productivities across years, the productivity calculations use current
year input prices in all calculations. Hence, the productivity component is unaffected by input
price changes.
The productivity component represents savings in both variable costs and fixed costs.
With respect to variable costs, such as direct materials, productivity improvements immediately
translate into cost savings. In the case of fixed costs, such as fixed manufacturing conversion
costs, productivity gains result only if management takes actions to reduce unused capacity. For
example, reengineering manufacturing processes will decrease the capacity needed to produce a
given level of output, but it will lead to a productivity gain only if management reduces the
unused capacity by, say, selling off the excess capacity.
© 2012 Pearson Education, Inc. Publishing as Prentice Hall. SM Cost Accounting 14/e by Horngren

13–6
13–18 (20 min.) Strategy, balanced scorecard, merchandising operation.
(Please alert students that in some printed versions of the book there is a typographical
error in line 8 of the table. It should read “Administrative cost per customer (Row 7 Row
6)” and not “(Row 8 Row 7).”
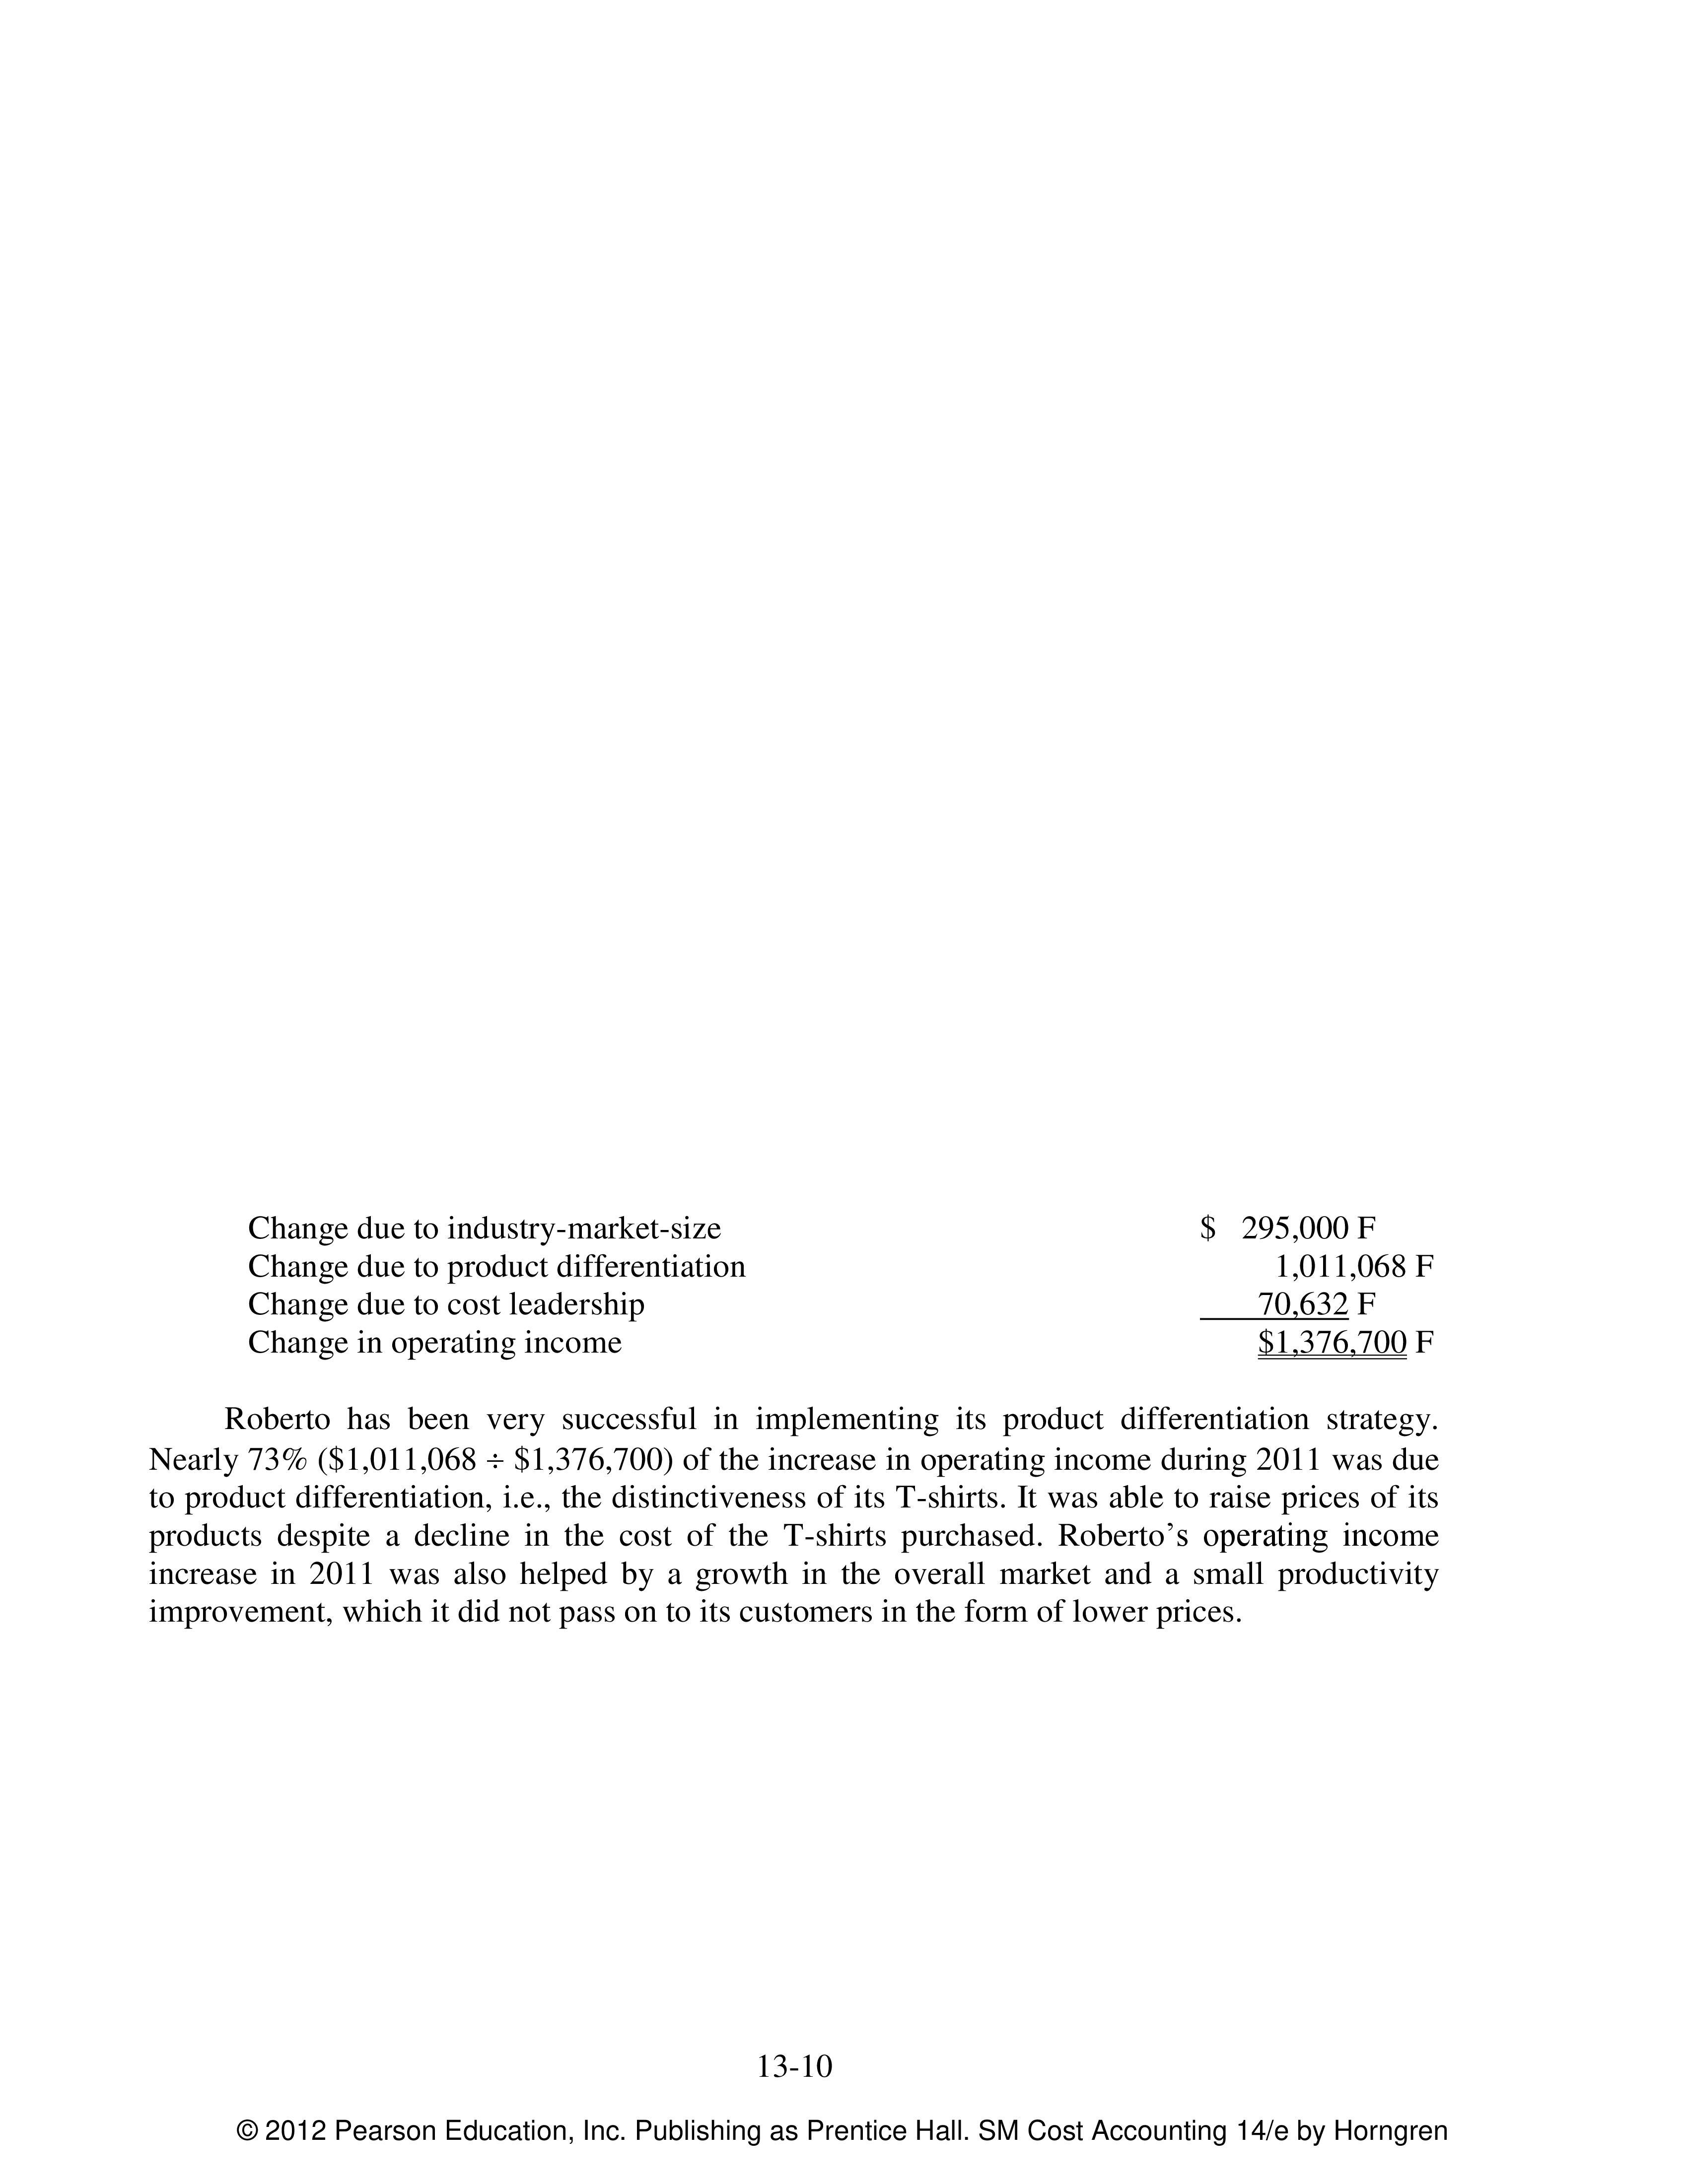
1. Roberto & Sons follows a product differentiation strategy. Roberto’s designs are
―trendsetting,‖ its T–shirts are distinctive, and it aims to make its T–shirts a ―must have‖ for each
and every teenager. These are all clear signs of a product differentiation strategy, and, to
succeed, Roberto must continue to innovate and be able to charge a premium price for its
product.
2. Possible key elements of Roberto’s balance scorecard, given its product differentiation
strategy:
Financial Perspective
(1) Increase in operating income from charging higher margins, (2) price premium earned on
products.
These measures will indicate whether Roberto has been able to charge premium prices and
achieve operating income increases through product differentiation.
Customer Perspective
(1) Market share in distinctive, name–brand T–shirts, (2) customer satisfaction, (3) new
customers, (4) number of mentions of Roberto’s T–shirts in the leading fashion magazines
Roberto’s strategy should result in improvements in these customer measures that help
evaluate whether Roberto’s product differentiation strategy is succeeding with its customers.
These measures are, in turn, leading indicators of superior financial performance.
Internal Business Process Perspective
(1) Quality of silk–screening (number of colors, use of glitter, durability of the design), (2)
frequency of new designs, (3) time between concept and delivery of design
Improvements in these measures are expected to result in more distinctive and trendsetting
designs delivered to its customers and in turn, superior financial performance.
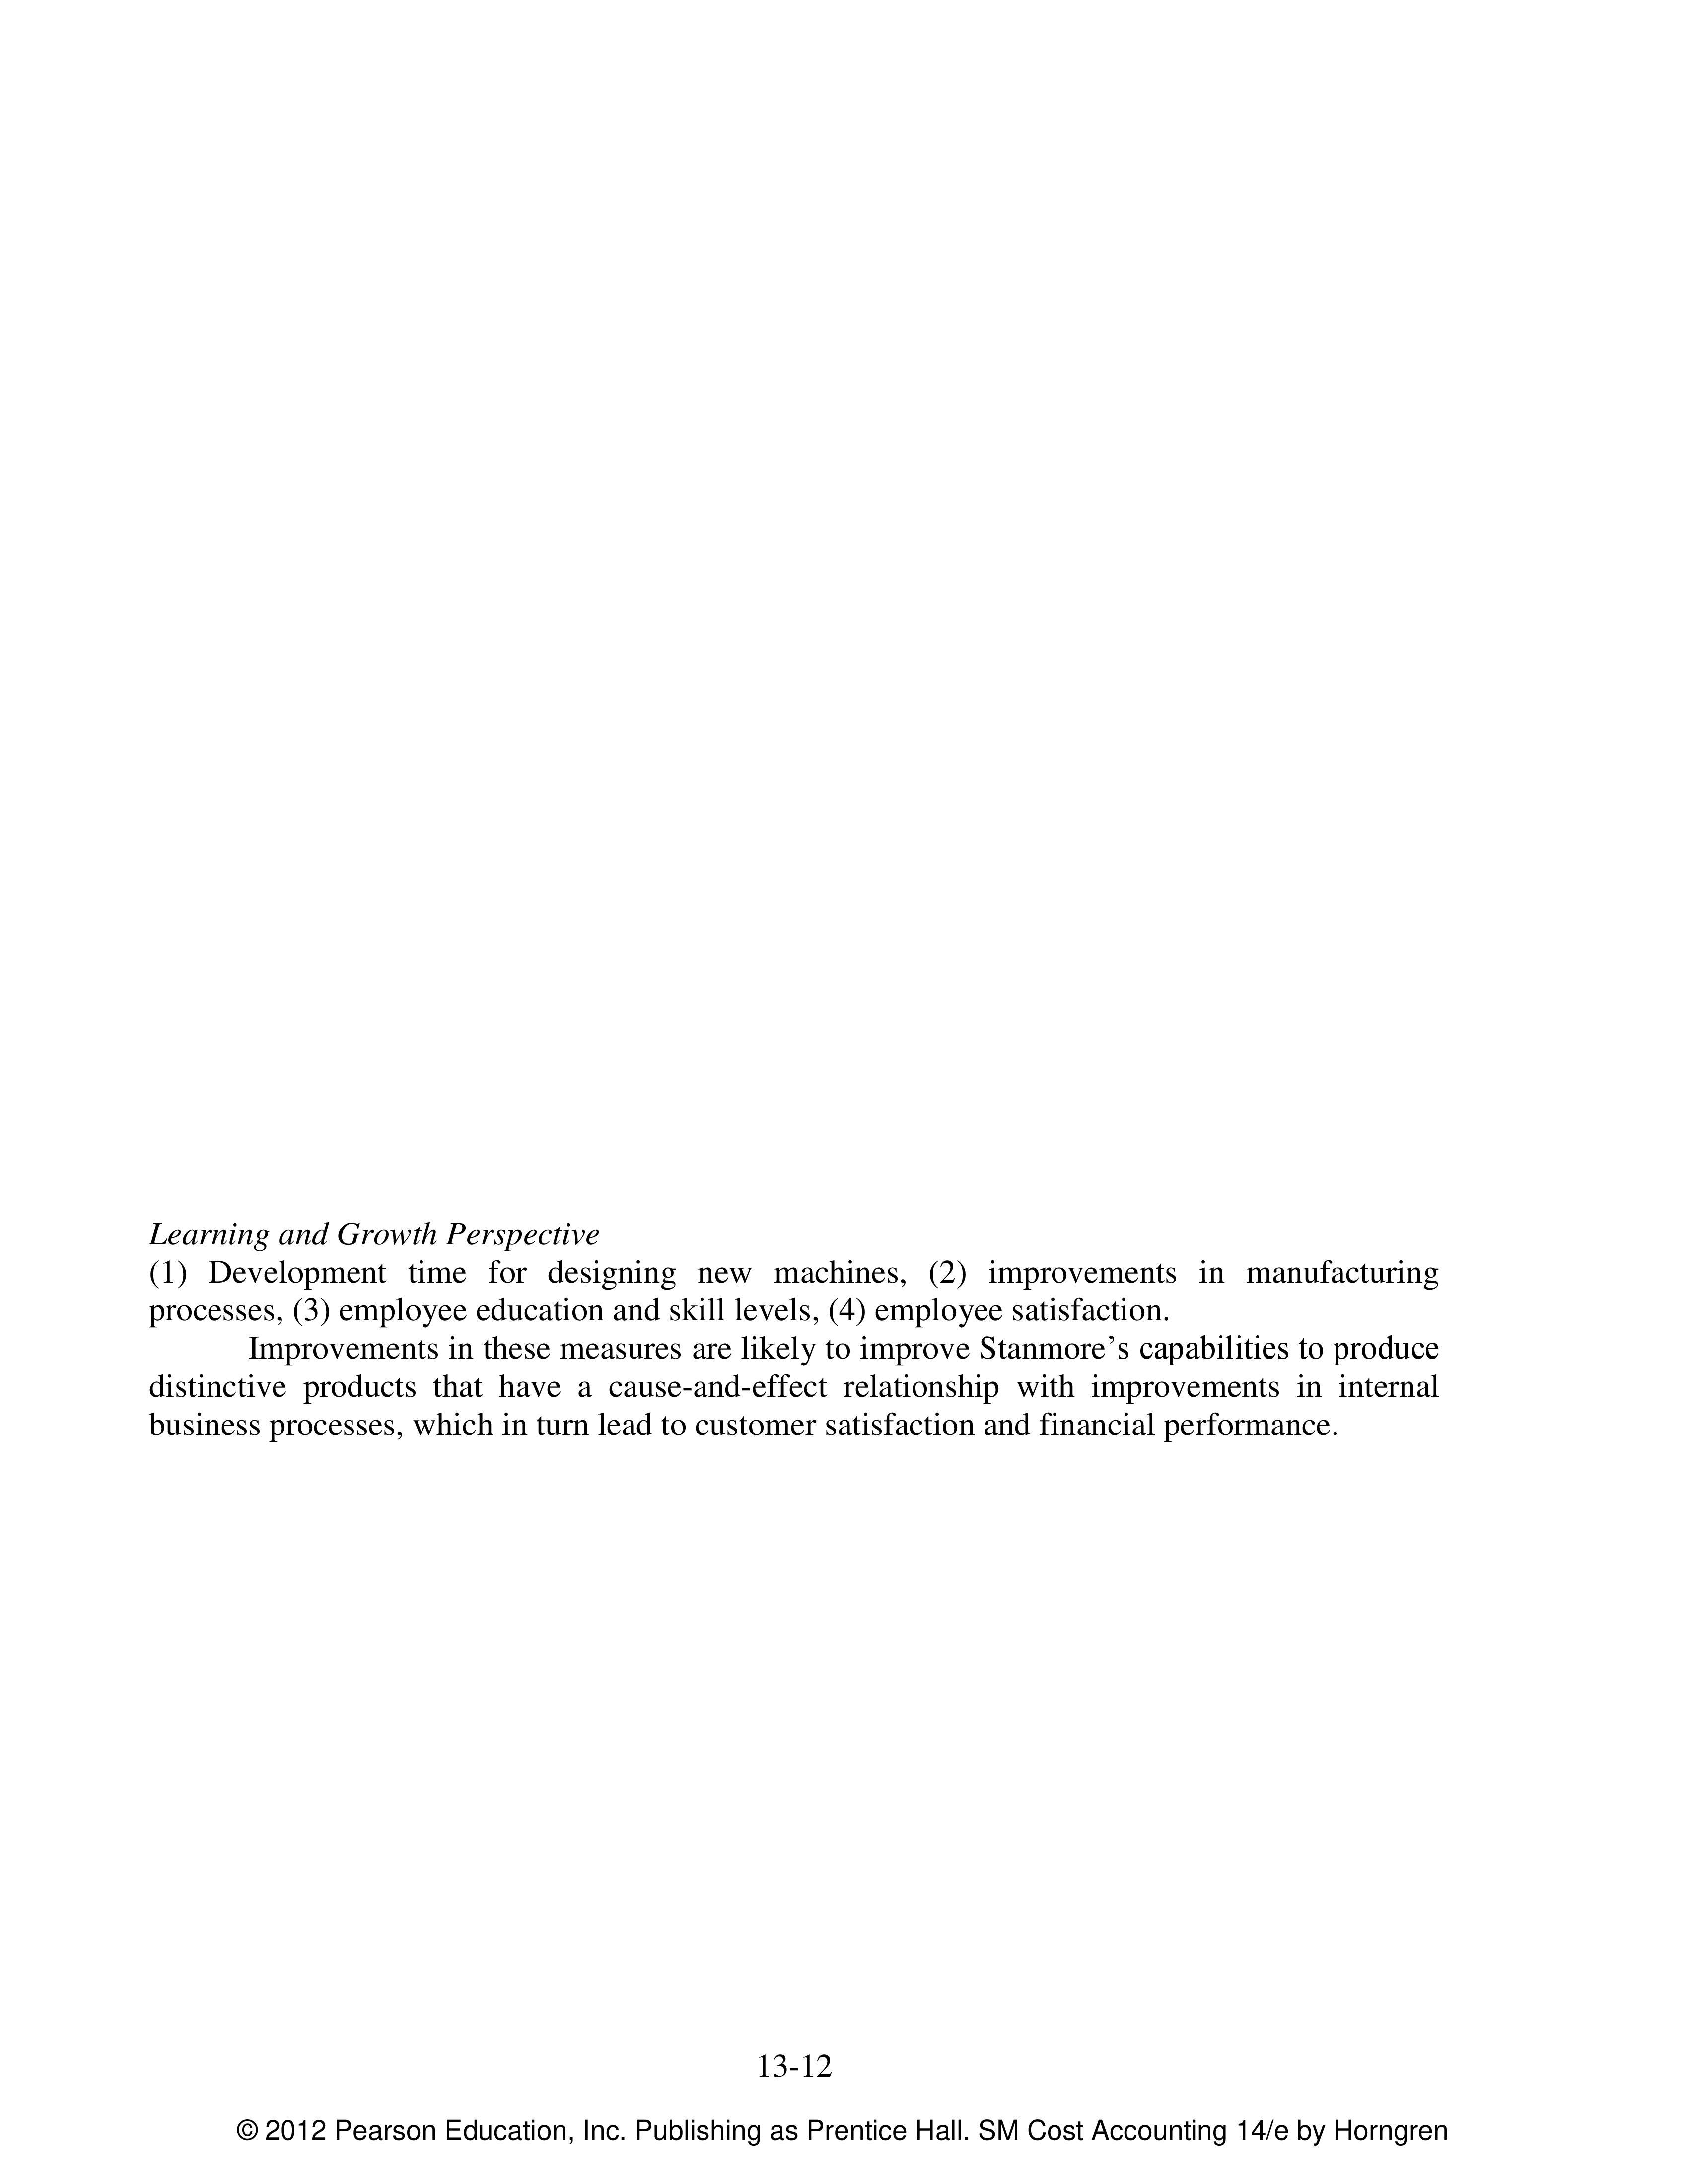
Learning and Growth Perspective
(1) Ability to attract and retain talented designers (2) improvements in silk–screening processes,
(3) continuous education and skill levels of marketing and sales staff, (4) employee satisfaction.
Improvements in these measures are expected to improve Roberto’s capabilities to
produce distinctive designs that have a cause–and–effect relationship with improvements in
internal business processes, which in turn lead to customer satisfaction and financial
performance.
© 2012 Pearson Education, Inc. Publishing as Prentice Hall. SM Cost Accounting 14/e by Horngren
13–19 (25–30 min.) Strategic analysis of operating income (continuation of 13–18).
1. Operating Income Statement
2010
2011
Revenues ($25 198,000; $26 246,700)
$4,950,000
$6,414,200
Costs
T-shirts purchased ($10 200,000; $8.50 250,000)
2,000,000
2,125,000
Administrative costs
1,200,000
1,162,500
Total costs
3,200,000
3,287,500
Operating income
$1,750,000
$3,126,700
Change in operating income
$1,376,700 F
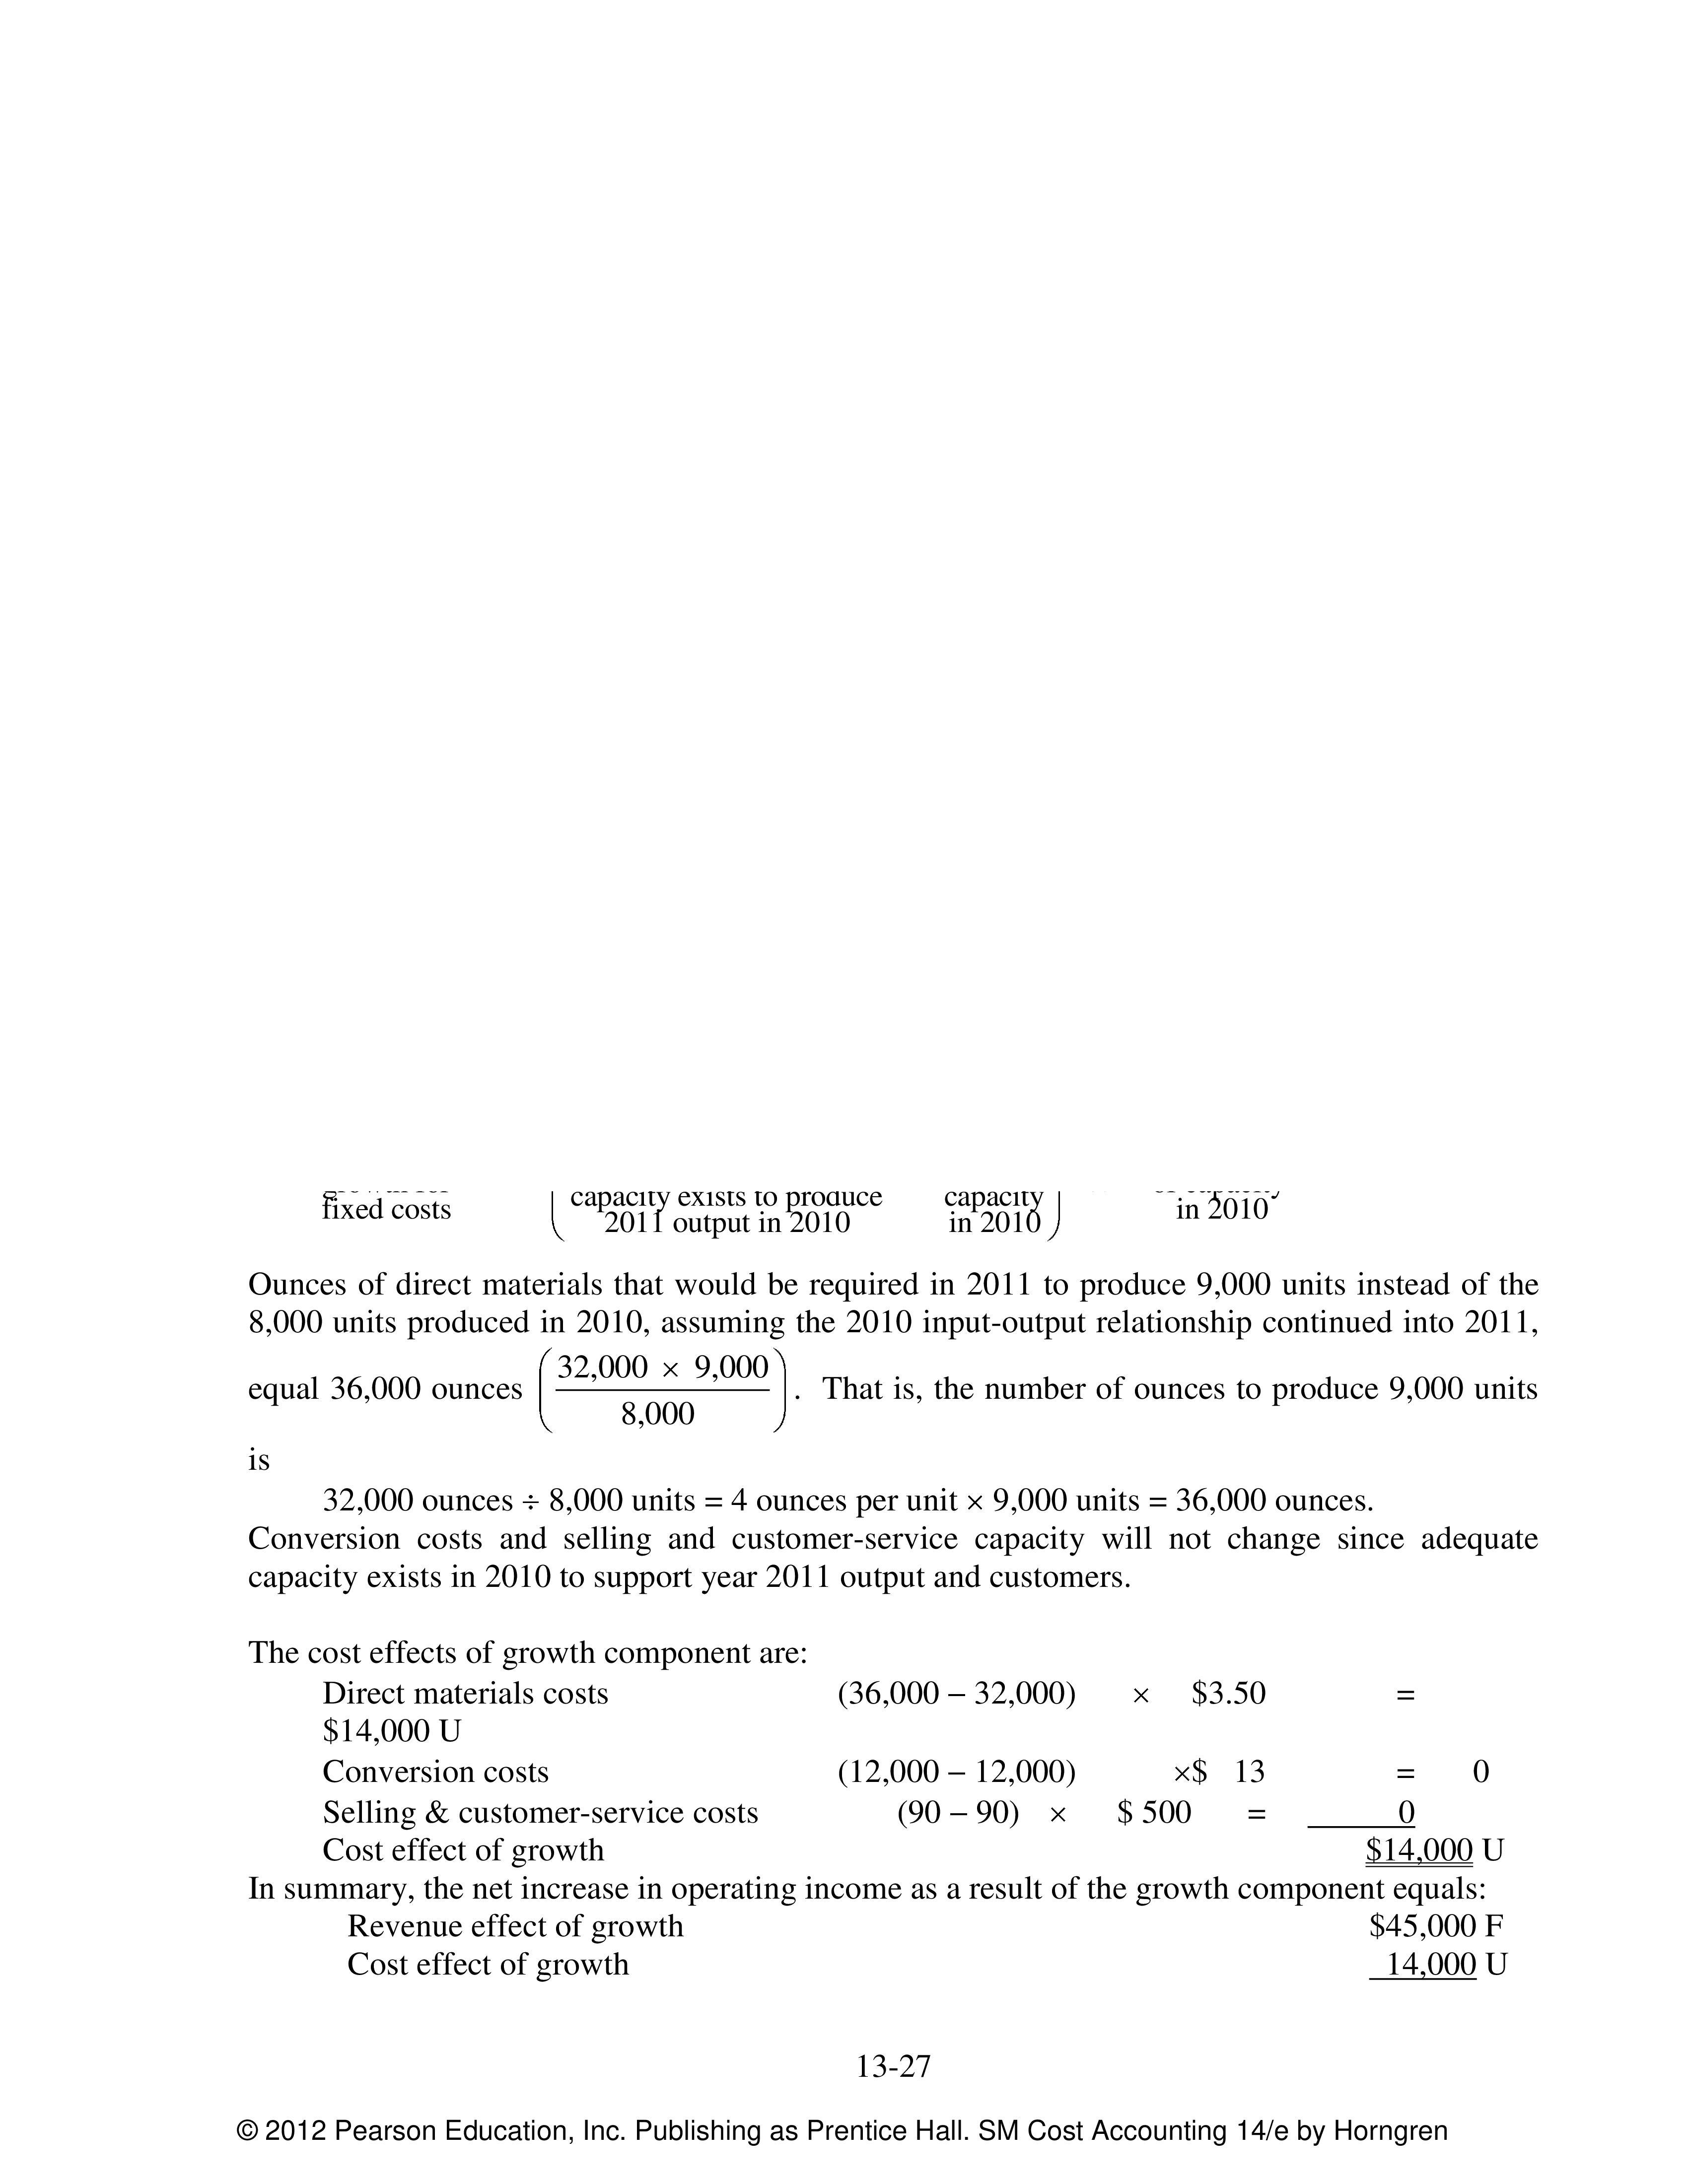
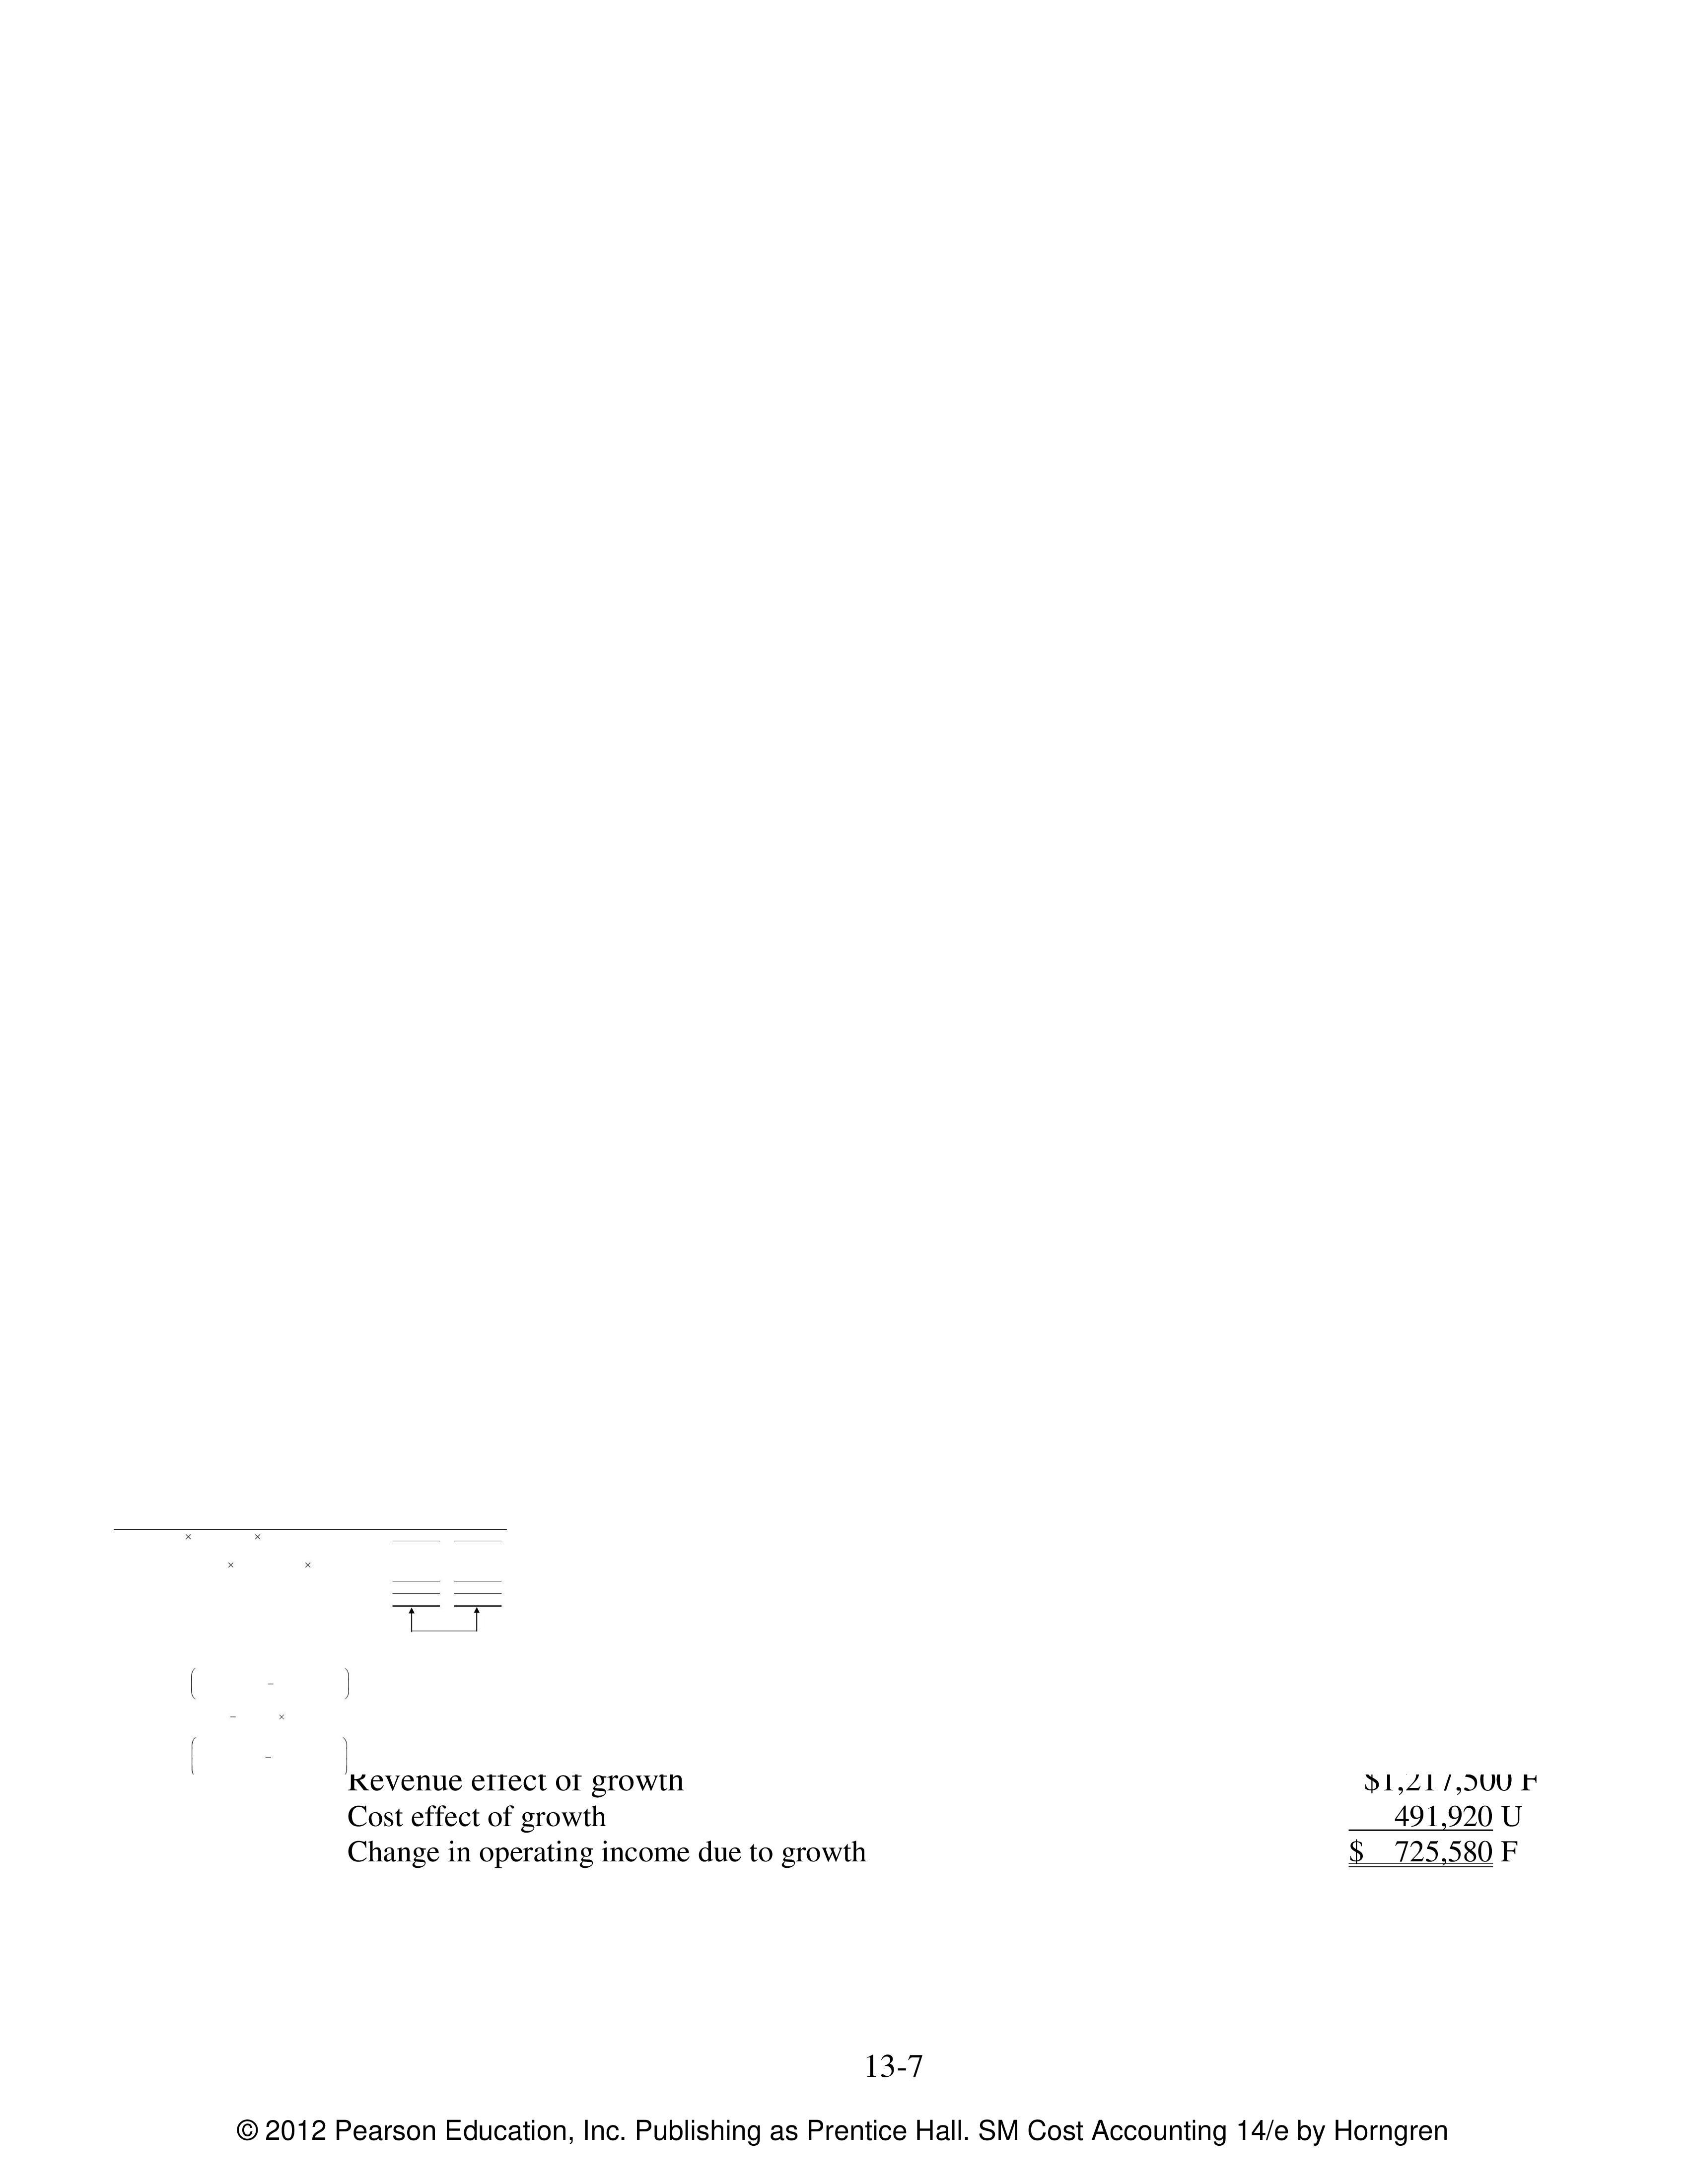
2. The Growth Component
Revenue effect
of growth
=
Actual units ofActual units of
output sold output sold
in 2011 in 2010
×
Selling
price
in 2010
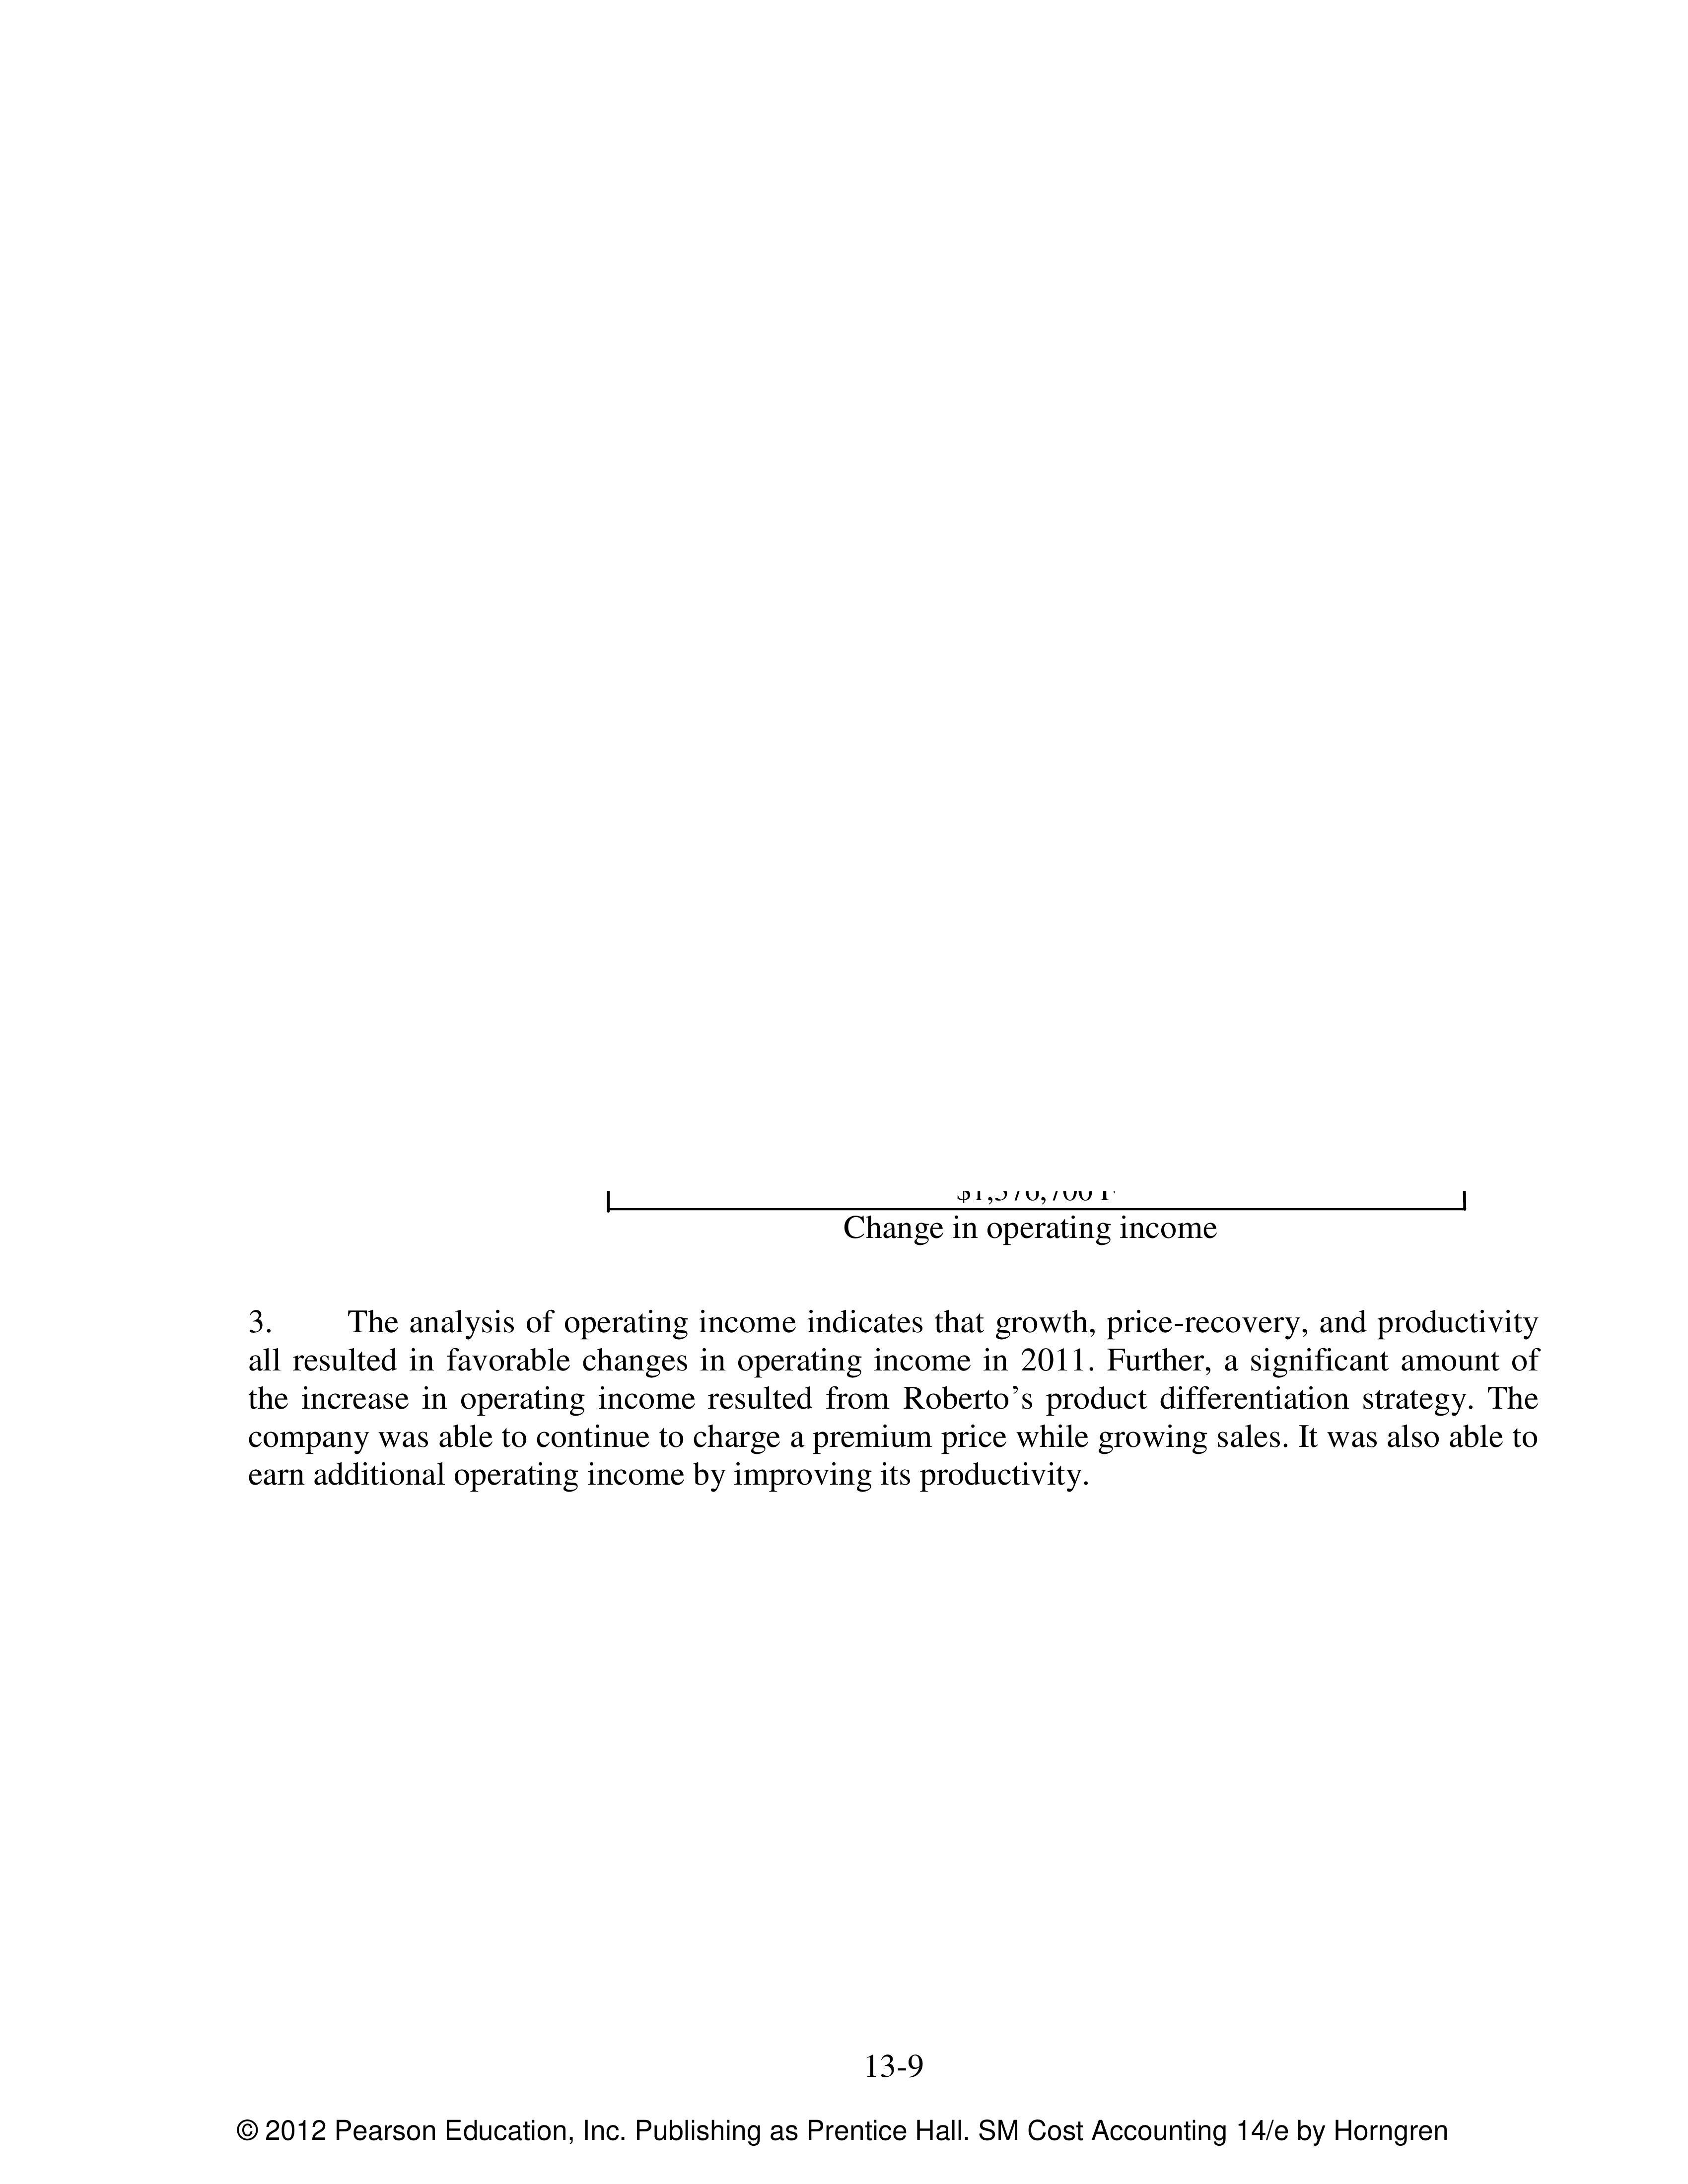
= (246,700 198,000) $25 = $1,217,500 F
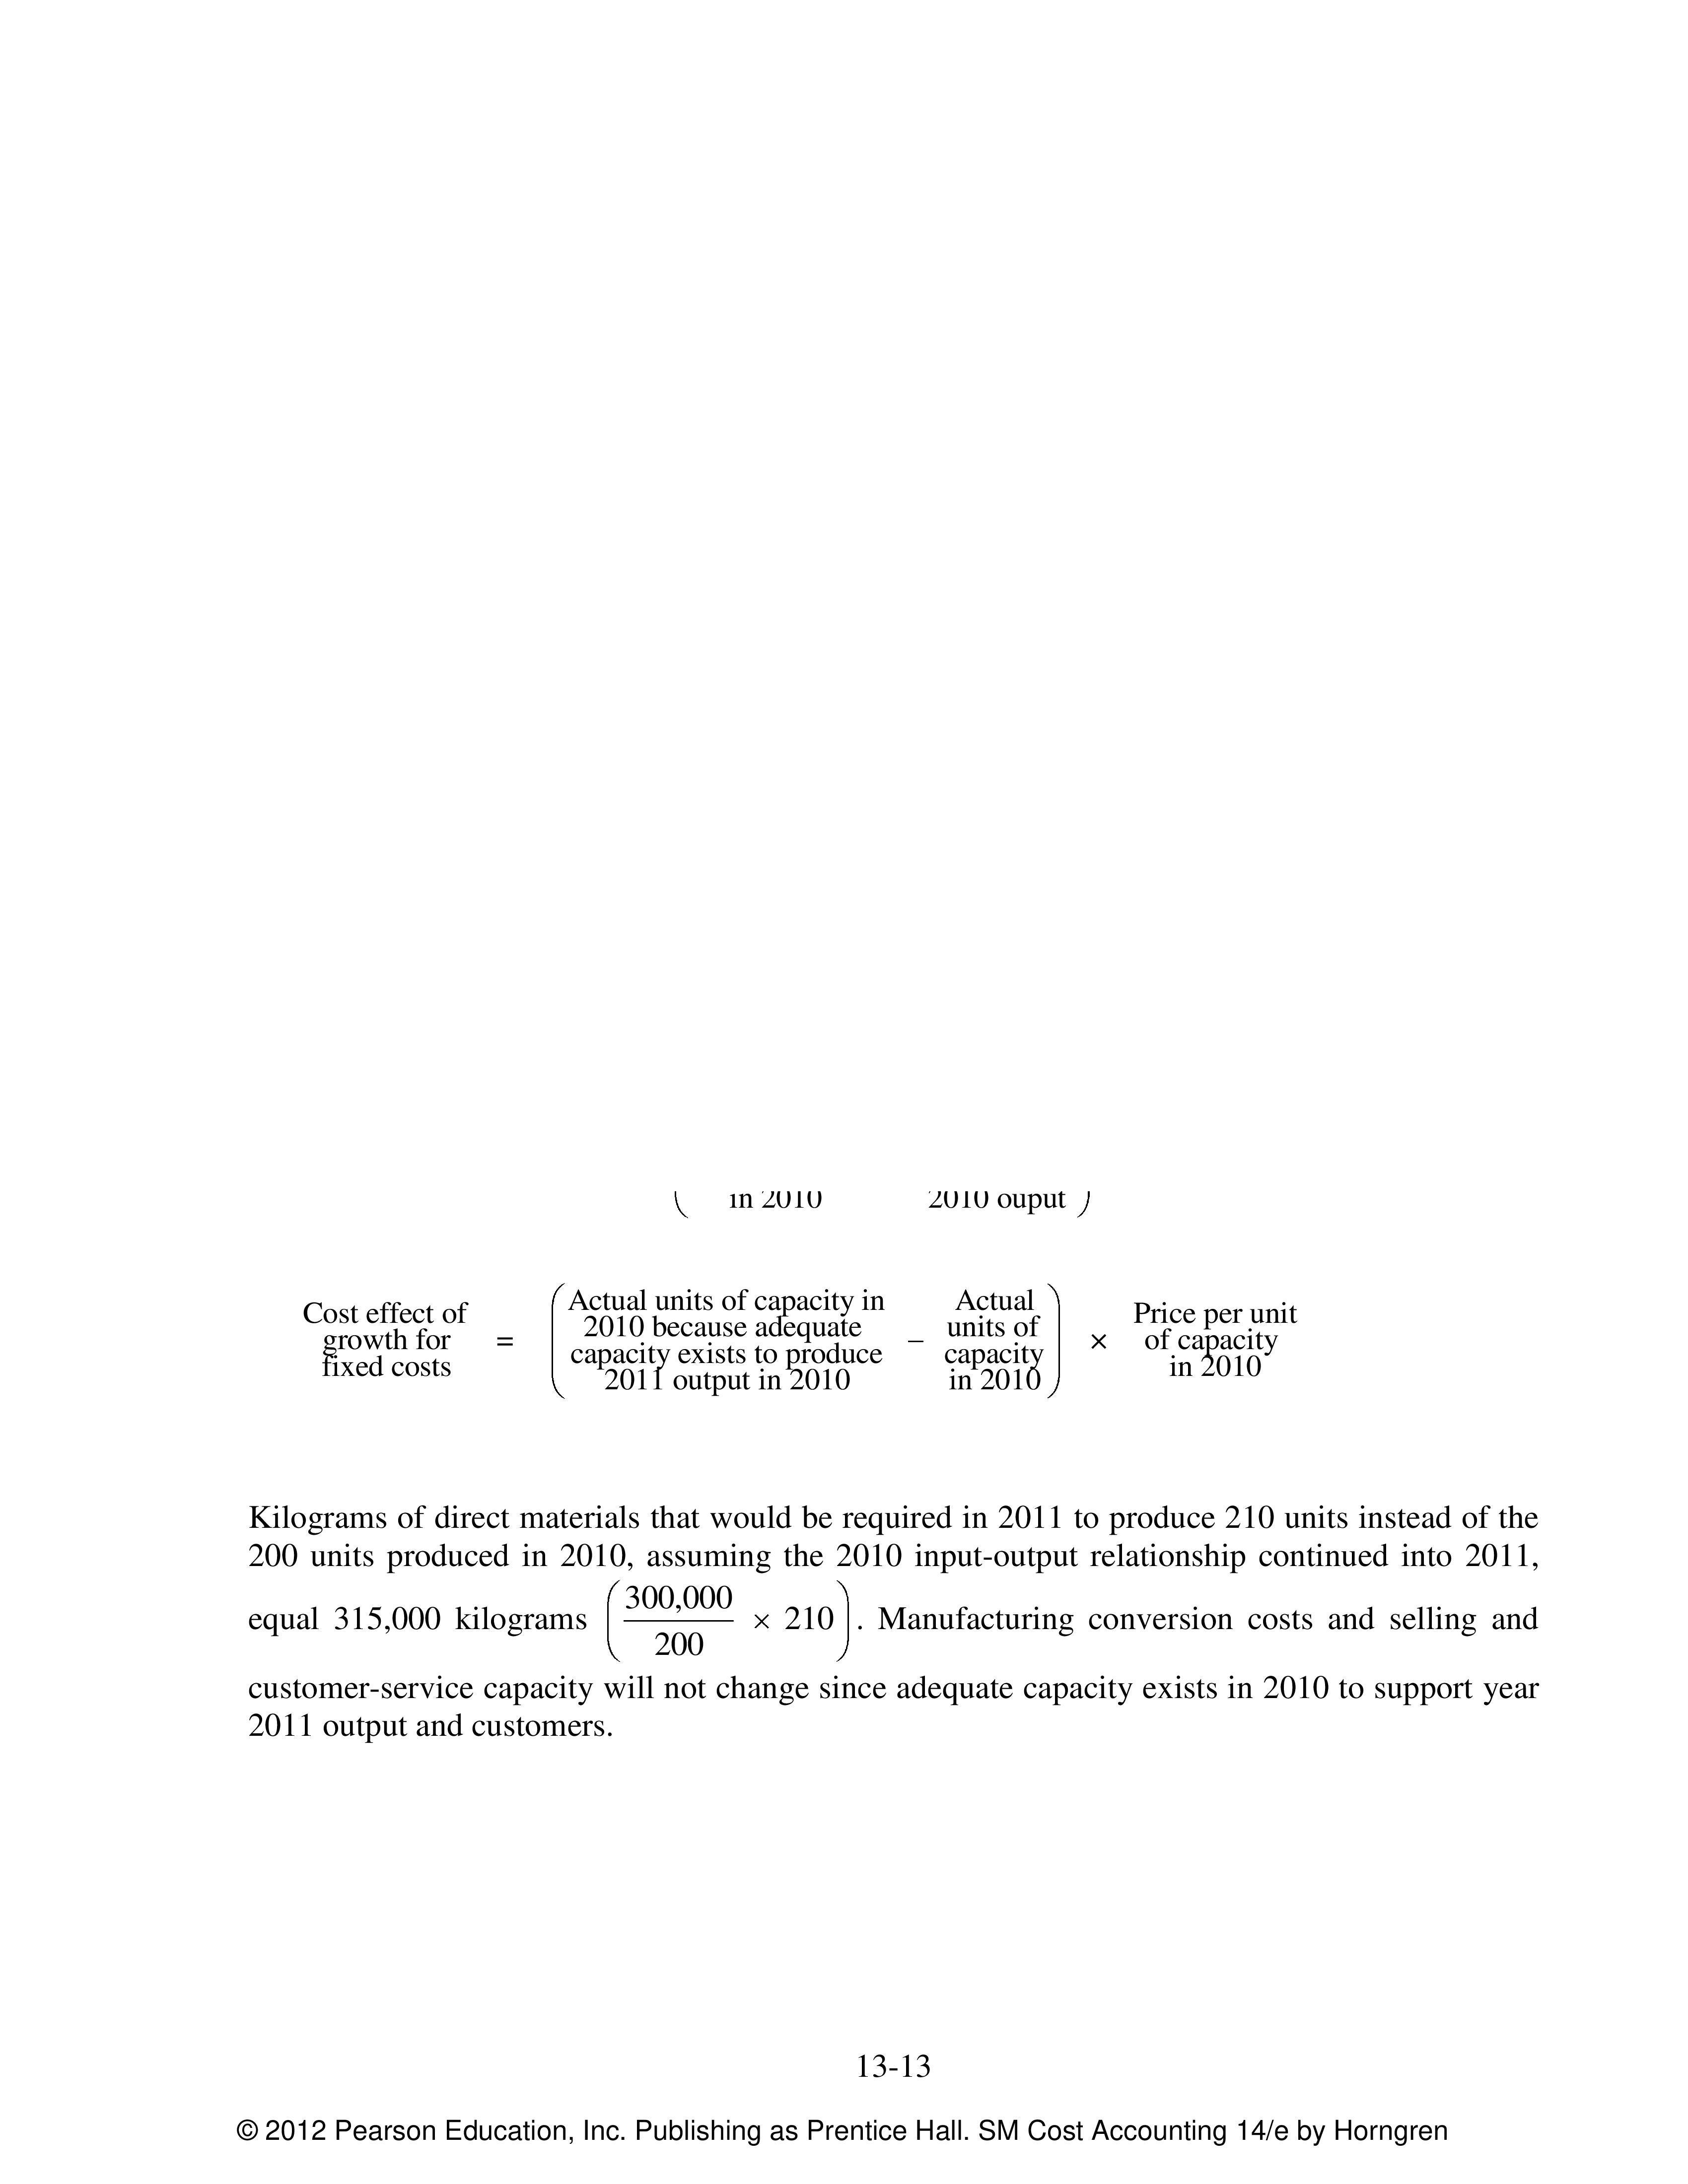
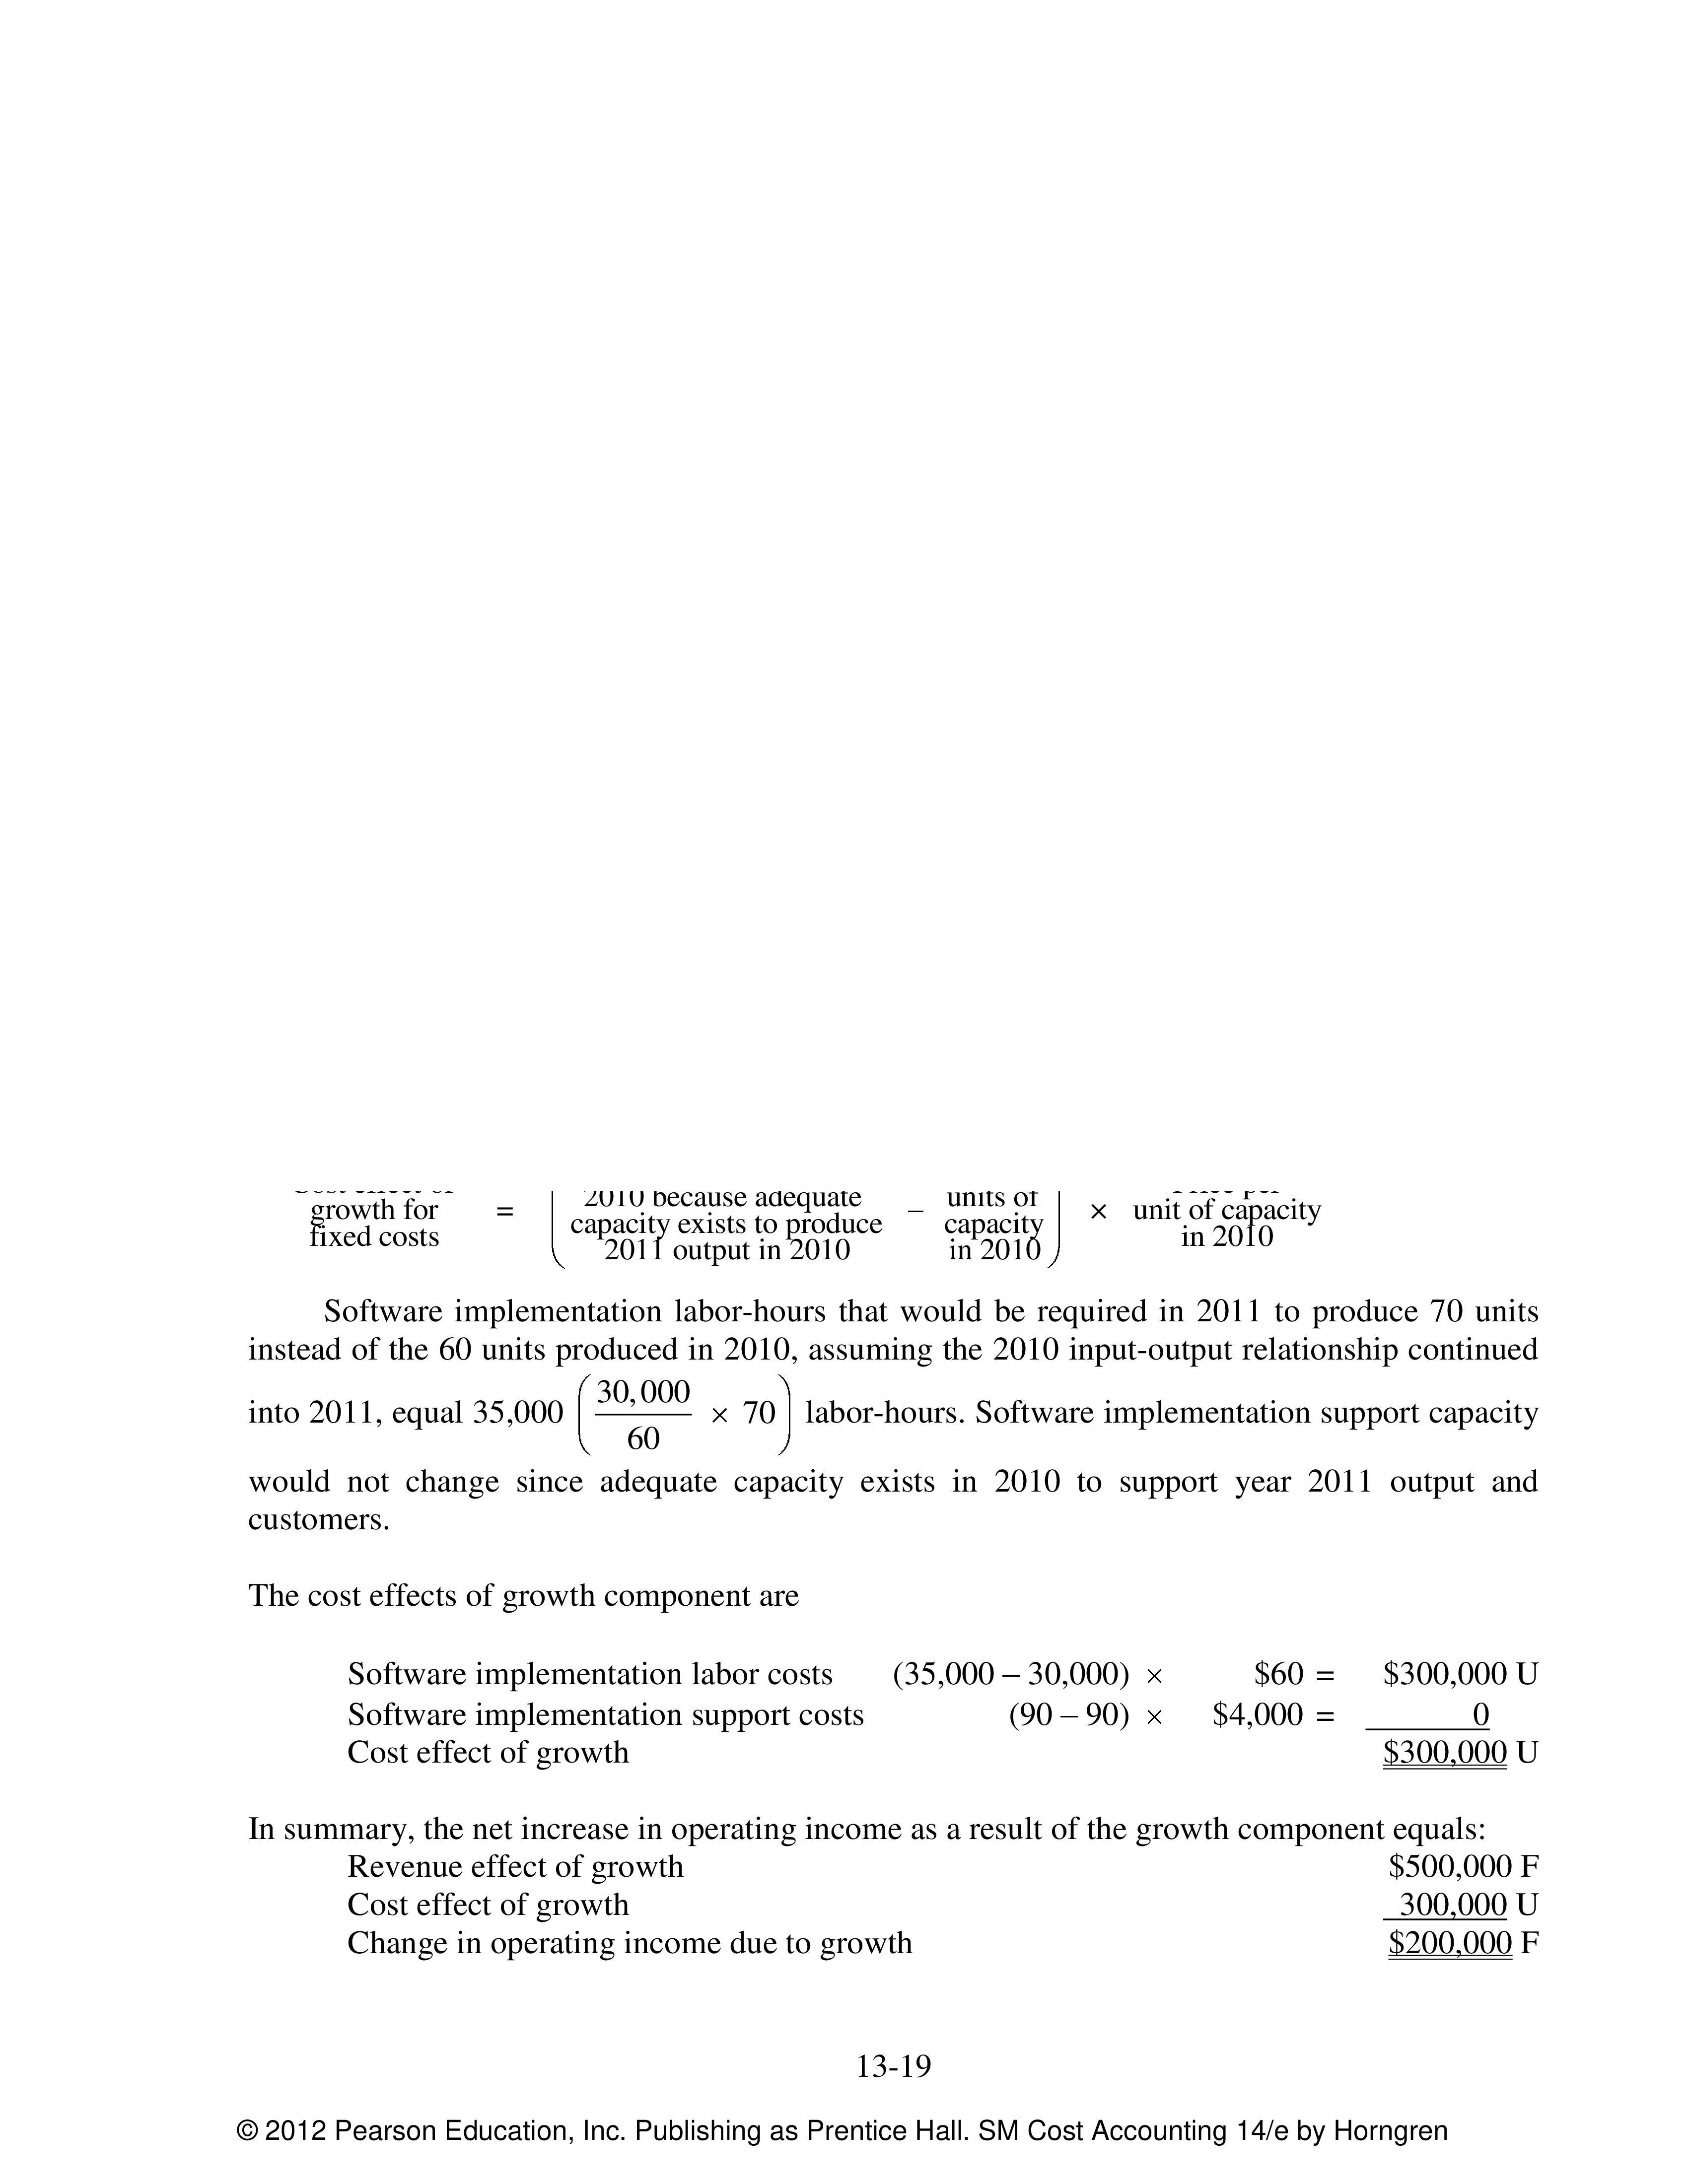
Cost effect of
growth for
variable costs
=
Units of inputActual units of
required to input used
produce 2011 to produce
×
Input
price
in 2010