Unlock document.
This document is partially blurred.
Unlock all pages and 1 million more documents.
Get Access

6-1
CHAPTER 6
MASTER BUDGET AND RESPONSIBILITY ACCOUNTING
6-1 The budgeting cycle includes the following elements:
a. Planning the performance of the company as a whole as well as planning the performance
of its subunits. Management agrees on what is expected.
b. Providing a frame of reference, a set of specific expectations against which actual results
can be compared.
c. Investigating variations from plans. If necessary, corrective action follows investigation.
d. Planning again, in light of feedback and changed conditions.
6-2 The master budget expresses management’s operating and financial plans for a specified
period (usually a fiscal year) and includes a set of budgeted financial statements. It is the initial
plan of what the company intends to accomplish in the period.
6-3 Strategy, plans, and budgets are interrelated and affect one another. Strategy specifies
how an organization matches its own capabilities with the opportunities in the marketplace to
accomplish its objectives. Strategic analysis underlies both long-run and short-run planning. In
turn, these plans lead to the formulation of budgets. Budgets provide feedback to managers about
the likely effects of their strategic plans. Managers use this feedback to revise their strategic
plans.
6-4 We agree that budgeted performance is a better criterion than past performance for
judging managers, because inefficiencies included in past results can be detected and eliminated
in budgeting. Also, future conditions may be expected to differ from the past, and these can also
be factored into budgets.
6-5 Production and marketing traditionally have operated as relatively independent business
functions. Budgets can assist in reducing conflicts between these two functions in two ways.
Consider a beverage company such as Coca-Cola or Pepsi-Cola:
Communication. Marketing could share information about seasonal demand with
production.
Coordination. Production could ensure that output is sufficient to meet, for example,
high seasonal demand in the summer.
6-6 In many organizations, budgets impel managers to plan. Without budgets, managers drift
from crisis to crisis. Research also shows that budgets can motivate managers to meet targets and
improve their performance. Thus, many top managers believe that budgets meet the cost-benefit
test.
6-7 A rolling budget, also called a continuous budget, is a budget or plan that is always
available for a specified future period, by continually adding a period (month, quarter, or year) to
the period that just ended. A four-quarter rolling budget for 2011 is superseded by a four-quarter
rolling budget for April 2011 to March 2012, and so on.
© 2012 Pearson Education, Inc. Publishing as Prentice Hall. SM Cost Accounting 14/e by Horngren
6-2
6-8 The steps in preparing an operating budget are as follows:
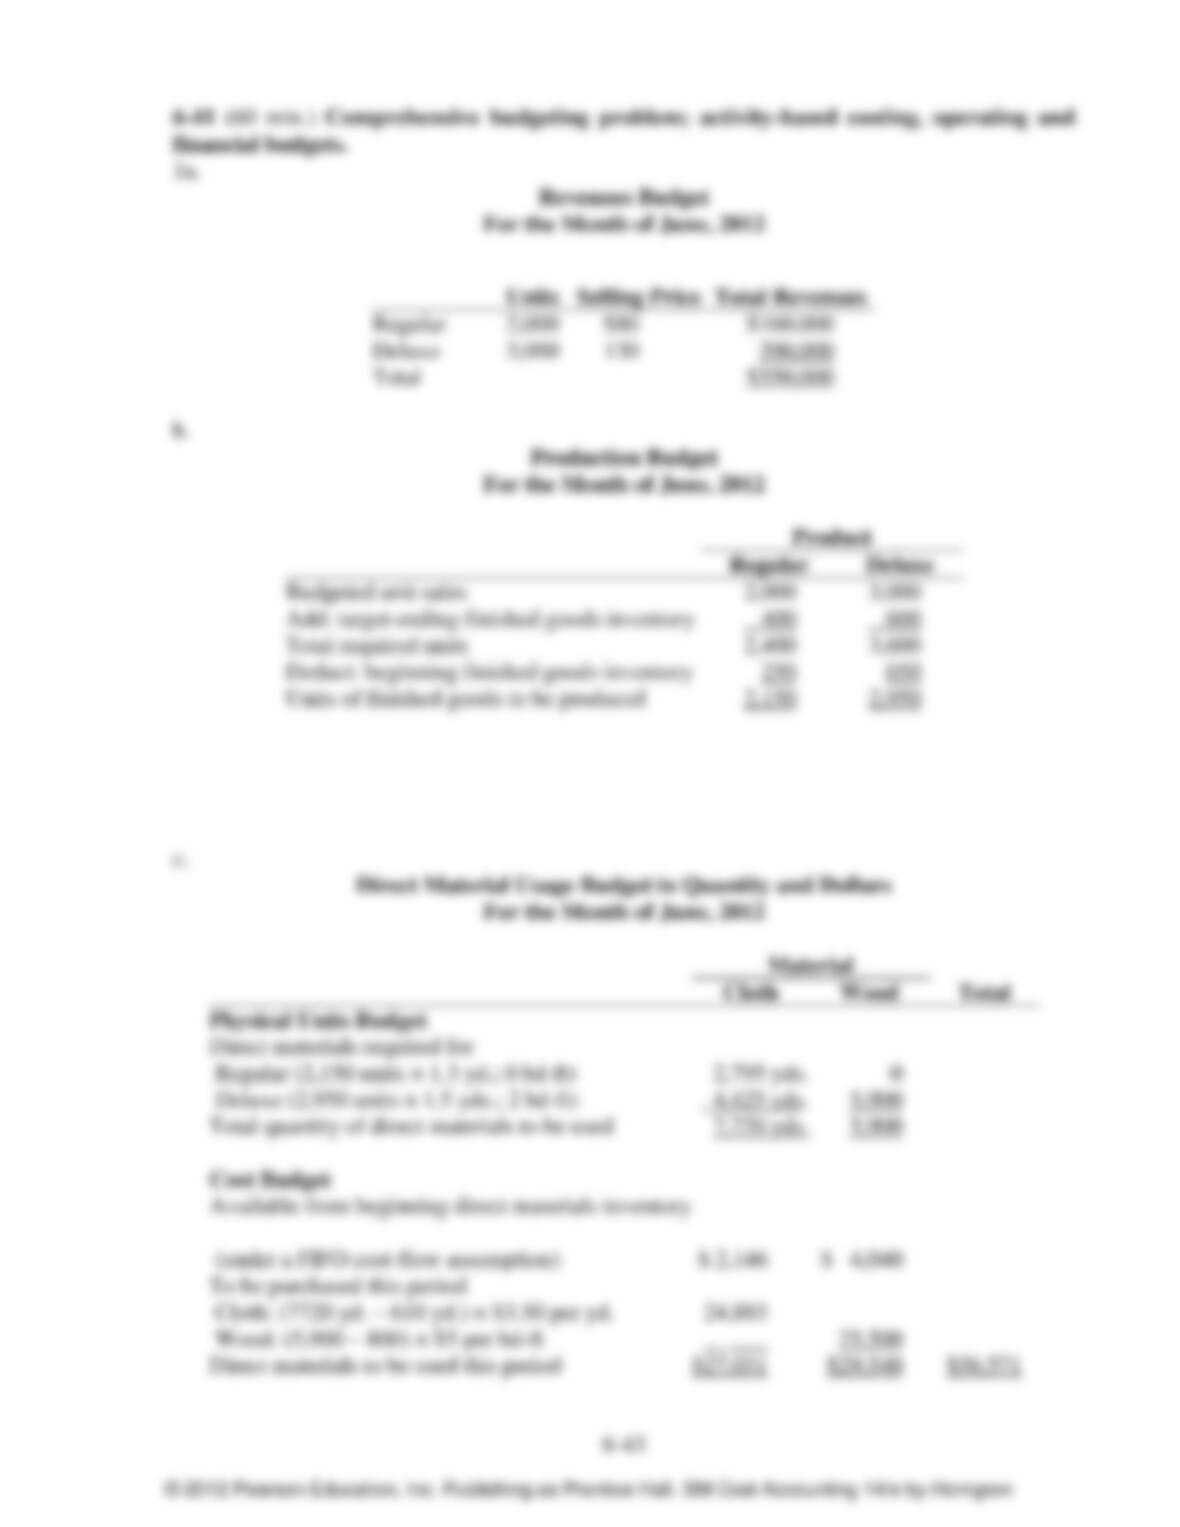
1. Prepare the revenues budget
2. Prepare the production budget (in units)
3. Prepare the direct material usage budget and direct material purchases budget
4. Prepare the direct manufacturing labor budget
5. Prepare the manufacturing overhead budget
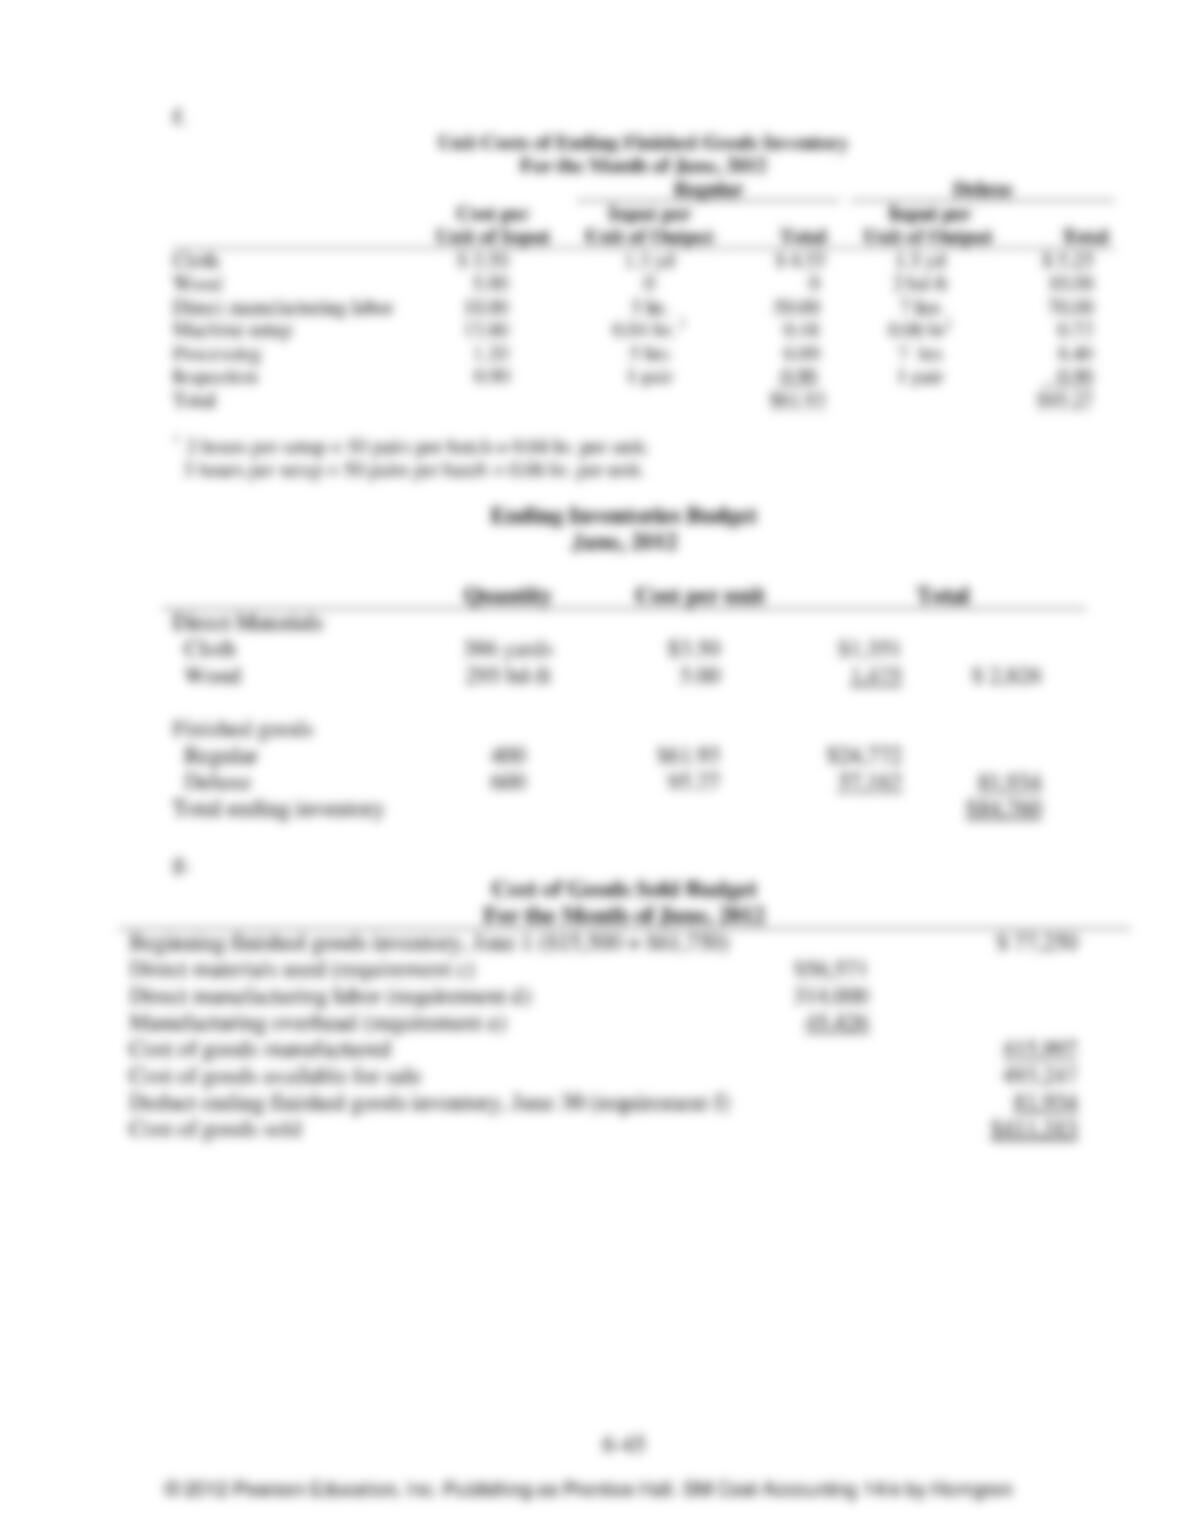
6. Prepare the ending inventories budget
7. Prepare the cost of goods sold budget
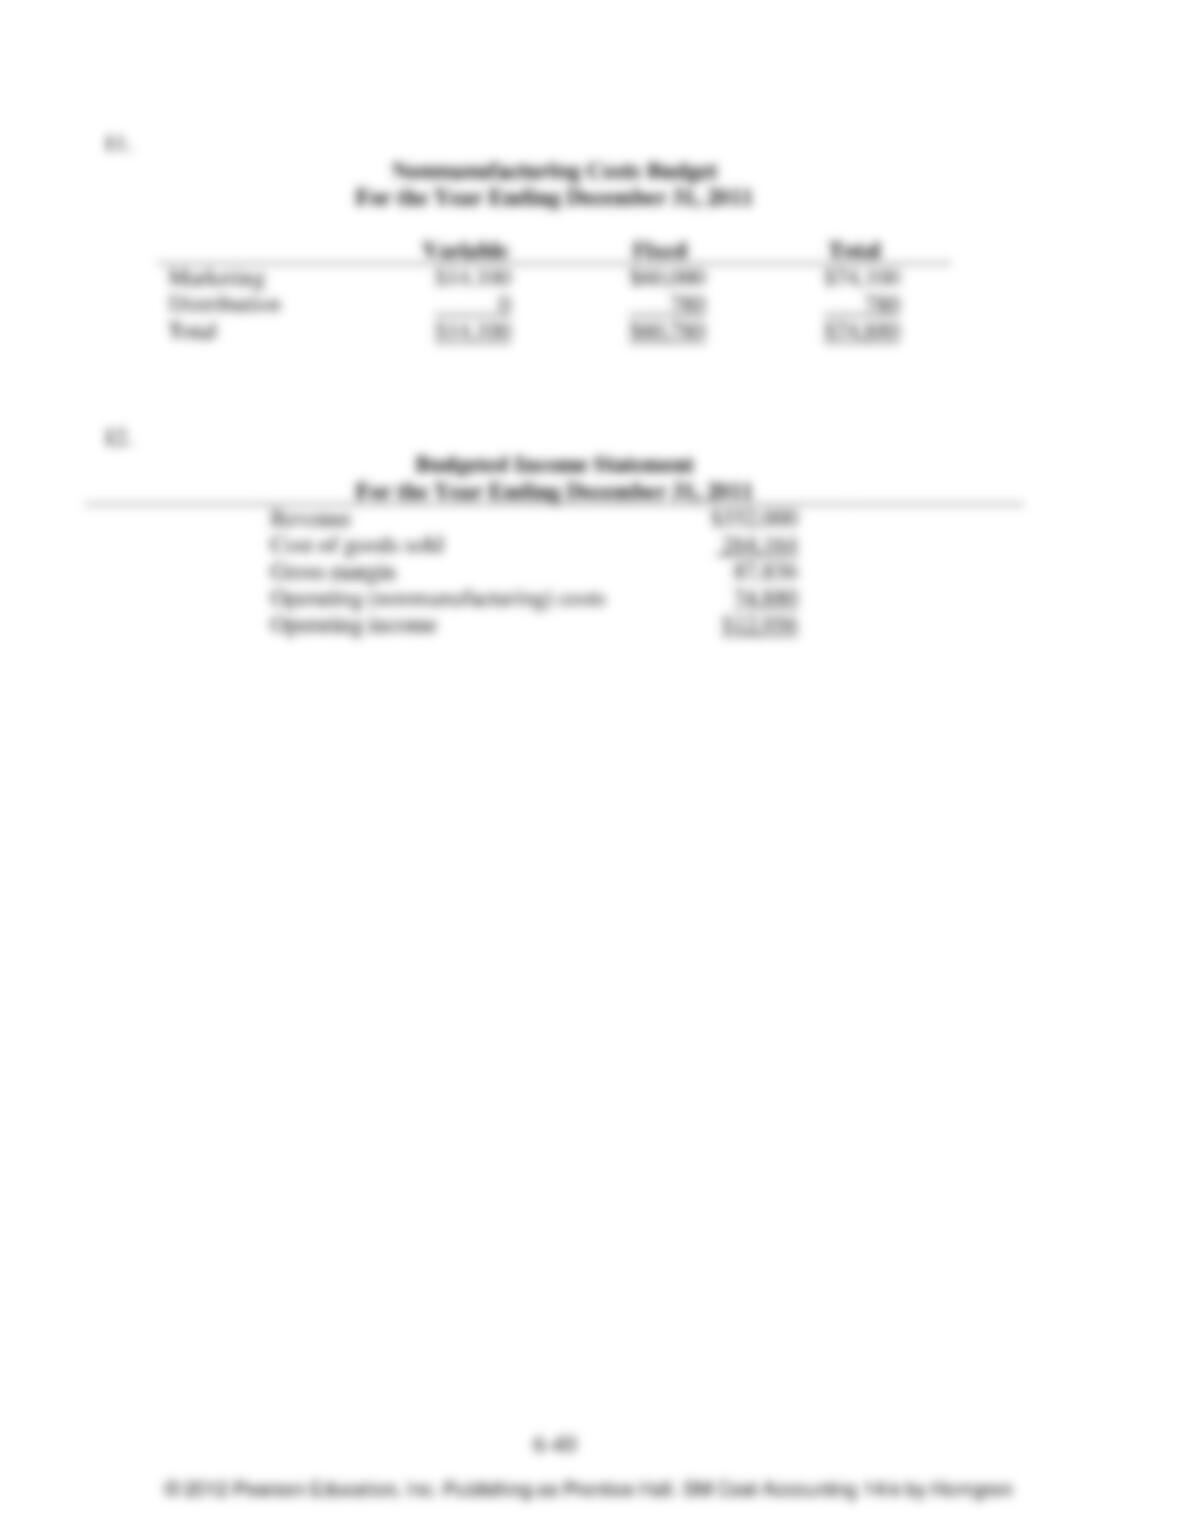
8. Prepare the nonmanufacturing costs budget
9. Prepare the budgeted income statement
6-9 The sales forecast is typically the cornerstone for budgeting, because production (and,
hence, costs) and inventory levels generally depend on the forecasted level of sales.
6-10 Sensitivity analysis adds an extra dimension to budgeting. It enables managers to
examine how budgeted amounts change with changes in the underlying assumptions. This assists
managers in monitoring those assumptions that are most critical to a company in attaining its
budget and allows them to make timely adjustments to plans when appropriate.
6-11 Kaizen budgeting explicitly incorporates continuous improvement anticipated during the
budget period into the budget numbers.
6-12 Nonoutput-based cost drivers can be incorporated into budgeting by the use of activity-
based budgeting (ABB). ABB focuses on the budgeted cost of activities necessary to produce
and sell products and services. Nonoutput-based cost drivers, such as the number of parts,
number of batches, and number of new products can be used with ABB.
6-13 The choice of the type of responsibility center determines what the manager is
accountable for and thereby affects the manager’s behavior. For example, if a revenue center is
chosen, the manager will focus on revenues, not on costs or investments. The choice of a
responsibility center type guides the variables to be included in the budgeting exercise.
6-14 Budgeting in multinational companies may involve budgeting in several different foreign
currencies. Further, management accountants must translate operating performance into a single
currency for reporting to shareholders, by budgeting for exchange rates. Managers and
accountants must understand the factors that impact exchange rates, and where possible, plan
financial strategies to limit the downside of unexpected unfavorable moves in currency
valuations. In developing budgets for operations in different countries, they must also have good
understanding of political, legal and economic issues in those countries.
6-15 No. Cash budgets and operating income budgets must be prepared simultaneously. In
preparing their operating income budgets, companies want to avoid unnecessary idle cash and
unexpected cash deficiencies. The cash budget, unlike the operating income budget, highlights
periods of idle cash and periods of cash shortage, and it allows the accountant to plan cost
effective ways of either using excess cash or raising cash from outside to achieve the company’s
operating income goals.
© 2012 Pearson Education, Inc. Publishing as Prentice Hall. SM Cost Accounting 14/e by Horngren

6-3
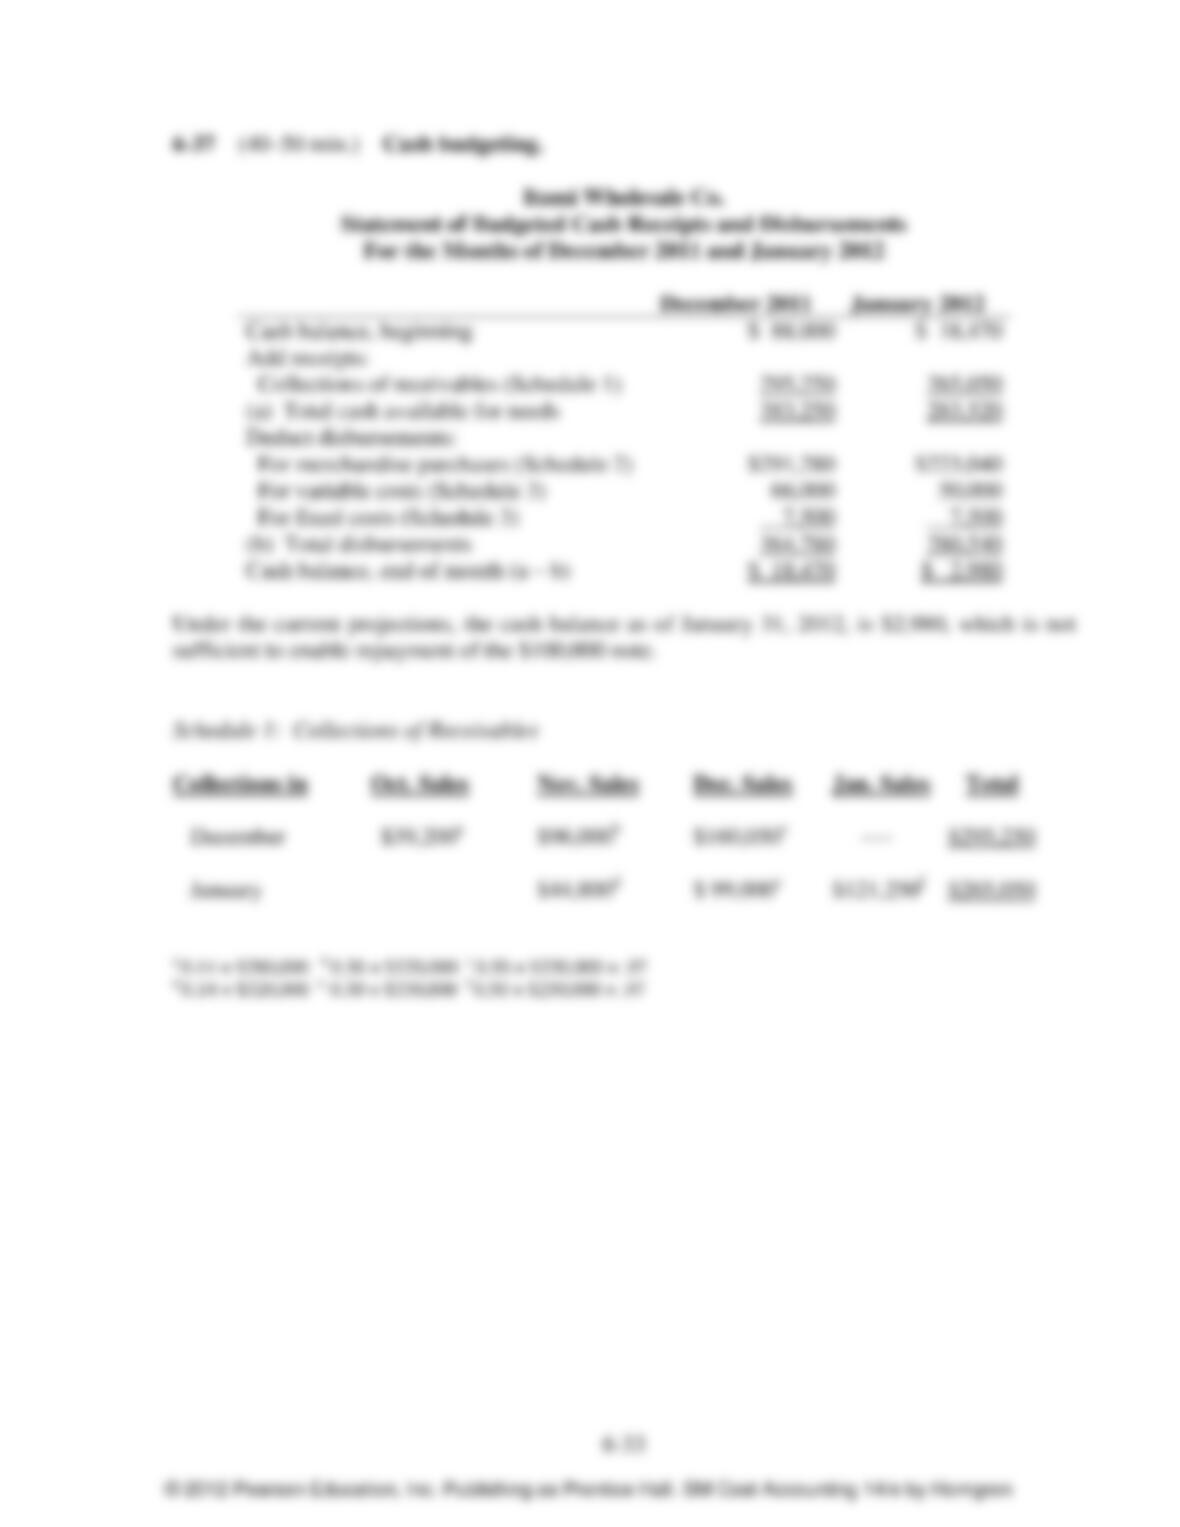
6-16 (15 min.) Sales budget, service setting.
1.
Rouse & Sons
2011
Volume
At 2011
Selling Prices
Expected 2012
Change in Volume
Expected 2012
Volume
Radon Tests
12,200
$290
+6%
12,932
Lead Tests
16,400
$240
-10%
14,760
Rouse & Sons Sales Budget
For the Year Ended December 31, 2012
Selling
Price
Units
Sold
Total
Revenues
Radon Tests
$290
12,932
$3,750,280
Lead Tests
$240
14,760
3,542,400
$7,292,680
2.
Rouse & Sons
2011
Volume
Planned 2012
Selling Prices
Expected 2012
Change in Volume
Expected
2012 Volume
Radon Tests
12,200
$290
+6%
12,932
Lead Tests
16,400
$230
-7%
15,252
Rouse & Sons Sales Budget
For the Year Ended December 31, 2012
Selling
Price
Units Sold
Total
Revenues
Radon Tests
$290
12,932
$3,750,280
Lead Tests
$230
15,252
3,507,960
$7,258,240
Expected revenues at the new 2012 prices are $7,258,240, which is lower than the expected 2012
revenues of $7,292,680 if the prices are unchanged. So, if the goal is to maximize sales revenue
and if Jim Rouse’s forecasts are reliable, the company should not lower its price for a lead test in
2012.
© 2012 Pearson Education, Inc. Publishing as Prentice Hall. SM Cost Accounting 14/e by Horngren
6-4
6-17 (5 min.) Sales and production budget.
Budgeted sales in units 200,000
Add target ending finished goods inventory 25,000
Total requirements 225,000
Deduct beginning finished goods inventory 15,000
Units to be produced 210,000
6-18 (5 min.) Direct materials purchases budget.
Direct materials to be used in production (bottles) 2,500,000
Add target ending direct materials inventory (bottles) 80,000
Total requirements (bottles) 2,580,000
Deduct beginning direct materials inventory (bottles) 50,000
Direct materials to be purchased (bottles) 2,530,000
6-19 (10 min.) Budgeting material purchases.
Production Budget:
Finished Goods
(units)
Budgeted sales 45,000
Add target ending finished goods inventory 18,000
Total requirements 63,000
Deduct beginning finished goods inventory 16,000
Units to be produced 47,000
Direct Materials Purchases Budget:
Direct Materials
(in gallons)
Direct materials needed for production (47,000 3) 141,000
Add target ending direct materials inventory 50,000
Total requirements 191,000
Deduct beginning direct materials inventory 60,000
Direct materials to be purchased 131,000
© 2012 Pearson Education, Inc. Publishing as Prentice Hall. SM Cost Accounting 14/e by Horngren

6-5
6-20 (30 min.) Revenues and production budget.
1.
Selling
Price
Units
Sold
Total
Revenues
12-ounce bottles
$0.25
4,800,000a
$1,200,000
4-gallon units
1.50
1,200,000b
1,800,000
$3,000,000
a 400,000 × 12 months = 4,800,000
b 100,000 × 12 months = 1,200,000
2. Budgeted unit sales (12-ounce bottles) 4,800,000
Add target ending finished goods inventory 600,000
Total requirements 5,400,000
Deduct beginning finished goods inventory 900,000
Units to be produced 4,500,000
3.
Beginning BudgetedTargetBudgeted
= +
inventory salesending inventory production
= 1,200,000 + 200,000 1,300,000
= 100,000 4-gallon units
6-21 (30 min.) Budgeting: direct material usage, manufacturing cost and gross margin.
1.
Direct Material Usage Budget in Quantity and Dollars
Material
Wool
Dye
Total
Physical Units Budget
Direct materials required for
Blue Rugs (200,000 rugs × 36 skeins and 0.8 gal.)
7,200,000 skeins
160,000 gal.
Cost Budget
Available from beginning direct materials inventory: (a)
Wool: 458,000 skeins
$ 961,800
Dye: 4,000 gallons
$ 23,680
To be purchased this period: (b)
Wool: (7,200,000 - 458,000) skeins × $2 per skein
13,484,000
Dye: (160,000 – 4,000) gal. × $6 per gal.
_________
936,000
Direct materials to be used this period: (a) + (b)
$14,445,800
$ 959,680
$15,405,480
© 2012 Pearson Education, Inc. Publishing as Prentice Hall. SM Cost Accounting 14/e by Horngren
6-6
2.
Weaving budgeted
overhead rate
=
$31, 620, 000
12, 400, 000 DMLH
= $2.55 per DMLH
Dyeing budgeted
overhead rate
=
$17, 280, 000
1, 440, 000 MH
= $12 per MH
3.
Budgeted Unit Cost of Blue Rug
Cost per
Unit of Input
Input per
Unit of
Output
Total
Wool
$2
36 skeins
$ 72.00
Dye
6
0.8 gal.
4.80
Direct manufacturing labor
13
62 hrs.
806.00
Dyeing overhead
12
7.21 mach-hrs.
86.40
Weaving overhead
2.55
62 DMLH
158.10
Total
$1127.30
10.2 machine hour per skein 36 skeins per rug = 7.2 machine-hrs. per rug.
4.
Revenue Budget
Units
Selling
Price
Total Revenues
Blue Rugs
200,000
$2,000
$400,000,000
Blue Rugs
185,000
$2,000
$370,000,000
5a.
Sales = 200,000 rugs
Cost of Goods Sold Budget
From Schedule
Total
Beginning finished goods inventory
$ 0
Direct materials used
$15,405,480
Direct manufacturing labor ($806 × 200,000)
161,200,000
Dyeing overhead ($86.40 × 200,000)
17,280,000
Weaving overhead ($158.10 × 200,000)
31,620,000
225,505,480
Cost of goods available for sale
225,505,480
Deduct ending finished goods inventory
0
Cost of goods sold
$225,505,480
© 2012 Pearson Education, Inc. Publishing as Prentice Hall. SM Cost Accounting 14/e by Horngren
5b.
Sales = 185,000 rugs
Cost of Goods Sold Budget
From Schedule
Total
Beginning finished goods inventory
$ 0
Direct materials used
$ 15,405,480
Direct manufacturing labor ($806 × 200,000)
161,200,000
Dyeing overhead ($86.40 × 200,000)
17,280,000
Weaving overhead ($158.10 × 200,000)
31,620,000
225,505,480
Cost of goods available for sale
225,505,480
Deduct ending finished goods inventory
($1,127.30 × 15,000)
16,909,500
Cost of goods sold
$208,595,980
6.
200,000 rugs sold
185,000 rugs sold
Revenue
$400,000,000
$370,000,000
Less: Cost of goods sold
225,505,480
208,595,980
Gross margin
$ 174,494,520
$ 161,404,020
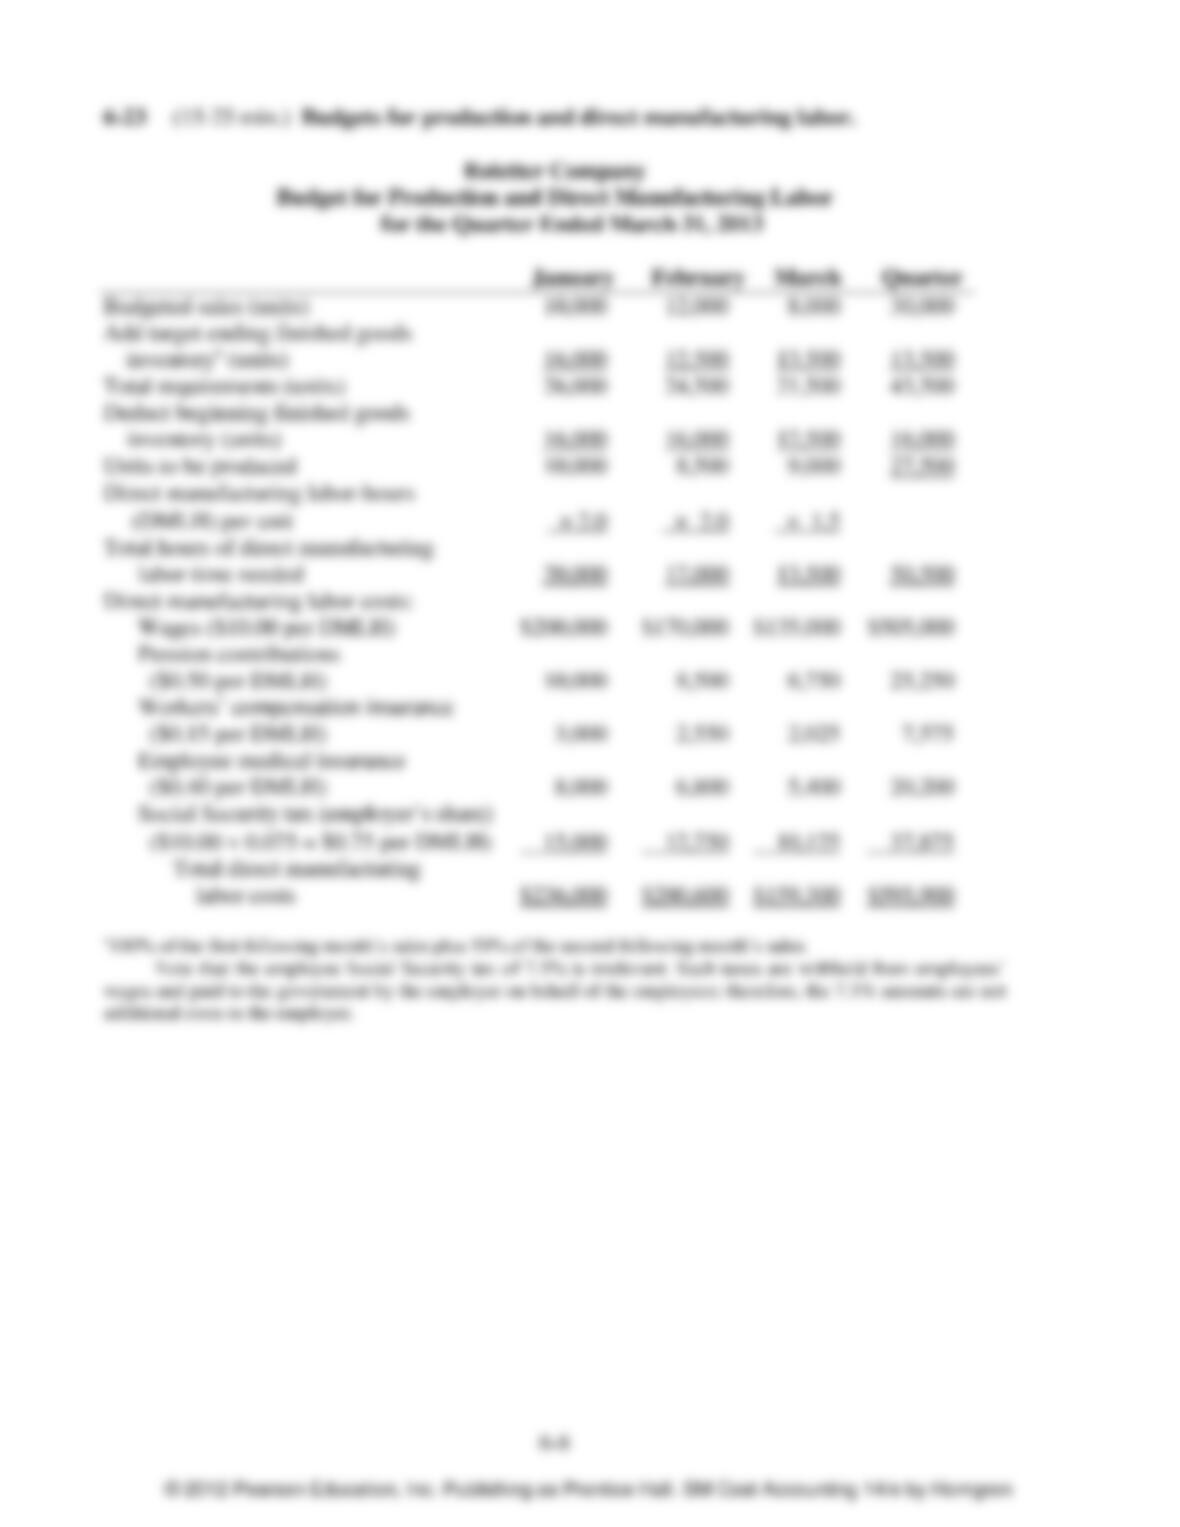
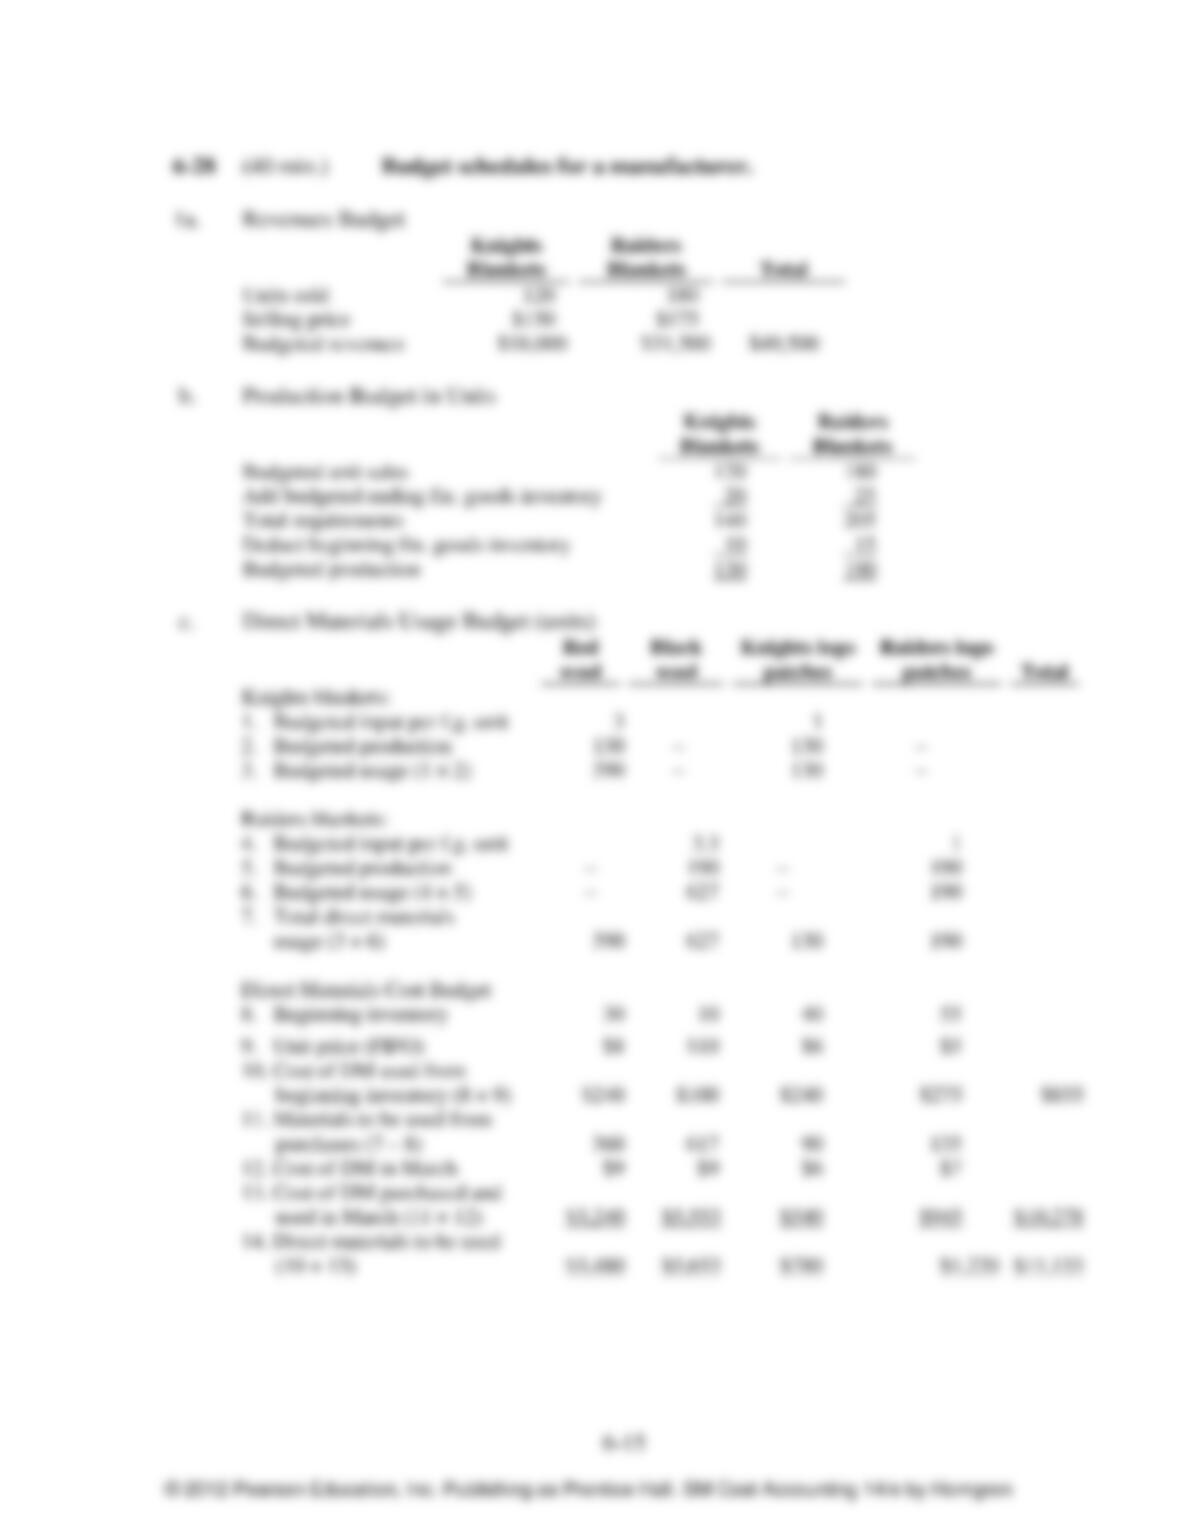
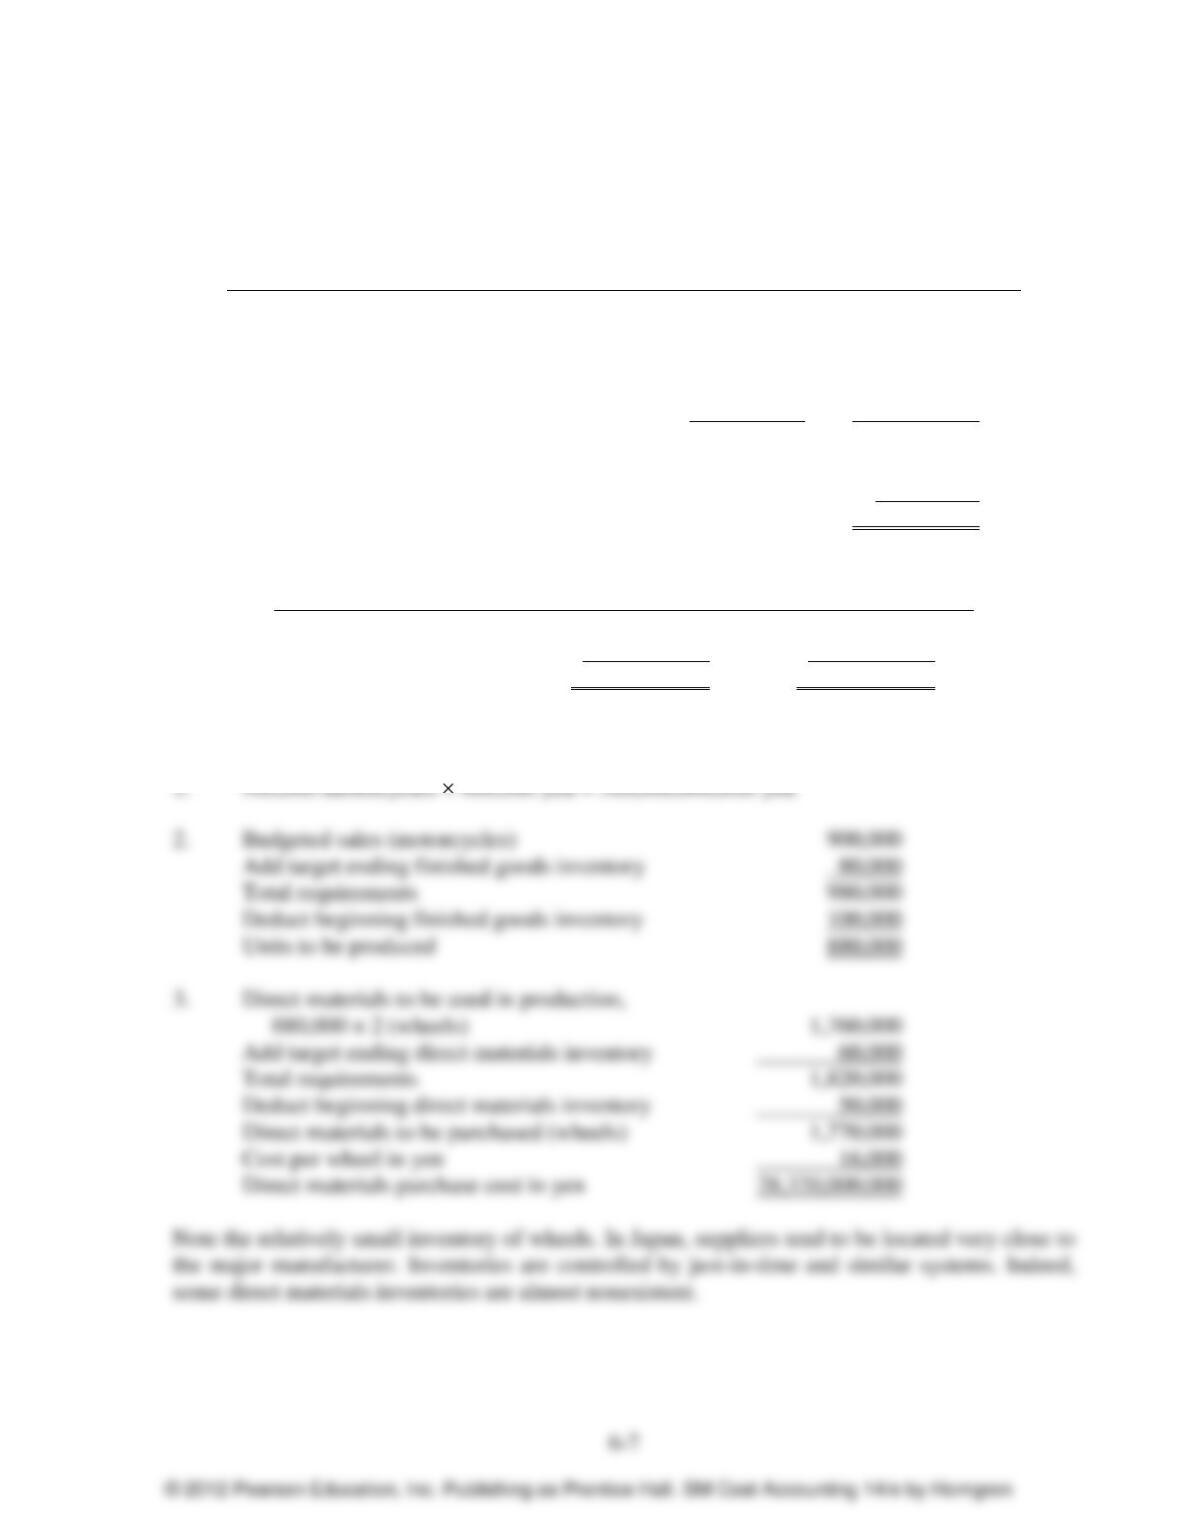
6-22 (15–20 min.) Revenues, production, and purchases budget.