5–1
CHAPTER 5
ACTIVITY-BASED COSTING AND ACTIVITY–BASED MANAGEMENT
5–1 Broad averaging (or ―peanut–butter costing‖) describes a costing approach that uses broad
averages for assigning (or spreading, as in spreading peanut butter) the cost of resources
uniformly to cost objects when the individual products or services, in fact, use those resources in
non–uniform ways.
Broad averaging, by ignoring the variation in the consumption of resources by different
cost objects, can lead to inaccurate and misleading cost data, which in turn can negatively impact
the marketing and operating decisions made based on that information.
5–2 Overcosting may result in overpricing and competitors entering a market and taking
market share for products that a company erroneously believes are low–margin or even
unprofitable.
Undercosting may result in companies selling products on which they are in fact losing
money, when they erroneously believe them to be profitable.
5–3 Costing system refinement means making changes to a simple costing system that
reduces the use of broad averages for assigning the cost of resources to cost objects and provides
better measurement of the costs of overhead resources used by different cost objects.
Three guidelines for refinement are
1. Classify as many of the total costs as direct costs as is economically feasible.
2. Expand the number of indirect cost pools until each of these pools is more
homogenous.
3. Use the cause–and–effect criterion, when possible, to identify the cost–allocation base
for each indirect–cost pool.
5–4 An activity–based approach refines a costing system by focusing on individual activities
(events, tasks, or units of work with a specified purpose) as the fundamental cost objects. It uses
the cost of these activities as the basis for assigning costs to other cost objects such as products
or services.
5–5 Four levels of a cost hierarchy are
(i) Output unit–level costs: costs of activities performed on each individual unit of a
product or service.
(ii) Batch–level costs: costs of activities related to a group of units of products or
services rather than to each individual unit of product or service.
(iii) Product-sustaining costs or service–sustaining costs: costs of activities undertaken to
support individual products or services regardless of the number of units or batches
in which the units are produced.
(iv) Facility-sustaining costs: costs of activities that cannot be traced to individual
products or services but support the organization as a whole.
5–6 It is important to classify costs into a cost hierarchy because costs in different cost pools
relate to different cost–allocation bases and not all cost–allocation bases are unit–level. For
example, an allocation base like setup hours is a batch–level allocation base, and design hours is
a product–sustaining base, both insensitive to the number of units in a batch or the number of
units of product produced. If costs were not classified into a cost hierarchy, the alternative would
© 2012 Pearson Education, Inc. Publishing as Prentice Hall. SM Cost Accounting 14/e by Horngren
5–2
be to consider all costs as unit–level costs, leading to misallocation of those costs that are not
unit–level costs.
5–7 An ABC approach focuses on activities as the fundamental cost objects. The costs of
these activities are built up to compute the costs of products, and services, and so on. Simple
costing systems have one or a few indirect cost pools, irrespective of the heterogeneity in the
facility while ABC systems have multiple indirect cost pools. An ABC approach attempts to use
cost drivers as the allocation base for indirect costs, whereas a simple costing system generally
does not. The ABC approach classifies as many indirect costs as direct costs as possible. A
simple costing system has more indirect costs.
5–8 Four decisions for which ABC information is useful are
1. pricing and product mix decisions,
2. cost reduction and process improvement decisions,
3. product design decisions, and
4. decisions for planning and managing activities.
5–9 No. Department indirect–cost rates are similar to activity–cost rates if (1) a single activity
accounts for a sizable fraction of the department’s costs, or (2) significant costs are incurred on
different activities within a department but each activity has the same cost–allocation base, or (3)
significant costs are incurred on different activities with different cost–allocation bases within a
department but different products use resources from the different activity areas in the same
proportions.
5–10 ―Tell–tale‖ signs that indicate when ABC systems are likely to provide the most benefits
are as follows:
1. Significant amounts of indirect costs are allocated using only one or two cost pools.
2. All or most indirect costs are identified as output–unit–level costs (i.e., few indirect
costs are described as batch–level, product–sustaining, or facility–sustaining costs).
3. Products make diverse demands on resources because of differences in volume,
process steps, batch size, or complexity.
4. Products that a company is well suited to make and sell show small profits, whereas
products that a company is less suited to produce and sell show large profits.
5. Operations staff has significant disagreements with the accounting staff about the
costs of manufacturing and marketing products and services.
5–11 The main costs and limitations of ABC are the measurements necessary to implement the
systems. Even basic ABC systems require many calculations to determine costs of products and
services. Activity–cost rates often need to be updated regularly. Very detailed ABC systems are
costly to operate and difficult to understand. Sometimes the allocations necessary to calculate
activity costs often result in activity–cost pools and quantities of cost–allocation bases being
measured with error. When measurement errors are large, activity–cost information can be
misleading.
5–12 No, ABC systems apply equally well to service companies such as banks, railroads,
hospitals, and accounting firms, as well merchandising companies such as retailers and
distributors.
© 2012 Pearson Education, Inc. Publishing as Prentice Hall. SM Cost Accounting 14/e by Horngren
5–3
5–13 No. An activity–based approach should be adopted only if its expected benefits exceed its
expected costs. It is not always a wise investment. If the jobs, products or services are alike in
the way they consume indirect costs of a company, then a simple costing system will suffice.
5–14 Increasing the number of indirect–cost pools does NOT guarantee increased accuracy of
product or service costs. If the existing cost pool is already homogeneous, increasing the number
of cost pools will not increase accuracy. If the existing cost pool is not homogeneous, accuracy
will increase only if the increased cost pools themselves increase in homogeneity vis–à–vis the
single cost pool.
5–15 The controller faces a difficult challenge. The benefits of a better accounting system
show up in improved decisions by managers. It is important that the controller have the support
of these managers when seeking increased investments in accounting systems. Statements by
these managers showing how their decisions will be improved by a better accounting system are
the controller’s best arguments when seeking increased funding. For example, the new system
will result in more accurate product costs which will influence pricing and product mix
decisions. The new system can also be used to reduce product costs which will lower selling
prices. As a result, the customer will benefit from the new system.
© 2012 Pearson Education, Inc. Publishing as Prentice Hall. SM Cost Accounting 14/e by Horngren
5–4
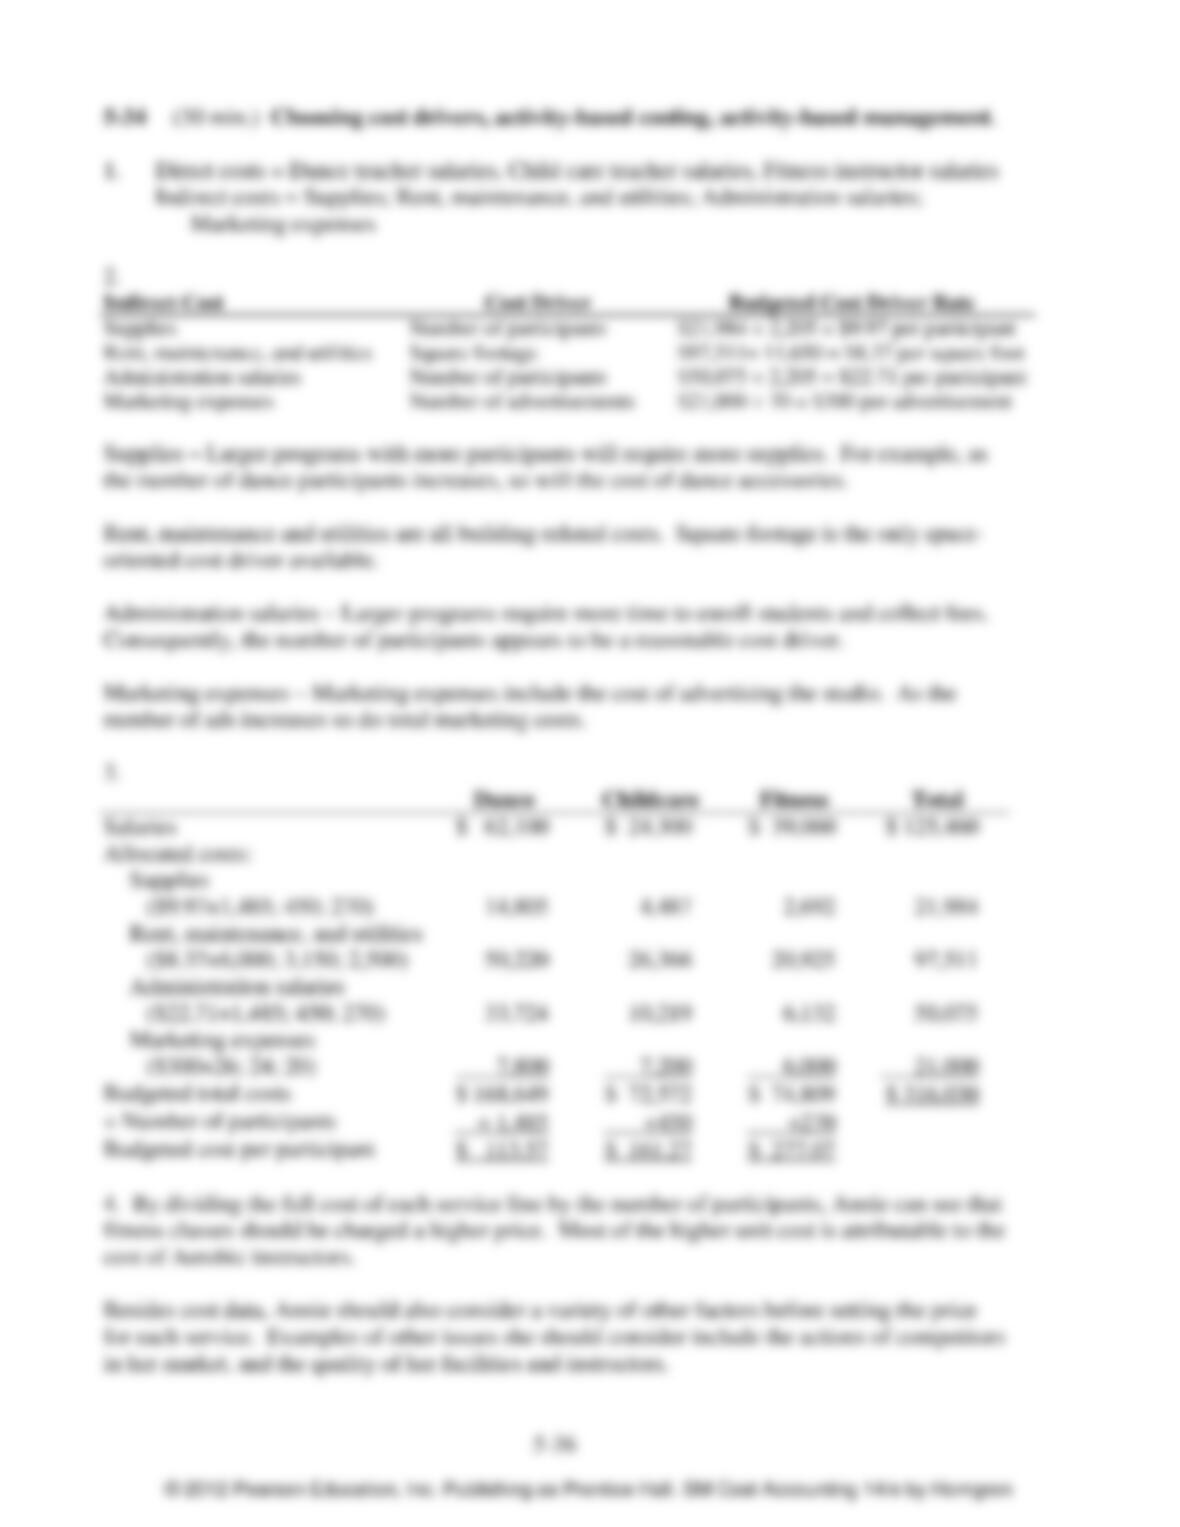
5–16 (20 min.) Cost hierarchy.
1. a. Indirect manufacturing labor costs of $1,450,000 support direct manufacturing labor
and are output unit–level costs. Direct manufacturing labor generally increases with
output units, and so will the indirect costs to support it.
b. Batch–level costs are costs of activities that are related to a group of units of a product
rather than each individual unit of a product. Purchase order–related costs (including
costs of receiving materials and paying suppliers) of $850,000 relate to a group of
units of product and are batch–level costs.
c. Cost of indirect materials of $275,000 generally changes with labor hours or machine
hours which are unit–level costs. Therefore, indirect material costs are output unit–
level costs.
d. Setup costs of $630,000 are batch–level costs because they relate to a group of units
of product produced after the machines are set up.
e. Costs of designing processes, drawing process charts, and making engineering
changes for individual products, $775,000, are product–sustaining because they relate
to the costs of activities undertaken to support individual products regardless of the
number of units or batches in which the product is produced.
f. Machine–related overhead costs (depreciation and maintenance) of $1,500,000 are
output unit–level costs because they change with the number of units produced.
g. Plant management, plant rent, and insurance costs of $925,000 are facility–sustaining
costs because the costs of these activities cannot be traced to individual products or
services but support the organization as a whole.
2. The complex boom box made in many batches will use significantly more batch–level
overhead resources compared to the simple boom box that is made in a few batches. In addition,
the complex boom box will use more product–sustaining overhead resources because it is
complex. Because each boom box requires the same amount of machine–hours, both the simple
and the complex boom box will be allocated the same amount of overhead costs per boom box if
Hamilton uses only machine–hours to allocate overhead costs to boom boxes. As a result, the
complex boom box will be undercosted (it consumes a relatively high level of resources but is
reported to have a relatively low cost) and the simple boom box will be overcosted (it consumes
a relatively low level of resources but is reported to have a relatively high cost).
3. Using the cost hierarchy to calculate activity–based costs can help Hamilton to identify
both the costs of individual activities and the cost of activities demanded by individual products.
Hamilton can use this information to manage its business in several ways:
a. Pricing and product mix decisions. Knowing the resources needed to manufacture and
sell different types of boom boxes can help Hamilton to price the different boom
boxes and also identify which boom boxes are more profitable. It can then emphasize
its more profitable products.
b. Hamilton can use information about the costs of different activities to improve
processes and reduce costs of the different activities. Hamilton could have a target of
reducing costs of activities (setups, order processing, etc.) by, say, 3% and constantly
seek to eliminate activities and costs (such as engineering changes) that its customers
perceive as not adding value.
c. Hamilton management can identify and evaluate new designs to improve performance
by analyzing how product and process designs affect activities and costs.
d. Hamilton can use its ABC systems and cost hierarchy information to plan and
manage activities. What activities should be performed in the period and at what cost?
© 2012 Pearson Education, Inc. Publishing as Prentice Hall. SM Cost Accounting 14/e by Horngren

5–5
5–17 (25 min.) ABC, cost hierarchy, service.
1. Output unit–level costs
a. Direct–labor costs, $146,000
b. Equipment–related costs (rent, maintenance, energy, and so on), $350,000
These costs are output unit–level costs because they are incurred on each unit of materials
tested, that is, for every hour of testing.
Batch–level costs
c. Setup costs, $430,000
These costs are batch–level costs because they are incurred each time a batch of materials
is set up for either HT or ST, regardless of the number of hours for which the tests are
subsequently run.
Service-sustaining costs
d. Costs of designing tests, $264,000.
These costs are service–sustaining costs because they are incurred to design the HT and
ST tests, regardless of the number of batches tested or the number of hours of test time.
2.
Heat Testing (HT)
Stress Testing (ST)
Total
(1)
Per Hour
(2) = (1) 40,000
Total
(3)
Per Hour
(4) = (3) 30,000
Direct labor costs (given)
$100,000
$ 2.50
$ 46,000
$ 1.53
Equipment-related costs
$5 per hour* 40,000 hours
200,000
5.00
$5 per hour* 30,000 hours
150,000
5.00
Setup costs
$25 per setup-hour† 13,600 setup-hours
340,000
8.50
$25 per setup-hour† 3,600 setup-hours
90,000
3.00
Costs of designing tests
$60 per hour** 3,000 hours
180,000
4.50
$60 per hour** 1,400 hours
84,000
2.80
Total costs
$820,000
$20.50
$370,000
$12.33
*$350,000 (40,000 + 30,000) hours = $5 per test–hour
†$430,000 (13,600 + 3,600) setup hours = $25 per setup–hour
**$264,000 (3,000 + 1,400) hours = $60 per hour
At a cost per test–hour of $17, the simple costing system undercosts heat testing ($20.50) and
overcosts stress testing ($12.33). The reason is that heat testing uses direct labor, setup, and
design resources per hour more intensively than stress testing. Heat tests are more complex, take
longer to set up, and are more difficult to design. The simple costing system assumes that testing
costs per hour are the same for heat testing and stress testing.
© 2012 Pearson Education, Inc. Publishing as Prentice Hall. SM Cost Accounting 14/e by Horngren
5–6
3. The ABC system better captures the resources needed for heat testing and stress testing
because it identifies all the various activities undertaken when performing the tests and
recognizes the levels of the cost hierarchy at which costs vary. Hence, the ABC system generates
more accurate product costs.
Vineyard’s management can use the information from the ABC system to make better
pricing and product mix decisions. For example, it might decide to increase the prices charged
for the more costly heat testing and consider reducing prices on the less costly stress testing.
Vineyard should watch if competitors are underbidding Vineyard in stress testing, and causing it
to lose business. Vineyard can also use ABC information to reduce costs by eliminating
processes and activities that do not add value, identifying and evaluating new methods to do
testing that reduce the activities needed to do the tests, reducing the costs of doing various
activities, and planning and managing activities.
© 2012 Pearson Education, Inc. Publishing as Prentice Hall. SM Cost Accounting 14/e by Horngren

5–7
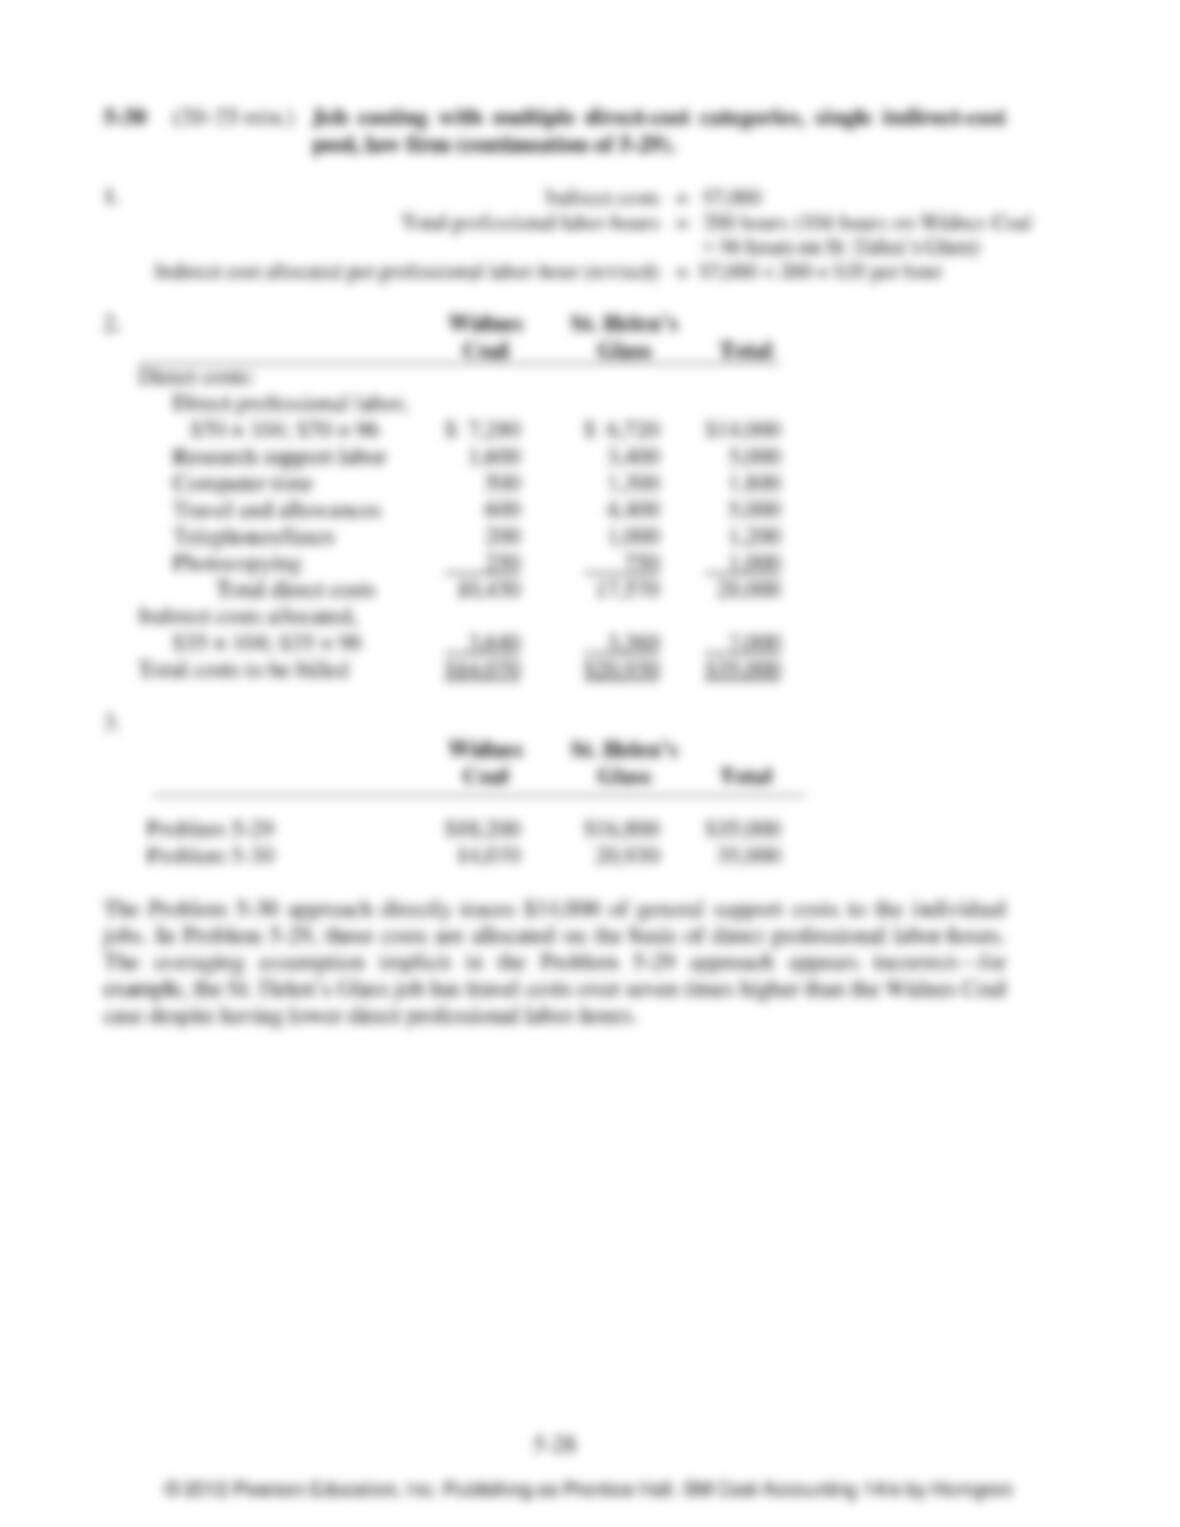
5–18 (15 min.) Alternative allocation bases for a professional services firm.
1.
Direct Professional Time
Support Services
Amount
Client
Rate per
Hour
Number
of Hours
Total
Rate
Total
Billed to
Client
(1)
(2)
(3)
(4) = (2) (3)
(5)
(6) = (4) (5)
(7) = (4) + (6)
SAN ANTONIO
DOMINION
Walliston
Boutin
Abbington
$640
220
100
26
5
39
$16,640
1,100
3,900
30%
30
30
$4,992
330
1,170
$21,632
1,430
5,070
$28,132
AMSTERDAM
ENTERPRISES
Walliston
Boutin
Abbington
$640
220
100
4
14
52
$2,560
3,080
5,200
30%
30
30
$768
924
1,560
$ 3,328
4,004
6,760
$14,092
2.
Direct Professional Time
Support Services
Client
Rate
per
Hour
Number
of Hours
Total
Rate per
Hour
Total
Amount
Billed to
Client
(1)
(2)
(3)
(4) = (2) (3)
(5)
(6) = (3) (5)
(7) = (4) + (6)
SAN ANTONIO
DOMINION
Walliston
Boutin
Abbington
$640
220
100
26
5
39
$16,640
1,100
3,900
$75
75
75
$1,950
375
2,925
$18,590
1,475
6,825
$26,890
AMSTERDAM
ENTERPRISES
Walliston
Boutin
Abbington
$640
220
100
4
14
52
$2,560
3,080
5,200
$75
75
75
$ 300
1,050
3,900
$ 2,860
4,130
9,100
$16,090
Requirement 1 Requirement 2
San Antonio Dominion $28,132 $26,890
Amsterdam Enterprises 14,092 16,090
$42,224 $42,980
Both clients use 70 hours of professional labor time. However, San Antonio Dominion uses a
higher proportion of Walliston’s time (26 hours), which is more costly. This attracts the highest
support–services charge when allocated on the basis of direct professional labor costs.
© 2012 Pearson Education, Inc. Publishing as Prentice Hall. SM Cost Accounting 14/e by Horngren
5–8
3. Assume that the Walliston Group uses a cause–and–effect criterion when choosing the
allocation base for support services. You could use several pieces of evidence to determine
whether professional labor costs or hours is the driver of support–service costs:
a. Interviews with personnel. For example, staff in the major cost categories in support
services could be interviewed to determine whether Walliston requires more support
per hour than, say, Abbington. The professional labor costs allocation base implies
that an hour of Walliston’s time requires 6.40 ($640 ÷ $100) times more support–
service dollars than does an hour of Abbington’s time.
b. Analysis of tasks undertaken for selected clients. For example, if computer–related
costs are a sizable part of support costs, you could determine if there was a systematic
relationship between the percentage involvement of professionals with high billing
rates on cases and the computer resources consumed for those cases.
© 2012 Pearson Education, Inc. Publishing as Prentice Hall. SM Cost Accounting 14/e by Horngren

5–9
5–19 (20 min.) Plantwide, department and ABC indirect cost rates.
1.
Actual plant-wide variable
MOH rate based on machine
hours, $308,600
4,000
$77.15 per machine hour
United
Motors
Holden
Motors
Leland
Vehicle
Total
Variable manufacturing overhead, allocated
based on machine hours
($77.15
120; $77.15
2,800; $77.15
1,080)
$9,258
$216,020
$83,322
$308,600
2.
Department
Variable MOH
in 2011
Total
Driver Units
Rate
Design
$39,000
390
$100
per CAD-design hour
Production
29,600
370
$ 80
per engineering hour
Engineering
240,000
4,000
$ 60
per machine hour
United
Motors
Holden
Motors
Leland
Vehicle
Total
Design-related overhead, allocated on CAD–design hours
(110
$100; 200
$100; 80
$100)
$11,000
$ 20,000
$ 8,000
$ 39,000
Production-related overhead, allocated on engineering hours
(70
$80; 60
$80; 240
$80)
5,600
4,800
19,200
29,600
Engineering-related overhead, allocated on machine hours
(120
$60; 2,800
$60; 1,080
$60)
7,200
168,000
64,800
240,000
Total
$23,800
$192,800
$92,000
$308,600
3.
United
Motors
Holden
Motors
Leland
Vehicle
a. Department rates
(Requirement 2)
b. Plantwide rate
(Requirement 1)
$23,800
$ 9,258
$192,800
$216,020
$92,000
$83,322
Ratio of (a) ÷ (b)
2.57
0.89
1.10
The variable manufacturing overhead allocated to United Motors increases by 157% under the
department rates, the overhead allocated to Holden decreases by about 11% and the overhead
allocated to Leland increases by about 10%.
The three contracts differ sizably in the way they use the resources of the three
departments.
© 2012 Pearson Education, Inc. Publishing as Prentice Hall. SM Cost Accounting 14/e by Horngren

5–10
The percentage of total driver units in each department used by the companies is:
Department
Cost
Driver
United
Motors
Holden
Motors
Leland
Vehicle
Design
Engineering
Production
CAD-design hours
Engineering hours
Machine hours
28%
19
3
51%
16
70
21%
65
27
The United Motors contract uses only 3% of total machines hours in 2011, yet uses 28%
of CAD design–hours and 19% of engineering hours. The result is that the plantwide rate, based
on machine hours, will greatly underestimate the cost of resources used on the United Motors
contract. This explains the 157% increase in indirect costs assigned to the United Motors
contract when department rates are used. The Leland Vehicle contract also uses far fewer
machine–hours than engineering–hours and is also undercosted.
In contrast, the Holden Motors contract uses less of design (51%) and engineering (16%)
than of machine–hours (70%). Hence, the use of department rates will report lower indirect costs
for Holden Motors than does a plantwide rate.
Holden Motors was probably complaining under the use of the simple system because its
contract was being overcosted relative to its consumption of MOH resources. United and Leland,
on the other hand, were having their contracts undercosted and underpriced by the simple
system. Assuming that AP is an efficient and competitive supplier, if the new department–based
rates are used to price contracts, United and Leland will be unhappy. AP should explain to
United and Leland how the calculation was done, and point out United’s high use of design and
engineering resources and Leland’s high use of engineering resources relative to production
machine hours. Discuss ways of reducing the consumption of those resources, if possible, and
show willingness to partner with them to do so. If the price rise is going to be steep, perhaps
offer to phase in the new prices.
4. Other than for pricing, AP can also use the information from the department–based
system to examine and streamline its own operations so that there is maximum value–added from
all indirect resources. It might set targets over time to reduce both the consumption of each
indirect resource and the unit costs of the resources. The department–based system gives AP
more opportunities for targeted cost management.
5. It would not be worthwhile to further refine the cost system into an ABC system if (1) a
single activity accounts for a sizable proportion of the department’s costs or (2) significant costs
are incurred on different activities within a department, but each activity has the same cost driver
or (3) there wasn’t much variation among contracts in the consumption of activities within a
department. If, for example, most activities within the design department were, in fact, driven by
CAD–design hours, then the more refined system would be more costly and no more accurate
than the department–based cost system. Even if there was sufficient variation, considering the
relative sizes of the 3 department cost pools, it may only be cost–effective to further analyze the
engineering cost pool, which consumes 78% ($240,000
$308,600) of the manufacturing
overhead.
© 2012 Pearson Education, Inc. Publishing as Prentice Hall. SM Cost Accounting 14/e by Horngren

5–11
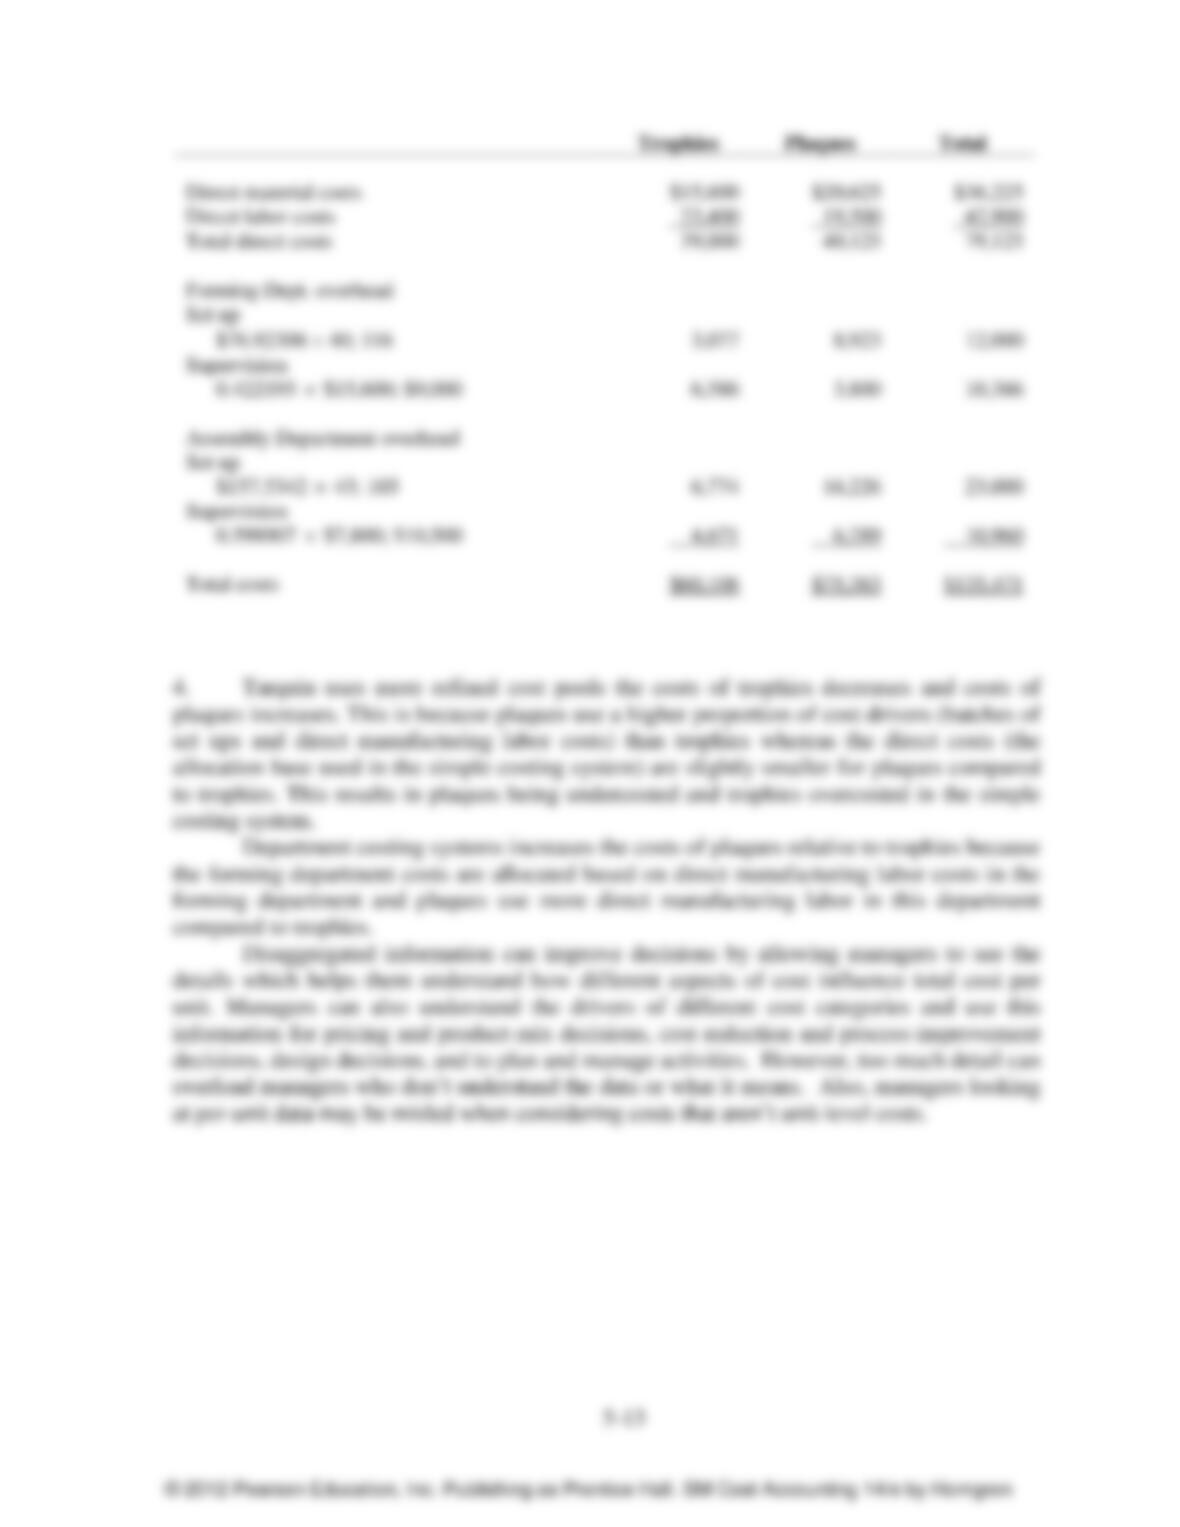
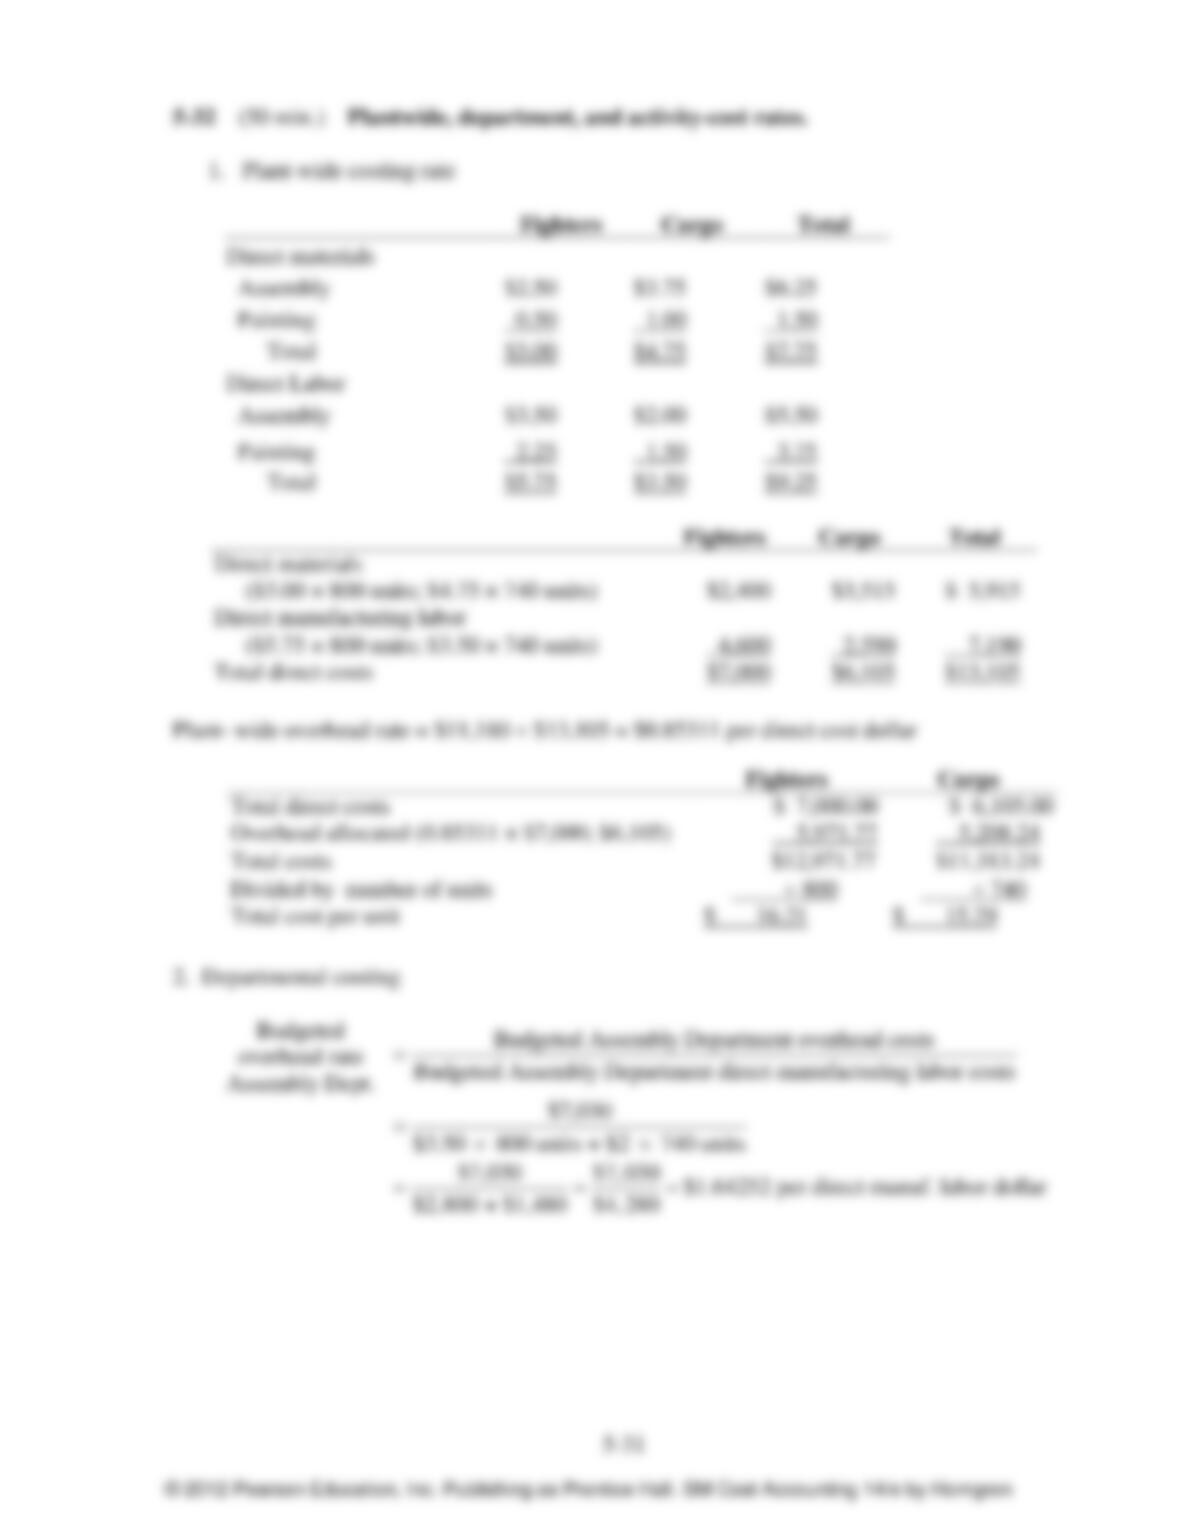
5–20 (50 min.) Plantwide, department, and activity–cost rates.
1.
Trophies
Plaques
Total
Direct materials
Forming
$13,000
$11,250
Assembly
2,600
9,375
Total
15,600
20,625
Direct Labor
Forming
15,600
9,000
Assembly
7,800
10,500
Total
23,400
19,500
Total direct costs
$39,000
$40,125
$79,125
Budgeted
overhead rate
=
($12, 000 $10,386 $23, 000 $10,960) $56,346
$79,125 $79,125
=
$0.712114
per dollar of direct cost
Trophies
Plaques
Total
Direct materials
$15,600
$20,625
$ 36,225
Direct labor
23,400
19,500
42,900
Total direct cost
39,000
40,125
79,125
Allocated overhead*
27,772
28,574
56,346
Total costs
$66,772
$68,699
$135,471
*Allocated overhead = Total direct cost Budgeted overhead rate (0.712114).
2.
Budgeted
overhead rate
Forming Dept.
—
=
Budgeted Forming Department overhead cos ts
Budgeted Forming Department direct–labor costs
=
$12, 000 $10,386
$15, 600 $9, 000
=
$22,386
$24, 600
$0.91 per Forming Department direct–labor dollar
Budgeted
overhead rate
Assembly Dept.
—
=
Budgeted Assembly Department overhead costs
Budgeted Assembly Department direct costs
=
$23, 000 $10,960
($2, 600 $9,375 $7,800 $10,500)
=
$33,960
$30, 275
$1.121718 per Assembly Department direct cost dollar
© 2012 Pearson Education, Inc. Publishing as Prentice Hall. SM Cost Accounting 14/e by Horngren
Trophies
Plaques
Total
Direct materials
$15,600
$20,625
$ 36,225
Direct labor
23,400
19,500
42,900
Total direct cost
39,000
40,125
79,125
Allocated overhead
Forming Dept.a
14,196
8,190
22,386
Assembly Dept.b
11,666
22,294
33,960
Total costs
$64,862
$70,609
$135,471
3.
Trophies
Plaques
Total
a Forming Dept.
Direct labor costs
$15,600
$ 9,000
$24,600
Allocated overhead
(0.91 × $15,600; $9,000)
$14,196
$ 8,190
$22,386
b Assembly Dept.
Total direct costs
($2,600 + $7,800; $9,375 + $10,500)
$10,400
$19,875
$30,275
Allocated overhead
$11,666
$22,294
$33,960