17–1
CHAPTER 17
PROCESS COSTING
17–1 Industries using process costing in their manufacturing area include chemical processing,
oil refining, pharmaceuticals, plastics, brick and tile manufacturing, semiconductor chips,
beverages, and breakfast cereals.
17–2 Process costing systems separate costs into cost categories according to the timing of
when costs are introduced into the process. Often, only two cost classifications, direct materials
and conversion costs, are necessary. Direct materials are frequently added at one point in time,
often the start or the end of the process. All conversion costs are added at about the same time,
but in a pattern different from direct materials costs. Conversion costs are often added
throughout the process, which can of any length of time, lasting from seconds to several months.
17–3 Equivalent units is a derived amount of output units that takes the quantity of each input
(factor of production) in units completed or in incomplete units in work in process, and converts
the quantity of input into the amount of completed output units that could be made with that
quantity of input. Each equivalent unit is comprised of the physical quantities of direct materials
or conversion costs inputs necessary to produce output of one fully completed unit. Equivalent
unit measures are necessary since all physical units are not completed to the same extent at the
same time.
17–4 The accuracy of the estimates of completion depends on the care and skill of the
estimator and the nature of the process. Semiconductor chips may differ substantially in the
finishing necessary to obtain a final product. The amount of work necessary to finish a product
may not always be easy to ascertain in advance.
17–5 The five key steps in process costing follow:
Step 1: Summarize the flow of physical units of output.
Step 2: Compute output in terms of equivalent units.
Step 3: Summarize total costs to account for.
Step 4: Compute cost per equivalent unit.
Step 5: Assign total costs to units completed and to units in ending work in process.
17–6 Three inventory methods associated with process costing are:
Weighted average.
First–in, first–out.
Standard costing.
17–7 The weighted–average process–costing method calculates the equivalent–unit cost of all
the work done to date (regardless of the accounting period in which it was done), assigns this
cost to equivalent units completed and transferred out of the process, and to equivalent units in
ending work–in–process inventory.
© 2012 Pearson Education, Inc. Publishing as Prentice Hall. SM Cost Accounting 14/e by Horngren
17–2
17–8 FIFO computations are distinctive because they assign the cost of the previous
accounting period’s equivalent units in beginning work–in–process inventory to the first units
completed and transferred out of the process and assign the cost of equivalent units worked on
during the current period first to complete beginning inventory, next to start and complete new
units, and finally to units in ending work–in–process inventory. In contrast, the weighted–average
method costs units completed and transferred out and in ending work in process at the same
average cost.
17–9 FIFO should be called a modified or departmental FIFO method because the goods
transferred in during a given period usually bear a single average unit cost (rather than a distinct
FIFO cost for each unit transferred in) as a matter of convenience.
17–10 A major advantage of FIFO is that managers can judge the performance in the current
period independently from the performance in the preceding period.
17–11 The journal entries in process costing are basically similar to those made in job–costing
systems. The main difference is that, in process costing, there is often more than one work–in-
process account––one for each process.
17–12 Standard–cost procedures are particularly appropriate to process–costing systems where
there are various combinations of materials and operations used to make a wide variety of similar
products as in the textiles, paints, and ceramics industries. Standard–cost procedures also avoid
the intricacies involved in detailed tracking with weighted–average or FIFO methods when there
are frequent price variations over time.
17–13 There are two reasons why the accountant should distinguish between transferred–in
costs and additional direct materials costs for a particular department:
(a) All direct materials may not be added at the beginning of the department process.
(b) The control methods and responsibilities may be different for transferred–in items and
materials added in the department.
17–14 No. Transferred–in costs or previous department costs are costs incurred in a previous
department that have been charged to a subsequent department. These costs may be costs
incurred in that previous department during this accounting period or a preceding accounting
period.
17–15 Materials are only one cost item. Other items (often included in a conversion costs pool)
include labor, energy, and maintenance. If the costs of these items vary over time, this variability
can cause a difference in cost of goods sold and inventory amounts when the weighted–average
or FIFO methods are used.
A second factor is the amount of inventory on hand at the beginning or end of an
accounting period. The smaller the amount of production held in beginning or ending inventory
relative to the total number of units transferred out, the smaller the effect on operating income,
cost of goods sold, or inventory amounts from the use of weighted–average or FIFO methods.
© 2012 Pearson Education, Inc. Publishing as Prentice Hall. SM Cost Accounting 14/e by Horngren

17–3
17–16 (25 min.) Equivalent units, zero beginning inventory.
1. Direct materials cost per unit ($750,000 ÷ 10,000) $ 75.00
Conversion cost per unit ($798,000 ÷ 10,000) 79.80
Assembly Department cost per unit $154.80
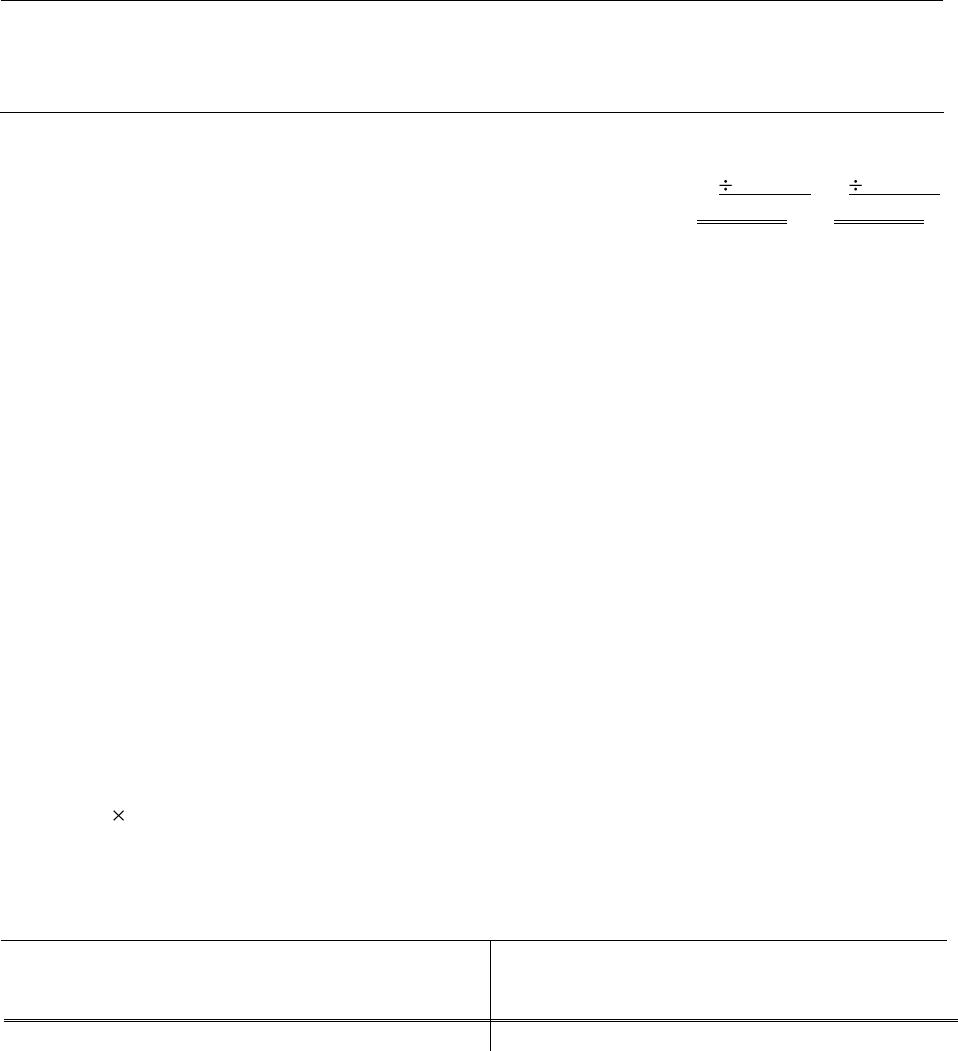
2a. Solution Exhibit 17–16A calculates the equivalent units of direct materials and conversion
costs in the Assembly Department of Nihon, Inc. in February 2012.
Solution Exhibit 17–16B computes equivalent unit costs.
2b. Direct materials cost per unit $ 75
Conversion cost per unit 84
Assembly Department cost per unit $159
3. The difference in the Assembly Department cost per unit calculated in requirements 1 and
2 arises because the costs incurred in January and February are the same but fewer equivalent
units of work are done in February relative to January. In January, all 10,000 units introduced are
fully completed resulting in 10,000 equivalent units of work done with respect to direct materials
and conversion costs. In February, of the 10,000 units introduced, 10,000 equivalent units of
work is done with respect to direct materials but only 9,500 equivalent units of work is done with
respect to conversion costs. The Assembly Department cost per unit is, therefore, higher.
SOLUTION EXHIBIT 17–16A
Steps 1 and 2: Summarize Output in Physical Units and Compute Output in Equivalent Units;
Assembly Department of Nihon, Inc. for February 2012.
(Step 2)
(Step 1)
Equivalent Units
Physical
Direct
Conversion
Flow of Production
Units
Materials
Costs
Work in process, beginning (given) 0
Started during current period (given) 10,000
To account for 10,000
Completed and transferred out
during current period 9,000 9,000 9,000
Work in process, ending* (given) 1,000
1,000 100%; 1,000 50% 1,000 500
Accounted for 10,000
Equivalent units of work done in current period 10,000 9,500
*Degree of completion in this department: direct materials, 100%; conversion costs, 50%.
© 2012 Pearson Education, Inc. Publishing as Prentice Hall. SM Cost Accounting 14/e by Horngren
17–4
SOLUTION EXHIBIT 17–16B
Compute Cost per Equivalent Unit,
Assembly Department of Nihon, Inc. for February 2012.
Total
Production
Costs
Direct
Materials
Conversion
Costs
(Step 3) Costs added during February
$1,548,000
$750,000
$798,000
Divide by equivalent units of work done
in current period (Solution Exhibit 17-l6A)
10,000
9,500
Cost per equivalent unit
$ 75
$ 84
17–17 (20 min.) Journal entries (continuation of 17–16).
1. Work in Process––Assembly 750,000
Accounts Payable 750,000
To record $750,000 of direct materials
purchased and used in production during
February 2012
2. Work in Process––Assembly 798,000
Various accounts 798,000
To record $798,000 of conversion costs
for February 2012; examples include energy,
manufacturing supplies, all manufacturing
labor, and plant depreciation
3. Work in Process––Testing 1,431,000
Work in Process––Assembly 1,431,000
To record 9,000 units completed and
transferred from Assembly to Testing
during February 2012 at
$159 9,000 units = $1,431,000
Postings to the Work in Process––Assembly account follow.
Work in Process –– Assembly Department
Beginning inventory, Feb. 1 0 3. Transferred out to
1. Direct materials 750,000 Work in Process––Testing 1,431,000
2. Conversion costs 798,000
Ending inventory, Feb. 29 117,000
© 2012 Pearson Education, Inc. Publishing as Prentice Hall. SM Cost Accounting 14/e by Horngren
17–5
17–18 (25 min.) Zero beginning inventory, materials introduced in middle of process.
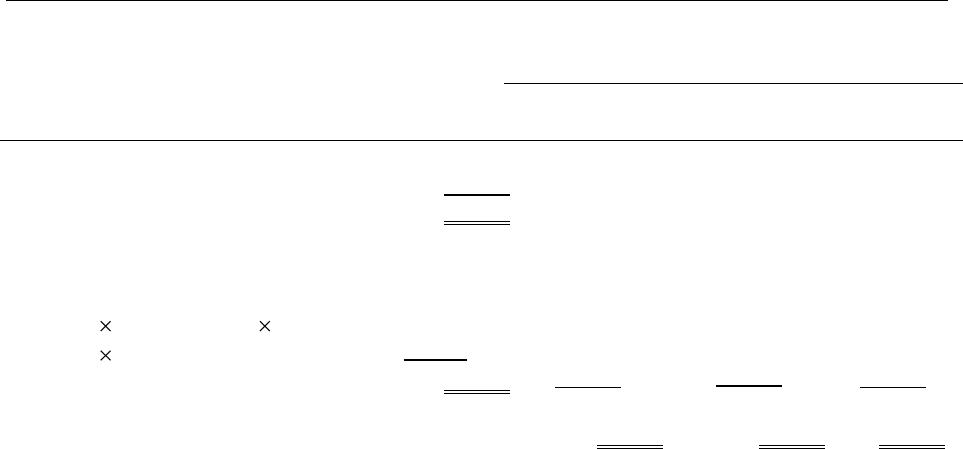
1. Solution Exhibit 17–18A shows equivalent units of work done in the current period of
Chemical P, 50,000; Chemical Q, 35,000; Conversion costs, 45,000.
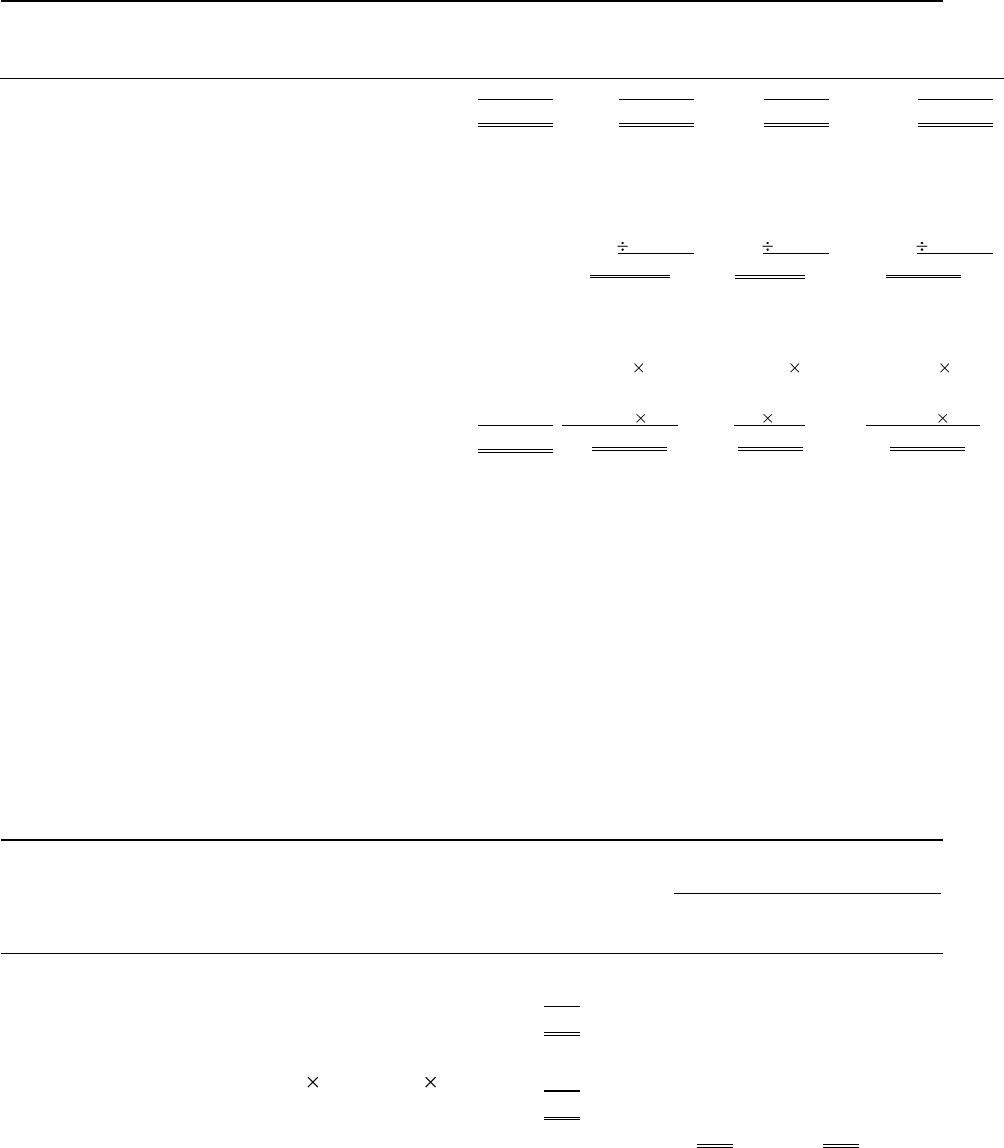
2. Solution Exhibit 17–18B summarizes the total Mixing Department costs for July 2012,
calculates cost per equivalent unit of work done in the current period for Chemical P, Chemical
Q, and Conversion costs, and assigns these costs to units completed (and transferred out) and to
units in ending work in process.
SOLUTION EXHIBIT 17–18A
Steps 1 and 2: Summarize Output in Physical Units and Compute Output in Equivalent Units;
Mixing Department of Roary Chemicals for July 2012.
(Step 1)
(Step 2)
Equivalent Units
Physical
Conversion
Flow of Production
Units
Chemical P
Chemical Q
Costs
Work in process, beginning (given) 0
Started during current period (given) 50,000
To account for 50,000
Completed and transferred out
during current period 35,000 35,000 35,000 35,000
Work in process, ending* (given) 15,000
15,000 100%; 15,000 0%;
15,000 66 2/3% 15,000 0 10,000
Accounted for 50,000
Equivalent units of work done
in current period 50,000 35,000 45,000
*Degree of completion in this department: Chemical P, 100%; Chemical Q, 0%; conversion costs, 66 2/3%.
© 2012 Pearson Education, Inc. Publishing as Prentice Hall. SM Cost Accounting 14/e by Horngren
17–6
SOLUTION EXHIBIT 17–18B
Steps 3, 4, and 5: Summarize Total Costs to Account For, Compute Cost per Equivalent Unit,
and Assign Total Costs to Units Completed and to Units in Ending Work in Process;
Mixing Department of Roary Chemicals for July 2012.
Total
Production
Costs
Chemical P
Chemical Q
Conversion
Costs
(Step 3) Costs added during July
$455,000
$250,000
$70,000
$135,000
Total costs to account for
$455,000
$250,000
$70,000
$135,000
(Step 4) Costs added in current period
$250,000
$70,000
$135,000
Divide by equivalent units of work
done in current period
(Solution Exhibit 17-l8A)
50,000
35,000
45,000
Cost per equivalent unit
$ 5
$ 2
$ 3
(Step 5) Assignment of costs:
Completed and transferred out
(35,000 units)
$350,000
(35,000* $5) + (35,000* $2) + (35,000* $3)
Work in process, ending
(15,000 units)
105,000
(15,000† $5) + (0† $2) + (10,000† $3)
Total costs accounted for
$455,000
$250,000 + $70,000 + $135,000
*Equivalent units completed and transferred out from Solution Exhibit 17–18A, Step 2.
†Equivalent units in ending work in process from Solution Exhibit 17–18A, Step 2.
17–19 (15 min.) Weighted–average method, equivalent units.
Under the weighted–average method, equivalent units are calculated as the equivalent units of
work done to date. Solution Exhibit 17–19 shows equivalent units of work done to date for the
Assembly Division of Fenton Watches, Inc., for direct materials and conversion costs.
SOLUTION EXHIBIT 17–19
Steps 1 and 2: Summarize Output in Physical Units and Compute Output in Equivalent Units;
Weighted–Average Method of Process Costing, Assembly Division of Fenton Watches, Inc., for
May 2012.
(Step 2)
(Step 1) Equivalent Units
Physical Direct Conversion
Flow of Production Units Materials Costs
Work in process beginning (given) 80
Started during current period (given) 500
To account for 580
Completed and transferred out during current period 460 460 460
Work in process, ending* (120 60%; 120 30%) 120 72 36
Accounted for 580 ___ ___
Equivalent units of work done to date 532 496
*Degree of completion in this department: direct materials, 60%; conversion costs, 30%.
© 2012 Pearson Education, Inc. Publishing as Prentice Hall. SM Cost Accounting 14/e by Horngren
17–20 (20 min.) Weighted–average method, assigning costs (continuation of 17–19).
Solution Exhibit 17–20 summarizes total costs to account for, calculates cost per equivalent unit
of work done to date in the Assembly Division of Fenton Watches, Inc., and assigns costs to
units completed and to units in ending work–in–process inventory.
SOLUTION EXHIBIT 17–20
Steps 3, 4, and 5: Summarize Total Costs to Account For, Compute Cost per Equivalent Unit,
and Assign Total Costs to Units Completed and to Units in Ending Work in Process;
Weighted–Average Method of Process Costing, Assembly Division of Fenton Watches, Inc., for
May 2012.
Total
Production
Costs
Direct
Materials
Conversion
Costs
(Step 3) Work in process, beginning (given)
$ 584,400
$ 493,360
$ 91,040
Costs added in current period (given)
4,612,000
3,220,000
1,392,000