Financial Institutions
Management II
Small Group Discovery Experience
Isabella Lowe
Page 2 of 31
Table of Contents
MOTIVATION FOR CHOOSING BANKS ………………………………………………………….. 3
ASSET AND LIABILITY SUMMARY …………………………………………………………………. 4
OCBC ASSET COMPOSITION ………………………………………………………………………………….. 4
ANZ ASSET COMPOSITION ……………………………………………………………………………………… 6
OCBC LIABILITY COMPOSITION …………………………………………………………………………….. 7
ANZ LIABILITY COMPOSITION ………………………………………………………………………………… 8
COMPARISON OF ASSET AND LIABILITY COMPOSITIONS ………………….. 10
HOW GLOBAL FINANCIAL CRISIS AND EUROPEAN DEBT CRISIS HAVE
AFFECTED BANKS ……………………………………………………………………………………………………10
IMPACTS OF GLOBAL FINANCIAL CRISIS ON ASSETS AND LIABILITIES
FOR OCBC AND ANZ ………………………………………………………………………………………………..10
CHANGES IN PROFITABILITY (RETURN ON EQUITY) …………………………..… 12
SOURCES OF THE CHANGES IN RETURN ON EQUITY FOR OCBC …….. 13
SOURCES OF THE CHANGES IN RETURN ON EQUITY FOR ANZ ………… 16
AFFECT OF THE GLOBAL FINANCIAL CRISIS AND EUROPEAN DEBT
CRISIS ON OCBC AND ANZ PROFITABILITY …………………………………………….. 19
DERIVATIVES USED BY ANZ ………………………………………………………………………… 21
DERIVATIVES USED BY OCBC …………………………………………………………………….. 24
IMPACT OF THE GLOBAL FINANCIAL CRISIS ON DERIVATIVES ………… 26

Page 3 of 31
PART I: ASSET AND LIABILITY
COMPOSITION
MOTIVATION FOR CHOOSING BANKS
The banks chosen for this exercise was Australian-based bank ANZ and
Singapore-based bank OCBC. We chose ANZ and OCBC initially because they
are both large, dominant banks in their regions. ANZ was specifically chosen
as in Australia there are few large commercial banks, in comparison to
Singapore, and as a result they have more power in determining interest rates.
Whereas, in Singapore the banking market is more competitive, and as a result
banks commercial banks, such as OCBC, are less likely to affect interest rates,
therefore, they need to focus more on adjusting their interest rates to suit
current market rates. It was believed that an interesting point of comparison
could be drawn from these banks for the 2008 to 2013 period as they are both
large commercial banks, but have different abilities in their markets.
Page 4 of 31
ASSET AND LIABILITY SUMMARY
OCBC ASSET COMPOSITION
OCBC’s customers are 65% in Singapore, 20% in Malaysia, 4% other ASEAN
countries 9% and 2% the rest of the world. Hence it won’t be expected for it to
be affected too heavily by the GFC or Eurozone crisis. This can be seen through
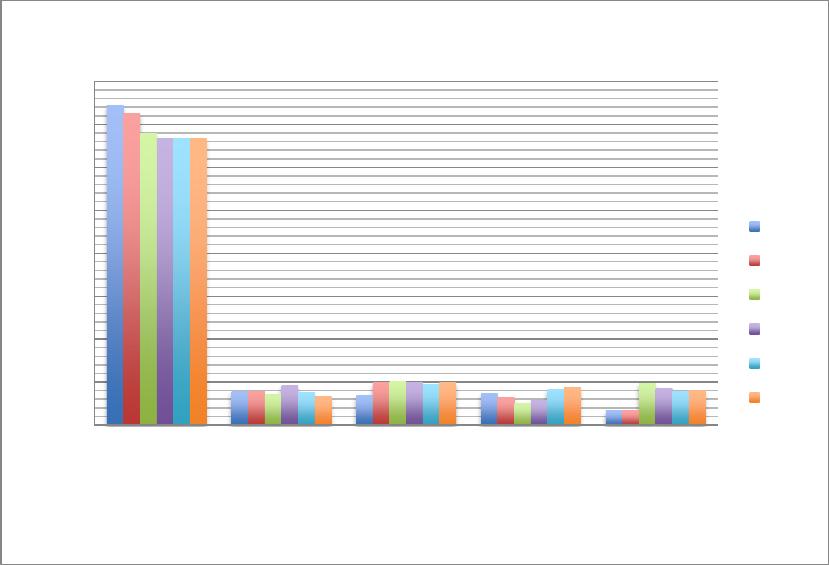
the fact that the total assets for OCBC increase from 2008 to 2013. OCBC’s
major asset was their loans and bills receivable. This is due to banks general
ability to earn more interest on be the reasons as to why it is consistently the
largest asset for the bank from 2008 to 2013. The value of the Loans and bills
receivable decreases slightly in 2009 and this could be as OCBC was
recovering from defaulted loans due to the 2008 GFC.
The Commonwealth
0
10
20
30
40
50
60
Loans and
bills
receivable
Placements
with the loans
to banks
Debt and
equity
securities
Singapore
Government
treasury bills
and securities
Others
%
Figure 1: OCBC asset composition
2008
2009
2010
2011
2012
2013
Page 5 of 31
2%
8%
21%
24%
9%
7%
14%
9%
6%
Figure 2: Loans by industry (2008)
Agriculture, mining and
quarrying
Manufacturing
Building and construction
Housing
General Commerce
Transport, storage and
communication
2%
7%
19%
26%
9%
7%
12%
10%
8%
Figure 3: Loans by industry (2009)
Agriculture, mining and
quarrying
Manufacturing
Building and construction
Housing
General Commerce
Transport, storage and
communication
Financial institutions,
investment and holding
companies
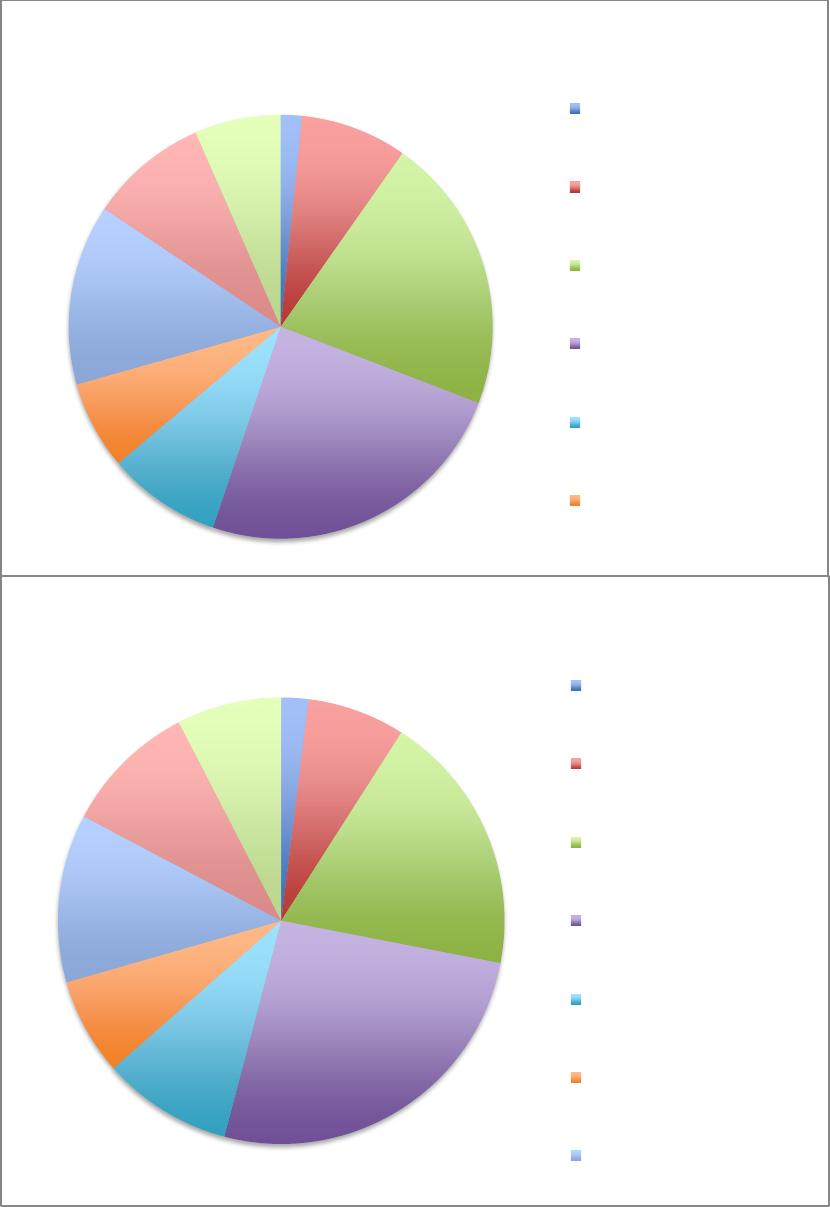
After breaking down the Loans by industry, it can be seen that a large proportion
of it is Building and construction, and Housing. The decrease shows that OCBC
was trying to reduce exposure during the GFC, as risks would have increased.
The increase of total loans in 2011 reveals that OCBC was not heavily affected
by the Eurozone crisis. This could be explained through the bank choosing not
to place its assets into the foreign exchange market, and thus not being directly
affected by the GFC, nor the Eurozone crisis. This in return assured their
clientele of their strength through the crisis’ and meant that they did not
withdraw their funds, stabilising the bank.
OCBC’s second major asset is placements with loans to banks which in total
also increases from 2008 to 2013. It does have a very solid asset base, and
thus more assets that they are able to lend to other financial insitutions.
OCBC’s third major asset is debt and equity securities but changes to cash and
placements with central banks in 2009 and 2012. This could be a response to
the GFC and the European crisis. This could be OCBC’s precaution as debt
and equity securities are considered riskier. A corporation can default on bond
interest payments and so could the government if it did not have enough cash
on hand. Which was a potential outcome during the crisis.
ANZ ASSET COMPOSITION
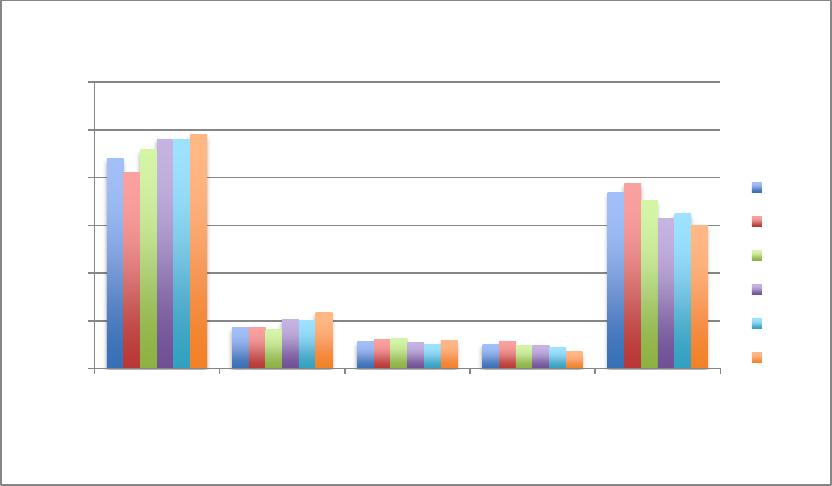
ANZ’s major asset was their loans and advances. This is due to banks general
ability to earn more interest on these loans and advances, as customers need
to pay on these deposits. This could reveal why it is consistently the largest
0
10
20
30
40
50
60
70
80
Net loans and
advances
including
acceptances.
Derivative
financial
instruments.
Trading and
available for
sale assets.
Liquid
assets/due
from other
financial
institutions.
Other
%
Figure 4: ANZ asset composition
2008
2009
2010
2011
2012
2013
asset for ANZ from 2008 to 2013. The proportion of net loans and advances
dipped in 2009, this could be as ANZ was recovering from defaulted loans due
to the 2008 GFC. However, in 2011 the proportion stabilised due to an increase
in the net loans and advances made, which could reveal that ANZ was not
heavily affected by the Eurozone crisis.
In 2008, the second largest asset for ANZ was their derivative financial
instruments, while from 2009 it was trading available for sale assets. The
change in 2008 could have been due to changing derivatives that were
adjusting to the change in interest rates and foreign exchange rates as a result
of the GFC.
The effect of the GFC up on the interest rates as well as the foreign exchange
rates. Another reason could be that following the GFC and with the lack of
market stability, the Commonwealth Bank realised that It would be more
profitable to grip onto their assets longer.
In 2009 to 2013 trading and available for sale assets were the second greatest
asset for ANZ. This could have been a result of the GFC where ANZ decided
that in 2008 it would be beneficial for them to hold onto their assets longer, or
until maturity, or to sell them while they could. This is due to the lack of stability
and large market fluctuations at the time. In 2013 the third largest asset was
liquid assets/due from other financial institutions, this differs from 2009-2012
and it could be that ANZ were attempting to immunise themselves against
liquidity risk. This would have been done through constructing a portfolio of
liquid assets, with the intention to protect against day–to-day fluctuations in