PAPER NO: 991109
PREPRINT
Duplication of this preprint for publication or sale is strictly prohibited
without prior written permission of the Transportation Research Board
FACTORS INFLUENCING BICYCLE CRASH SEVERITY
ON TWO-LANE UNDIVIDED ROADWAYS IN NORTH CAROLINA
Jeremy R. Klop
Department of City and Regional Planning
3140 New East Building
University of North Carolina
Chapel Hill, NC 27599
Tel (919) 969-6630, Fax (919) 932-3705,
Email klop@email.unc.edu
http://www.unc.edu/~klop
Asad J. Khattak
Department of City and Regional Planning
3140 New East Building
University of North Carolina
Chapel Hill, NC 27599
Tel (919) 962-4760, Fax (919) 962-5206
Email khattak@email.unc.edu
http://www.unc.edu/~khattak/res951.htm
November 15, 1998
Transportation Research Board
78th Annual Meeting
January 10-14, 1999
Washington, D.C.
Klop & Khattak
2
Factors Influencing Bicycle Crash Severity
on Two-lane Undivided Roadways in North Carolina
Jeremy R. Klop
Department of City and Regional Planning, University of North Carolina at Chapel Hill
Asad J. Khattak
Department of City and Regional Planning, University of North Carolina at Chapel Hill
ABSTRACT
Concern over crashes involving bicycles and motor vehicles is largely due to the
severity of injuries. This research examines the impacts of physical and
environmental factors on the severity of injury to bicyclists. North Carolina
Highway Safety Information System (HSIS) crash and inventory data for state-
controlled two-lane undivided roadways are analyzed. The injury severity
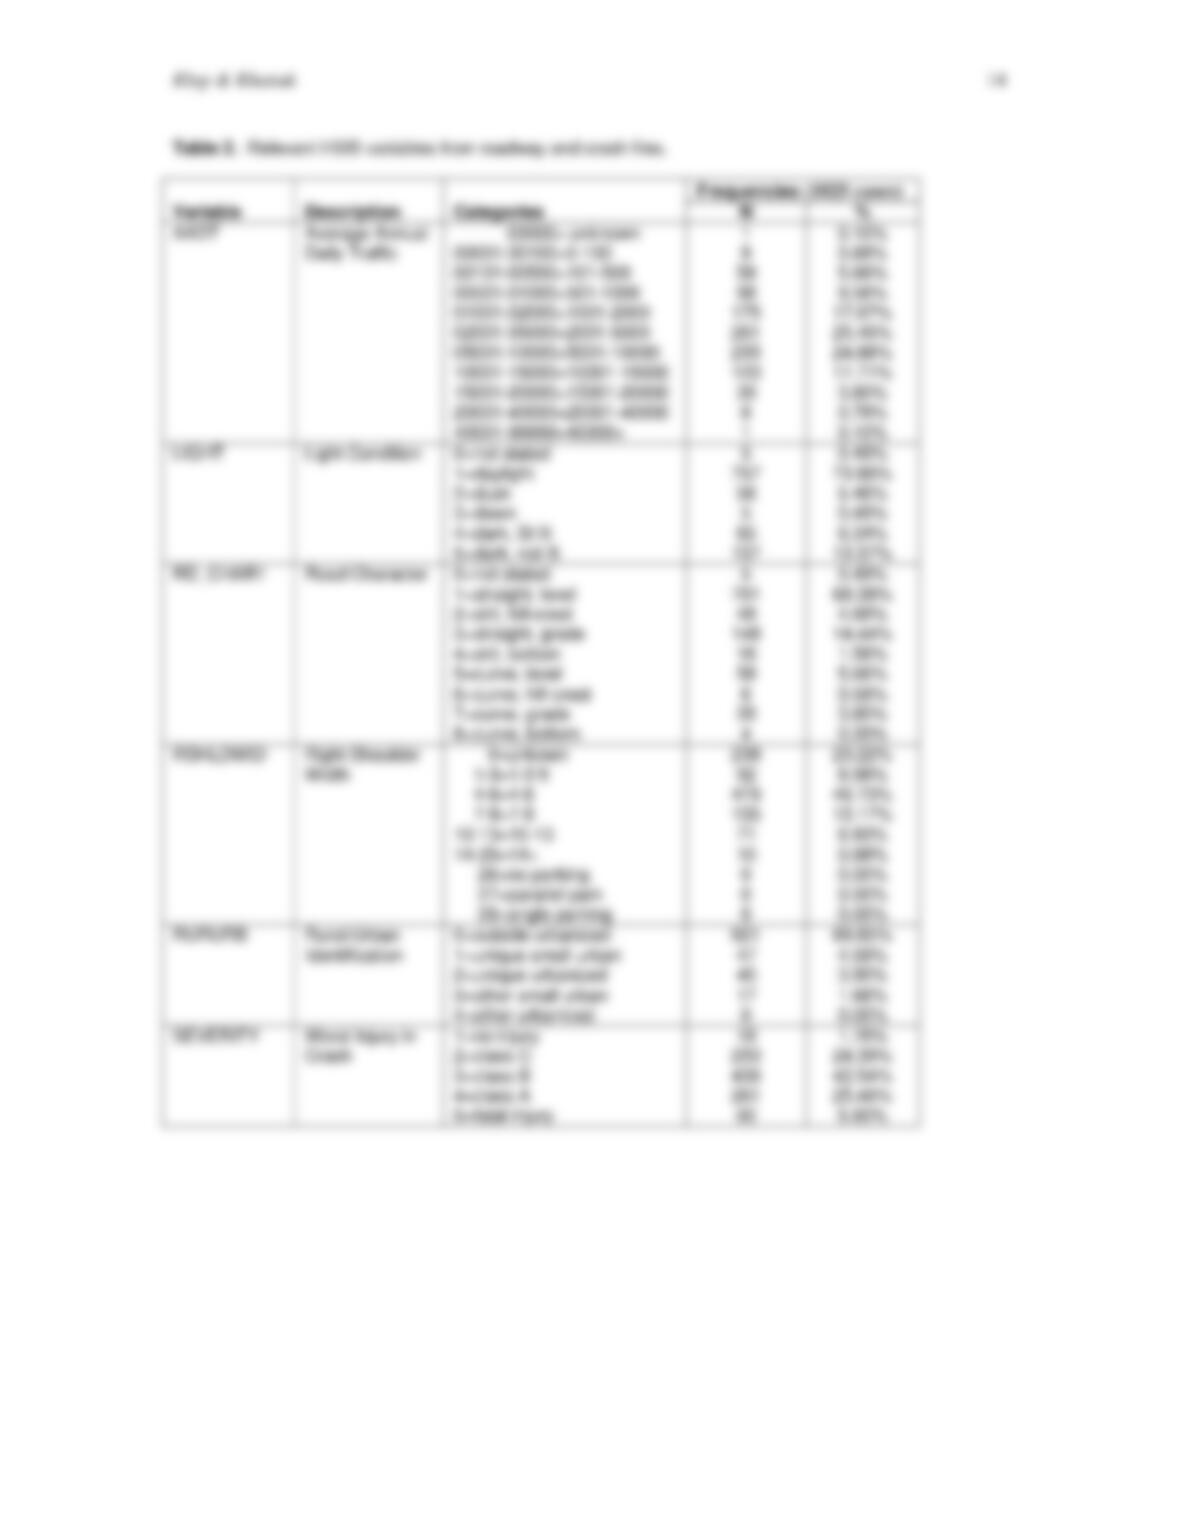
distribution, measured on the KABCO scale, is as follows: no injury 1.8%;
complaint of pain 24.4%; non-incapacitating injury 42.5%; incapacitating injury
25.5%; and fatal injury 5.9%. The total number of involvements in this dataset
was 1025 with a majority of the involvements occurring outside urbanized areas
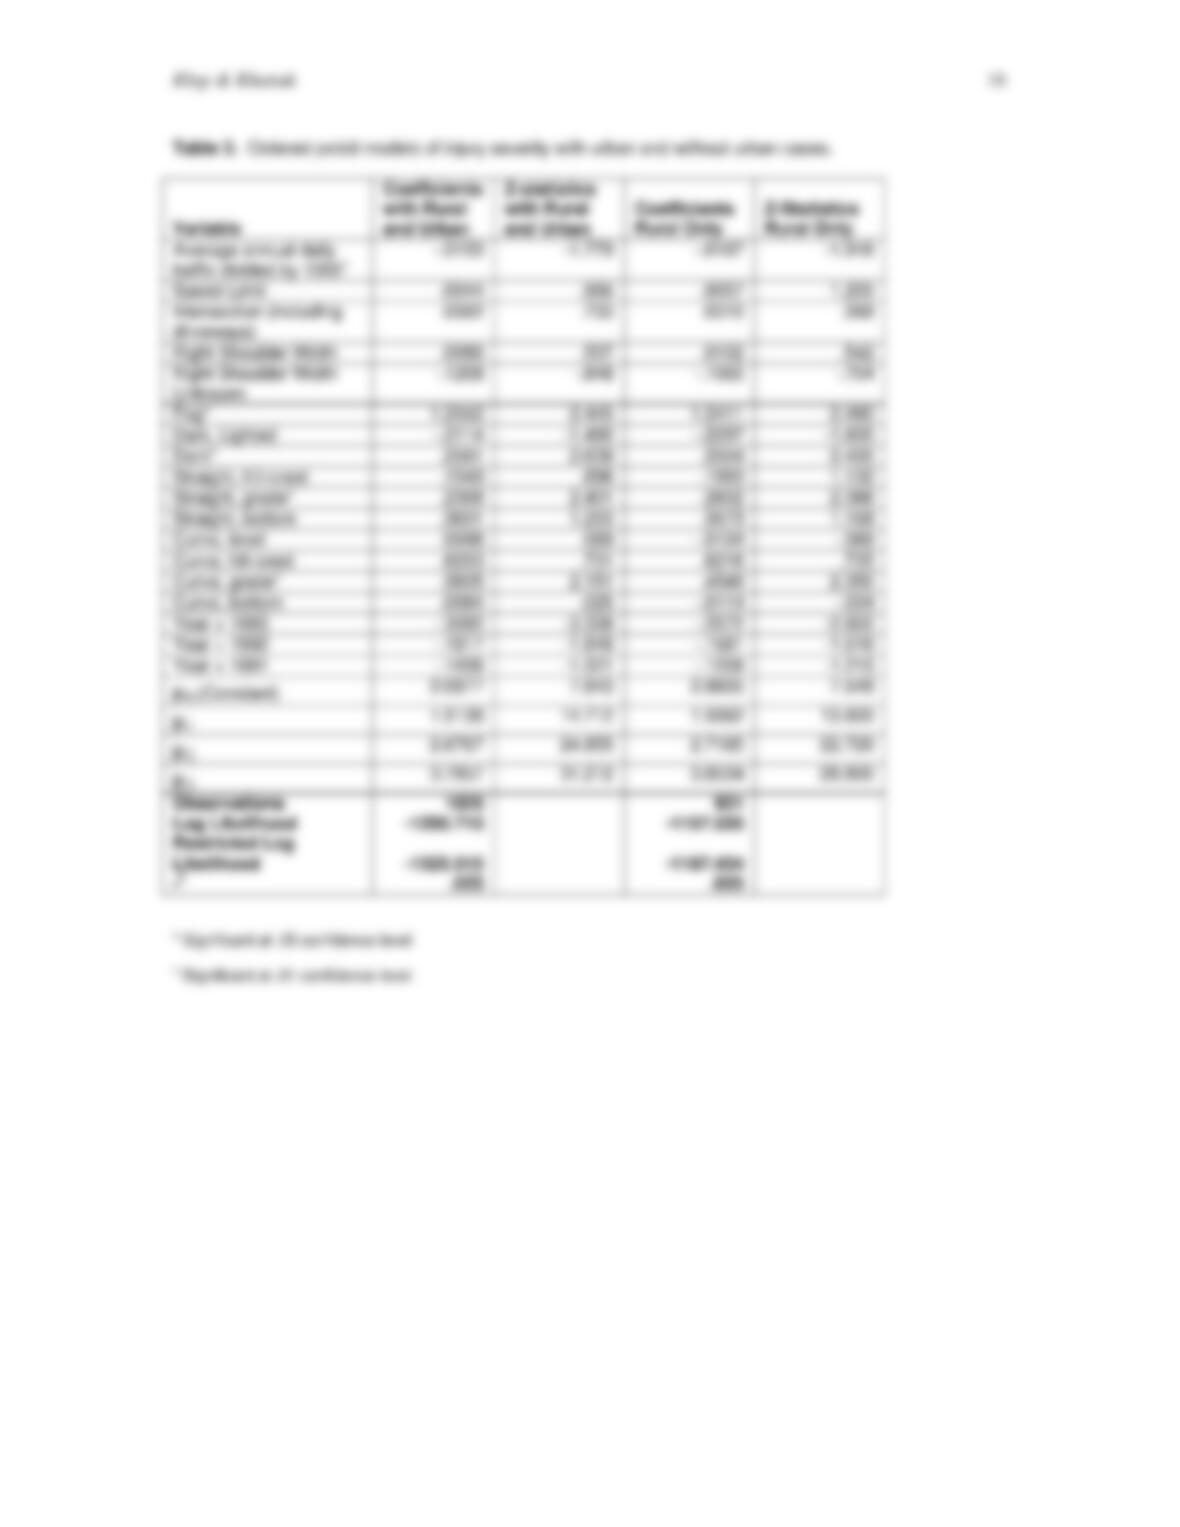
(80.5%). Using the ordered probit model, the effect of a set of roadway,
environmental, and crash variables on injury severity is explored. Variables that
significantly increase injury severity include straight grades, curved grades,
darkness, and fog. Higher average annual daily traffic was the only variable
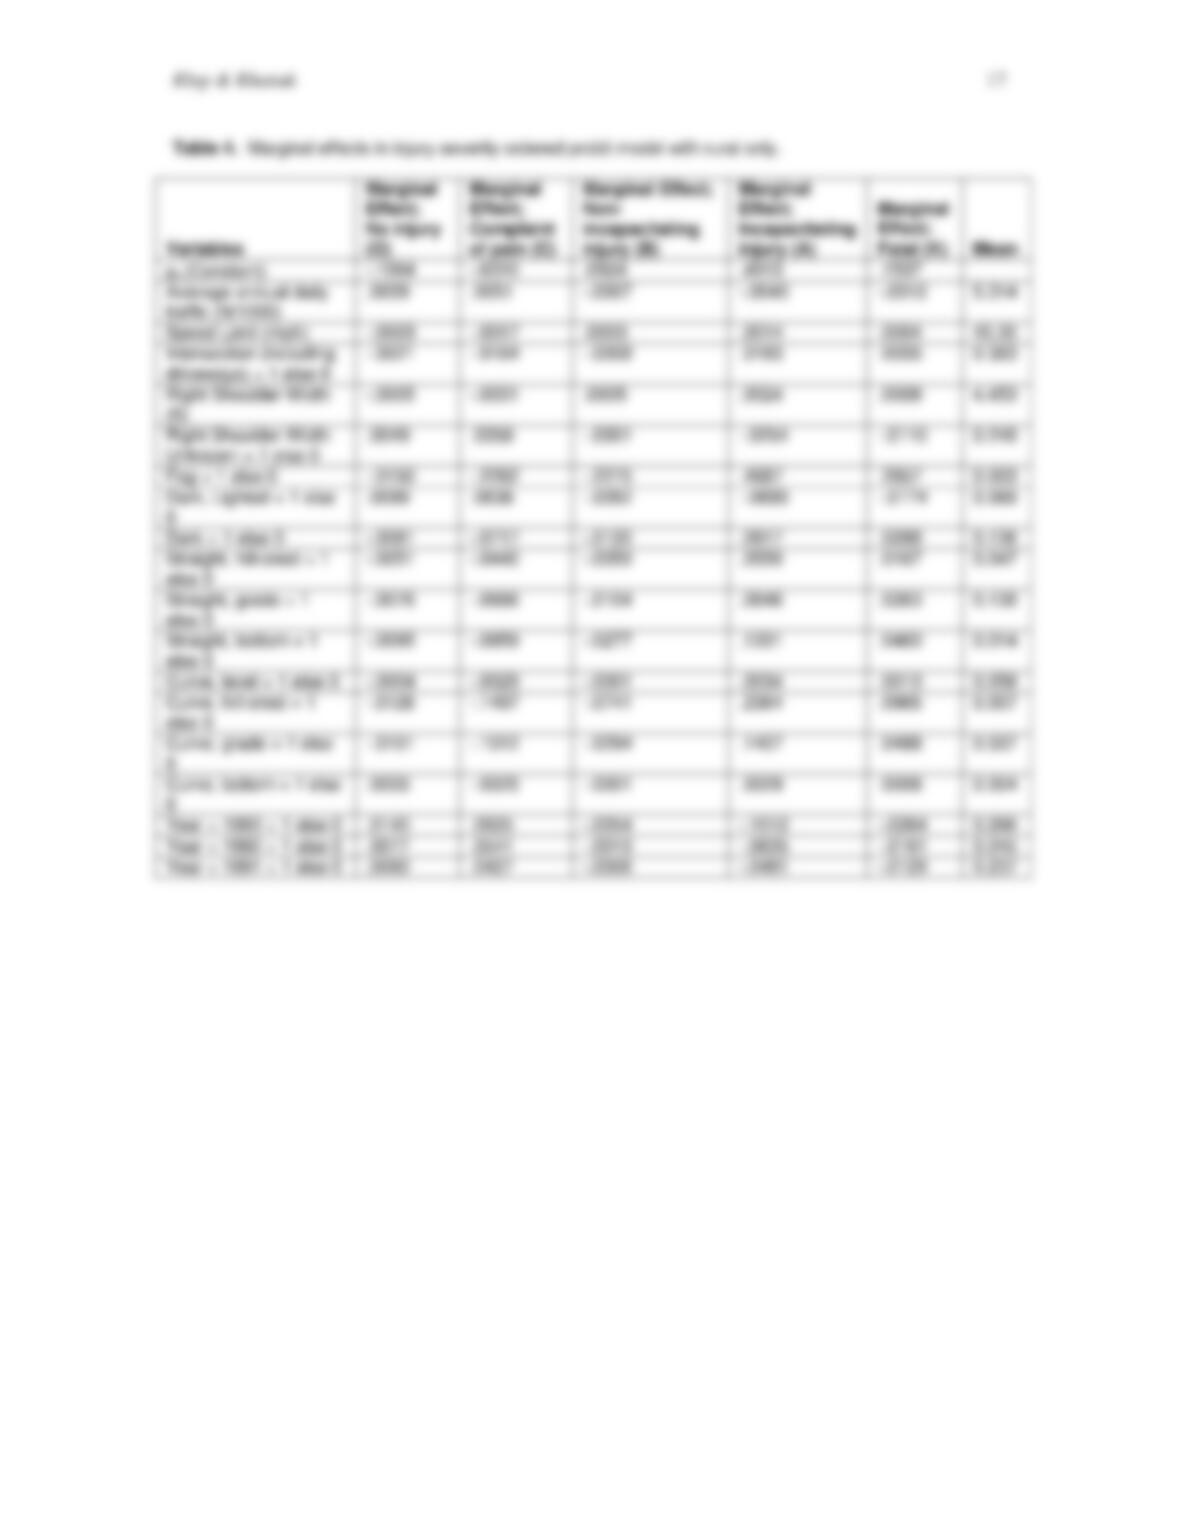
associated with lower injury severity. Separate models are estimated for rural and
urban locations. Marginal effects of each factor on the likelihood of each injury
severity class are reported. Policy implications and possible countermeasures are
then discussed.
KEYWORDS: Injury Severity, bicycle crashes, ordered probit model, North
Carolina
Klop & Khattak
3
INTRODUCTION
While in the U.S. only 2% of all motor vehicle deaths are bicyclists, 813 bicyclists were
killed in crashes in 1997 alone (1). Urban areas have received the most attention in the
literature, but 36% of all national fatalities occurred in rural areas in 1997 (1). The
interaction between motorists and cyclists on public roadways has been the subject of
increased policy debate in the years following the passage of the ISTEA legislation. An
important component of this discussion relates to cyclist safety and reducing the risk of
injury to users of this mode. While work has been done to describe crash types and the
characteristics of the roadway, vehicles, and persons involved in crashes, analysis of the
factors influencing injury severity is scarce. Because of the complex nature of motor
vehicle/bicycle crashes, understanding the specific factors and their relative influence on
levels of injury severity is useful. This can be accomplished using ordered probability
models, given that injury severity is measured on the KABCO scale in police reports. As
transportation planners and engineers have opportunities to improve facilities to serve
alternate mode choices such as bicycles, this analysis can be especially useful in the
selection and design of facilities which will not only seek to reduce crash incidence, but
also injury severity.
This analysis seeks to examine the influence of roadway and crash variables on
injury severity in motor vehicle/bicycle crashes on state-controlled two-lane roadways in
North Carolina from 1990-1993. Over the four years examined in this dataset, 60
bicyclists were killed in North Carolina, and 947 were injured in police reported motor
vehicle/bicycle crashes. Additionally, North Carolina maintains a system of State Bicycle
Routes of over 2,250 miles, 90-95% of which is on two-lane undivided roadways in rural
areas (2). Relatively good quality data related to the crashes on these roadways was
available from The Federal Highway Administration’s HSIS (Highway Safety
Information System) database, which is used for analysis. The North Carolina Division
of Highways maintains a particularly extensive roadway inventory system for 77,000
miles of roadway, representing a very high proportion of the total mileage existing in the
92,000 state miles. Approximately 34,800 have been entered into a computer
mileposting system, so crashes can be linked to them (3). Also there are no county
maintained roadways in North Carolina, so most rural roadways are contained in the
dataset used in this study.
LITERATURE REVIEW
The definitive early work in the field of bicycle safety by Cross and Fisher (4) served to
identify crash types and median ages of the cyclists involved and the severity of injury
(fatal or non-fatal) in each crash type. The results were especially useful in targeting
educational programs toward age groups that were over-represented in certain crash
types. Additional Federal research in the early 1980s focused on cyclist behavior,
analysis of specific crash types such as right-turn-on-red situations, and development of
countermeasures (5,6,7,8). Stutts and Hunter (9) review these efforts as well as a
considerable number of safety education efforts undertaken both by Non-Governmental
Organizations and a number of States in the 1980s.
Klop & Khattak
4
Considerable work has been done by the FHWA to compile descriptive statistics
on both pedestrian and bicycle crash types. In a FHWA-sponsored report on Pedestrian
and Bicycle Crash Types of the Early 1990’s (10), Hunter et al., analyzed hard copies for
3000 bicycle/motor vehicle crashes from six states and linked 2,990 of them with
computerized state police report files. The major findings are as follows. Intersections,
driveways and other junctions account for three fourths of all crashes. The under 15 ages
are over-represented and older adults 25-44 and 65+ are underrepresented in crashes, but
44+ are over-represented in fatalities. 18% of all bicycle involvements are serious or fatal
(A+K). Alcohol or drug use is present in about 5% of crashes overall, but is 15% for the
25-44 group, and is more frequent on weekends and hours of darkness. Two-thirds of the
involvements occur during late afternoon and early evening (exposure is quite high and
visibility can be a problem during these times). Two-thirds of the involvements are
urban, and 7% are on private property. Ages 10 and under are over-represented in
driveways, alleys and parking lots. About 60% of the involvements occur on two-lane
roadways while roads with narrower lanes and higher speed limits are associated with
more than their share of serious and fatal injuries to bicyclists.
Research related to facility location, selection, and design for bicyclists is still
developing. The 1984 AASHTO “Green Book” (11) recommends paved shoulders, wide
outside traffic lanes (15ft minimum), bicycle-safe drain grates, and maintenance of
smooth, clean riding surfaces. More specific guidelines are available in the 1991
AASHTO “Guide for the Development of New Bicycle Facilities” (12). Regarding lane
widths, McHenry and Wallace (13) found that in multi-lane highways, optimal lane width
was greater than 13 ft 8 in., and less than 17 ft. A 1994 FHWA-sponsored study tour of
England, Germany, and the Netherlands examined pedestrian and bicyclist safety
conditions (14). They found that reduced vehicle speeds were of major importance to
bicyclist and pedestrian safety, in addition to restricted traffic movement and reduced
travel distances. Specific facility related bicycle safety measures are also discussed,
though primarily in an urban context.
Relevant exposure data are often not available, and there is a clear need for
collecting such data in bicycle safety research. In a recent paper examining exposure and
safety on roads, off-road paths, and sidewalks, Aultman-Hall and Hall found that the rate
of major injuries was highest on sidewalks and off-road paths, compared to on-road
cycling (15). The analysis also demonstrates one method for quantifying bicycle travel
exposure rates. Assessing the level of risk associated with particular locations, behaviors,
and conditions is difficult without information about how many cyclists are uninjured as
well as injured. This analysis will focus on factors influencing severity once a crash
occurs.
DATA DESCRIPTION & HYPOTHESES
In this study, it is assumed that for crashes involving a motor vehicle and a bicycle, the
cyclist is more severely injured (98% of drivers sustained no injury in the 2,990 cases
examined by the FHWA Pedestrian and Bicycle Crash Types of the Early 1990’s). The
significant difference in mass between the motor vehicle and the bicycle, as well as the
protection afforded the motorist by the physical structure of the vehicle also contribute to
Klop & Khattak
5
increased injury severity for the cyclist compared to the motorist. Therefore, the severity
variable, representing the worst injury in the crash, is assumed to refer to the cyclist.
Roadway and environmental factors as well as individual, vehicle, and bicycle
factors drive the collision process. During a crash event, the energy transfer determines
injury severity in the collision and possible fall from the bicycle, along with the medical
care that is subsequently administered. Reaction times of both the motorist and the
cyclist, perceptual and judgement errors, and attention also affect the collision process.
Information processing of both the cyclist and the driver, the care that some drivers use
when near bicyclists, and the risk taking behaviors by both the motorist and bicyclist may
also increase or decrease injury severity.
While the literature classifies over 80 crash types (10), the HSIS data set used for
this analysis does not disaggregate by crash type. Additionally, in this dataset, no
information is collected on bicycle characteristics, and individual characteristics are
limited to age, gender, and race on the crash reporting form. However, detailed
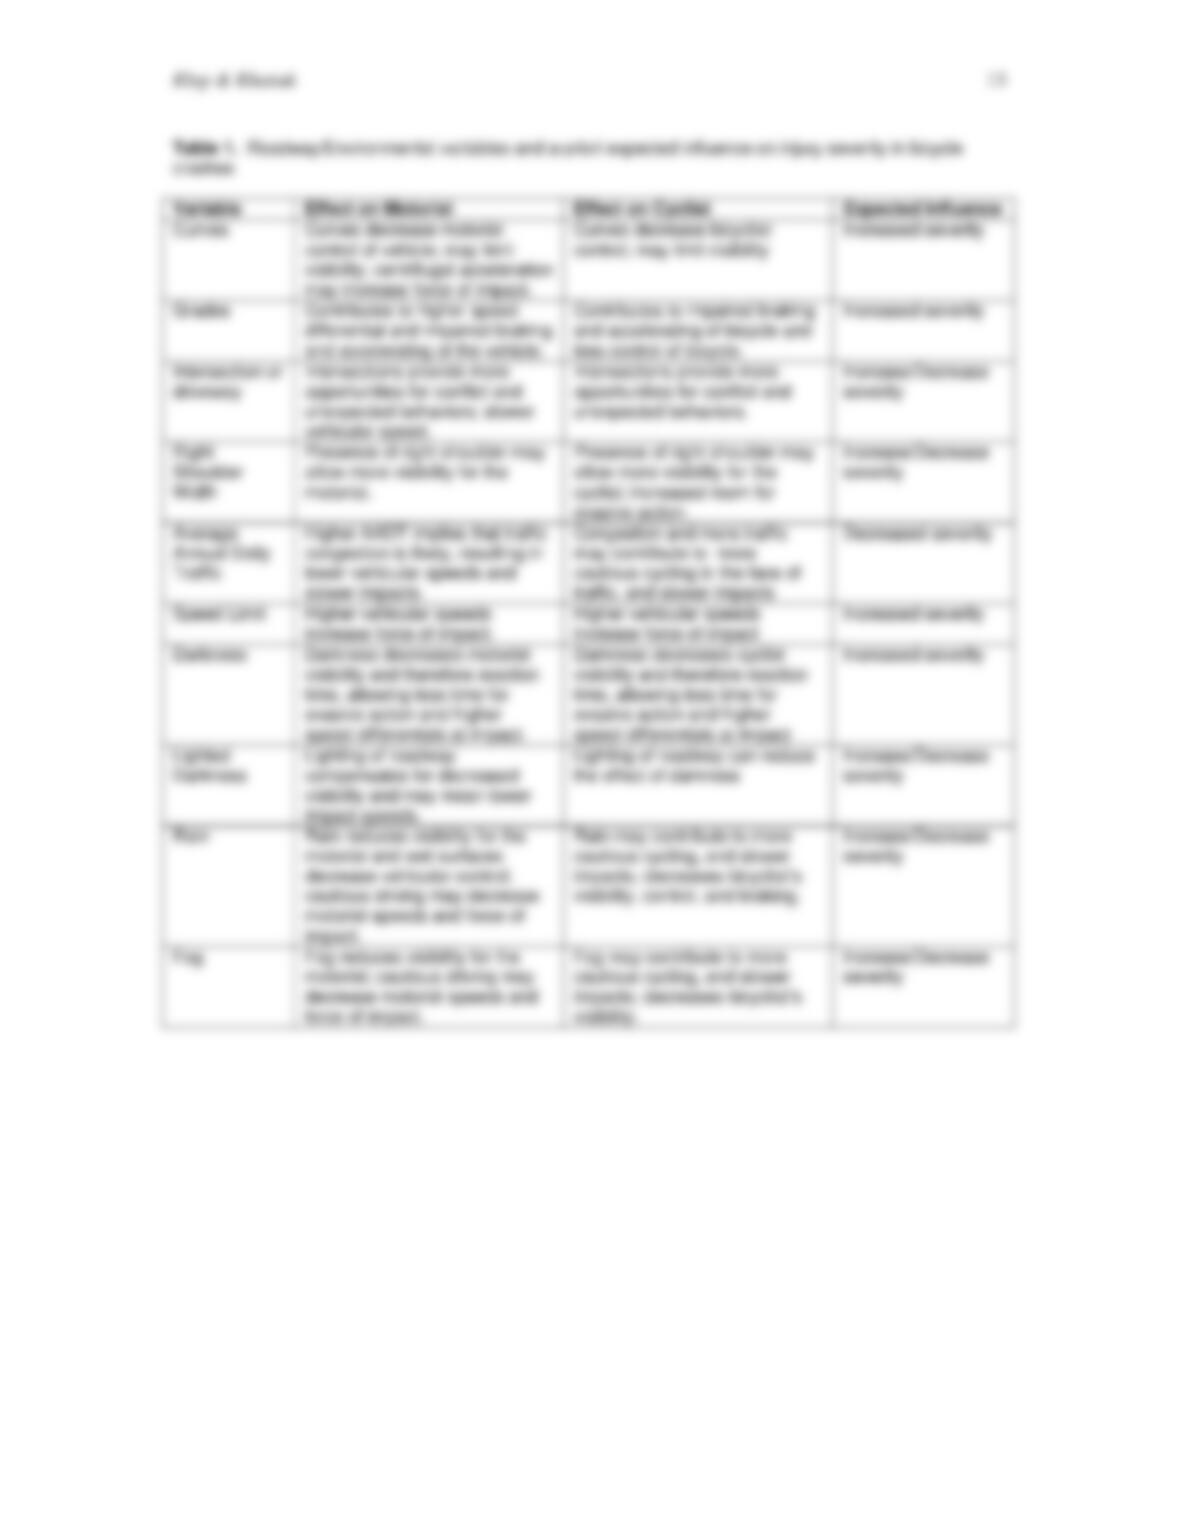
information about roadway and environmental characteristics is gathered for all crashes.
The severity of injury is expected to increase with the motorist’s lack of awareness of the
cyclist and inability to maneuver because of roadway or environmental characteristics.
Additionally, while driver and cyclist characteristics, as well as vehicle characteristics
may contribute to increased or decreased severity, this analysis is limited to physical and
environmental characteristics. Since the roadway characteristics are policy sensitive, they