SDG Index and Dashboards
Detailed Methodological paper
September 2018
Guillaume Lafortune, Grayson Fuller, Jorge Moreno, Guido Schmidt-Traub, Christian Kroll
2
TABLE OF CONTENTS
INTRODUCTION ………………………………………………………………………………………………………………………………………… 4
1. GENERAL APPROACH ………………………………………………………………………………………………………………………….. 5
1.1 Objective …………………………………………………………………………………………………………………………………………. 5
1.2 Conceptual framework …………………………..…………………………………………………………………………………………. 5
1.3 Fundamental assumptions ………………………………………………………………………………………………………………... 6
1.4 Selection of indicator ………………………………………………………………………………………………………………………… 7
1.5 Interpreting the SDG Index and Dashboards results ……………………………………………………………………………… 8
1.5.1 The SDG Index ……………………………………………………………………………………………………………………………. 8
1.5.2 The SDG Dashboards ………………………………………………………………………………………………………………….. 8
1.5.3 The SDG Trend Dashboard …………………………………………………………………………………………………………… 9
1.6 Setting indicator targets ………………………………………………………………………………………………………………….. 10
1.7 Collaboration with experts ………………………………………………………………………………………………………………. 12
2. DATA QUALITY AND COVERAGE …………………………………………………………………………………………………………. 14
2.1 Number of indicators ……………………………………………………….……………………………………………………………… 14
2.2 Data sources ………………………………………………………………………………………………………………………………….. 14
2.3 Year of reference ……………………………………………………………………………………………………………………………. 16
2.4 Missing data …………………………………………………………………………………………………………………………………… 17
2.4.1 Imputations and data coverage ………………………………………………………………………………………………….. 17
2.4.2 Major indicator and data gaps for the SDGs ………………………………………………………………………………… 18
2.5 Calculating Index scores ………………………………………………………………………………………………………………….. 19
2.5.1 Outliers …………………………………………………………………………………………………………………………………… 19
2.5.2 Normalization ………………………………………………………………………………………………………………………….. 19
2.5.3 Weights …………………………………………………………………………………………………………………………………… 20
2.5.4 Aggregation …………………………………………………………………………………………………………………………….. 23
3. STATISTICAL SOUNDNESS ………………………………………………………………………………………………………………….. 25
3.1 Collinearity/redundancy ………………………………………………………………………………………………………………….. 25
3.2 Inter-item correlations within goals ………………………………………………………………………………………………….. 26
3.3 Sensitivity/robustness tests ……………………………………………………………………………………………………………… 27
Annexes …………………………………………………………………………………………………………………………………………………. 29
Annex 1: List of trend indicators …………………………………………………………………………………………………………….. 29
Annex 2: List of countries not included in the 2018 SDG Index due to insufficient data availability ………………… 31
Annex 3: Summary statistics for indicators included in the 2018 SDG Index and Dashboards………………………… 32
Annex 4: Indicator targets and thresholds ………………………………………………………………………………………………. 34
Annex 5 : Sensitivity tests – using exact same indicators for all countries …………………………………………………… 37
3
Annex 6: Monte Carlo Simulations …………………………………………………………………………………………………………. 40
Annex 7: Statistical clustering of the goals (exploratory) …………………………………………………………………………… 56

4
INTRODUCTION
This methodological paper is a companion to the SDG Index and Dashboards Report produced annually since 2016
by the Bertelsmann Stiftung and the Sustainable Development Solutions Network (SDSN). The SDG Index and
Dashboards Report benchmarks the performance of countries on the Sustainable Development Goals (SDGs)
adopted in September 2015 by the global community. In the 2018 edition, country profiles are generated for all
193 member states but total country scores and ranks are available for 156 countries. 37 countries did not meet
the thresholds in terms of data availability to be considered for inclusion in the total rankings and scores.
Key findings from the 2018 edition are described in the report including insights by region and a detailed analysis
of G20 implementation efforts. In addition, a data visualisation tool has been developed allowing users to compare
rapidly their country results to others (https://dashboards.sdgindex.org/#/). Additional monitoring tools and
analyses have been developed by SDSN for Africa (https://sdgcafrica.org/reports) and cities in the United-States
(http://unsdsn.org/resources/publications/leaving-no-u-s-city-behind-the-2018-u-s-cities-sdgs-index/) using a
similar approach and methodology.
The purpose of this methodological paper is threefold: First, it describes the objectives and content of the 2018
Global SDG Index and Dashboards Report and highlights how to interpret results. Second, it provides more detailed
information on the underlying metrics used including data sources and coverage and describes the rationale for key
methodological choices such as weighting and aggregation techniques. Third, it presents the results from various
robustness tests derived from the suggested tests included in the JRC-OECD Handbook on Constructing Composite
Indicators.
Any comments can be addressed to info@sdgindex.org or directly to guillaume.lafortune@unsdsn.org.
5
1. GENERAL APPROACH
1.1 Objective
In September 2015, global leaders adopted the new 2030 Agenda for Sustainable Development, including the
Sustainable Development Goals (SDGs). The 17 new Sustainable Development Goals, also known as the Global
Goals, aim to end poverty, hunger and inequality, take action on climate change and the environment, improve
access to health and education, build strong institutions and partnerships, and more. Compared to its processor,
the Millennium Development Goals (MDGs), the SDGs to all 193 UN Member States and therefore both to
developing and developed countries alike.
Good data and clear metrics are critical for each country to take stock of where it stands, devise pathways for
achieving the goals and track progress. The UN Statistical Commission has recommended a first set of 230 global
indicators to measure achievement of the SDGs, but many suggested indicators lack comprehensive, cross-country
data and some even lack agreed statistical definitions. More and better data are needed, but it will take years to
build the necessary statistical systems even if adequate resources were mobilized, which is currently not the case.
Some governments have begun voluntary national reviews of progress on the SDGs, but they use indicators that
are not harmonized internationally and lack comparability.
In order to assist countries in measuring their SDG baselines and to measure future progress, the Bertelsmann
Stiftung and the Sustainable Development Solutions Network (SDSN) jointly released the first SDG Index and
Dashboards in July 2016. This report aims to achieve four main objectives:
1. Establish SDGs as a useful, operational tool for policy action.
2. Support national debates on prioritization and formulation of SDG implementation strategies.
3. Complement efforts to develop a robust SDG monitoring framework by the UN Statistical Commission.
4. Identify SDG data gaps, need for investments in statistical capacity and research, and new forms of data.
The SDG Index and Dashboards is not officially endorsed by the UN National Assembly.
1.2 Conceptual framework
The conceptual framework corresponds to the 17 Sustainable Development Goals adopted by global leaders at the
United-Nations General Assembly in September 2015. The 17 SDGs include 169 more specific targets and means
for implementation.
Table 1: The 17 Sustainable Development Goals
SDG
Short title
Description
#Targets
SDG 1
No poverty
End poverty in all its forms everywhere
7
SDG 2
Zero Hunger
End hunger achieve food security and improved
nutrition and promote sustainable agriculture
8
SDG 3
Good health and well-being
Ensure healthy lives and promote well-being for all at
all ages
13
SDG 4
Quality education
Ensure inclusive and quality education for all and
promote lifelong learning
10

6
SDG 5
Gender equality
Achieve gender equality and empower all women and
girls
9
SDG 6
Clean water and sanitation
Ensure access to water and sanitation for all
8
SDG 7
Affordable and clean energy
Ensure access to affordable, reliable, sustainable and
modern energy for all
5
SDG 8
Decent work and economic
growth
Promote inclusive and sustainable economic growth,
employment and decent work for all
12
SDG 9
Industry, innovation and
infrastructure
Build resilient infrastructure, promote sustainable
industrialization and foster innovation
8
SDG 10
Reduced inequalities
Reduce inequality within and among countries
10
SDG 11
Sustainable cities and
communities
Make cities inclusive, safe, resilient and sustainable
10
SDG 12
Responsible consumption and
production
Ensure sustainable consumption and production
patterns
11
SDG 13
Climate action
Take urgent action to combat climate change and its
impacts
5
SDG 14
Life below water
Conserve and sustainably use the oceans, seas and
marine resources
10
SDG 15
Life on land
Sustainably manage forests, combat desertification,
halt and reverse land degradation, halt biodiversity
loss
12
SDG 16
Peace, justice and strong
institutions
Promote just, peaceful and inclusive societies
12
SDG 17
Partnerships for the goals
Revitalize the global partnership for sustainable
development
19
Source: https://www.un.org/sustainabledevelopment/sustainable-development-goals/
1.3 Fundamental assumptions
There are five fundamental assumptions underpinning the methodology and construction of the SDG Index and
Dashboards:
• Number of indicators evolves when new evidence become available: First, the authors of the report
acknowledge that the SDGs are part of a dynamic agenda including inside the statistical community.
Therefore, the basket of indicators evolves from year to another as new evidence become available. The
methodology for certain indicators is also revised based on efforts at the global level to improve the quality
of the measures to monitor the SDGs. This means that the SDG Index and Dashboards results are not
directly comparable from one year to another.

7
Table 2: Number of global indicators in the three SDG Index and Dashboards edition
2016
2017
2018
Number of
indicators
60
83
88
• The 17 SDGs are the final overarching framework (no re-clustering of the goals): Second, the SDG Index
and Dashboards uses the 17 SDGs as the final overarching conceptual framework. The report does not re-
organize goals into sub-categories such as the 5Ps (People, Planet, Prosperity, Peace and Partnership) or
between economic, social, environmental and governance related goals
1
. Beyond the fact that there are no
agreements on the re-clustering of these goals, the authors also argue that the SDGs are an overarching
framework that encourage policymakers to incorporate each dimension into the policymaking process for
each sector and not see these issues as independent issues to be addressed within each siloes. The report
uses expert judgement to deal with overlaps between goals.
• Non-official data help bridge current data gaps: Third, the report focuses on data available at the moment.
The authors consider that official indicators are not sufficient to monitor comprehensively the
implementation of the SDGs and that non-official data sources can help bridge this gap. Non-official data
sources include data produced in research institutions, Universities, civil society and other partners. They
sometimes use new data collection methods such as satellite imagery data and other forms of data. The
use of non-official datasets to measure some of the SDGs complements on-going efforts taking place in
international statistical committees to generate new standardized measures in NSOs to monitor the SDGs.
• Monitoring the SDGs requires estimating absolute country performance based on distance to invariant
sustainable development targets: The report focuses on absolute country performance (not relative to
other countries performance) and normalizes each indicator from 0-100 where 100 corresponds to
determined “technical optimums”. Therefore, the report measures what it aims to measure which is the
distance to achieving sustainability. The detailed method for calculating these technical optimums is
presented in section 1.6.
• Results need to be accessible for a wide audience: The SDG Index and Dashboards aims to strike a balance
between scientific soundness and easily communicable results accessible for a wide audience
(policymakers, civil society, layman citizens etc.). Therefore, as a general rule, when two methods yield
similar results the easier method was retained. The SDG Index and Dashboards result are accessible for free
online so that users can replicate the results. A number of sensitivity tests and robustness tests to various
methodological assumptions are presented in part 3 for transparency.
1.4 Selection of indicator
Where possible, the 2018 SDG Index and Dashboards reports official SDG indicators endorsed by the UN
Statistical Commission. Where insufficient data is available for an official indicator and to close data gaps, we
include other metrics from official and unofficial providers. Five criteria for indicator selection were used to
determine suitable metrics for inclusion in the global SDG Index and Dashboards:
1. Global relevance and applicability to a broad range of country settings: The indicators are relevant
for monitoring achievement of the SDGs and applicable to the entire continent. They are
1
Annex 7, explores statistical clustering of the SDGs based on the SDG Index and Dashboards Report 2018.

8
internationally comparable and allow for direct comparison of performance across countries. In
particular, they allow for the definition of quantitative performance thresholds that signify SDG
achievement.
2. Statistical adequacy: The indicators selected represent valid and reliable measures.
3. Timeliness: The indicators selected are up to date and published on a reasonably prompt schedule.
4. Data quality: Data series represent the best available measure for a specific issue, and derive from
official national or international sources (e.g. national statistical offices or international organizations)
or other reputable sources, such as peer-reviewed publications. No imputations of self-reported
national estimates are included.
5. Coverage: Data have to be available for at least 80% of the 149 UN Member States with a national
population greater than 1 million.
1.5 Interpreting the SDG Index and Dashboards results
1.5.1 The SDG Index
The global SDG Index score and scores by goal can be interpreted as the percentage of achievement. The difference
between 100 and countries’ scores is therefore the distance in percentage that needs to be completed to achieving
the SDGs and goals. Sweden’s overall Index score (85) suggest that the country is on average 85% of the way to the
best possible outcome across the 17 SDGs.
The same basket of indicators is used for all countries to generate comparable scores and rankings
2
. It should be
noted that differences in rankings may be due to small differences in the aggregate score. The SDG Index score
signifies a country’s position between the worst (0) and the best or target (100) outcomes.
1.5.2 The SDG Dashboards
To assess a country’s progress on a particular indicator, we considered four bands. The green band is bounded by
the maximum that can be achieved for each variable (i.e. the upper bound) and the threshold for achieving the
SDG. Three color bands ranging from yellow to orange and red denote an increasing distance from SDG
achievement. The red band is bound at the bottom by the value of the 2.5th percentile of the distribution. Upper
and lower bounds are the same as for the SDG Index.
Additional thresholds were established based on statistical techniques (typically using the mean and standard
deviations) and in consultation with experts. The country assessments were subject to a public consultation and
direct consultations with members of the Sustainable Development Solutions Network and other experts, including
national and international statistical offices. All thresholds were specified in absolute terms and apply to all
countries.
The purpose of the global SDG Dashboards is to highlight those SDGs that require particular attention in each
country and therefore should be prioritized for early action. For the design of the SDG Dashboards, the same issues
related to weighting and aggregation of indicators apply, as discussed above for the SDG Index.
2
The very few exceptions are presented in section 3.3.
9
Averaging across all indicators for an SDG might hide areas of policy concern if a country performs well on most
indicators but faces serious shortfalls on one or two metrics within the same SDG. This applies particularly to high-
income and upper-middle-income countries that have made significant progress on many SDG dimensions but may
face serious shortfalls on individual variables.
As a result, the global SDG Dashboards aggregate indicator ratings for each SDG by estimating the average of the
two variables on which a country performed worst. To this end, the indicator values were first rescaled from 0 to
3, where 0 corresponds to the lower bound, 1 to the value of the threshold between red and orange fired
threshold”), 2 to the value of the threshold between yellow and green figreen threshold”), and 3 to the upper
bound. For all indicators, the yellow/orange threshold was set as the value halfway between the red and green
thresholds (1.5). Each interval between 0 and 3 is continuous.
We then took the average of the two rescaled variables on which the country performed worst to identify the rating
for the goal. We applied the added rule that in order to score green for the goal both indicators had to be green –
otherwise the goal would be rated yellow. Similarly, a red score was applied only if both worst-performing
indicators score red. If the country has only one data point under the SDG then the color rating for that indicator
determines the overall rating for the goal. If the country has less than 50% of the indicators available under a goal
the dashboard color for that goal is “grey”.
1.5.3 The SDG Trend Dashboard
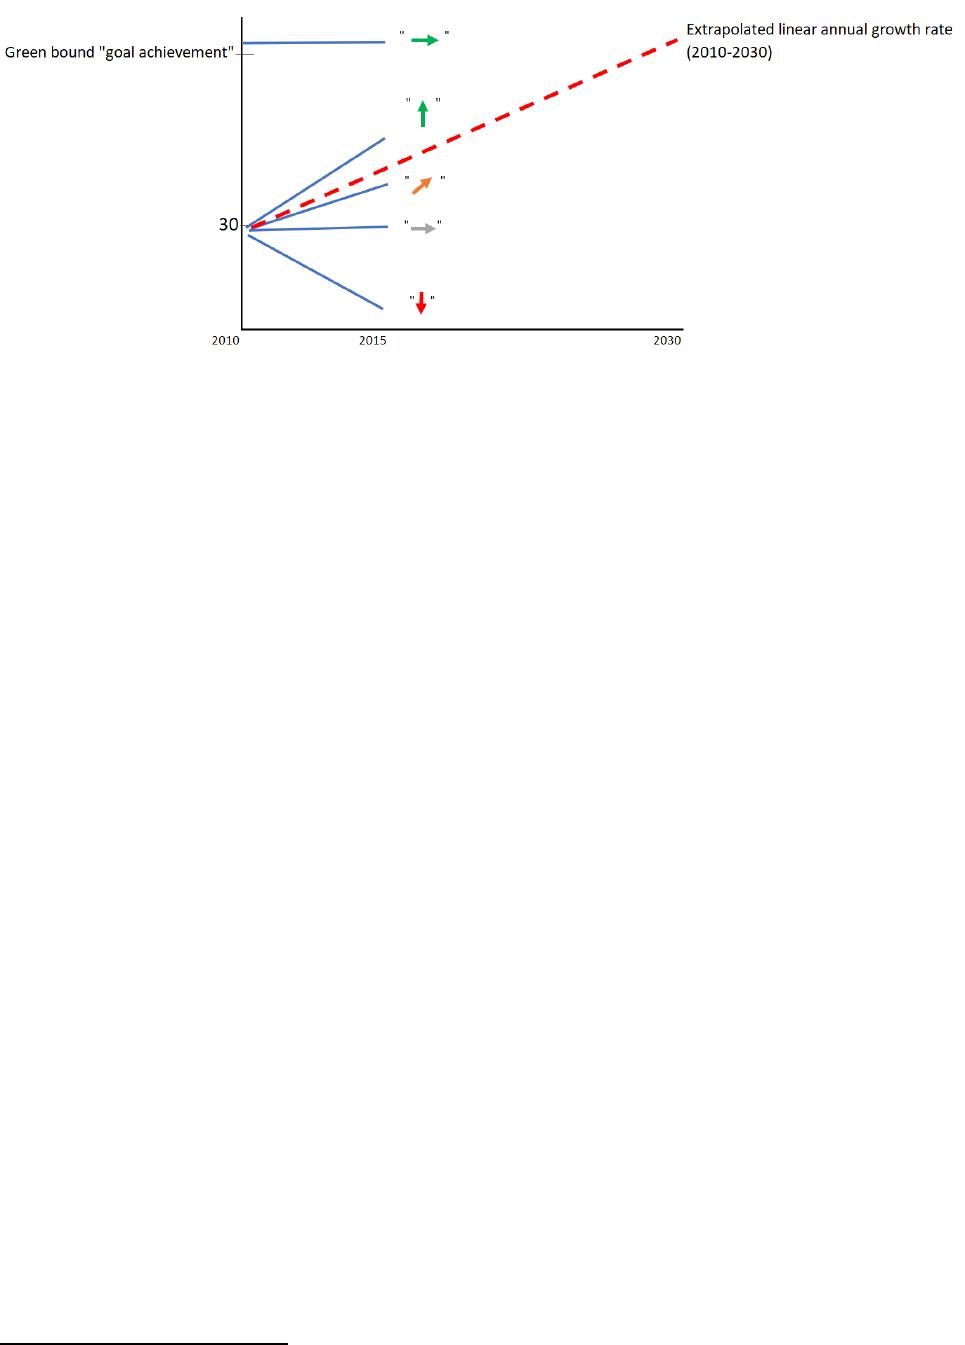
Using historic data, we estimate how fast a country has been progressing towards an SDG and determine whether
– if continued into the future – this pace will be sufficient to achieve the SDG by 2030. For each indicator, SDG
achievement is defined by the green threshold set for the SDG Dashboards. The difference in percentage points
between the green threshold and the normalized country score denotes the gap that must be closed to meet that
goal. To estimate SDG trend, we calculated the linear annual growth rates (i.e. annual percentage improvements)
needed to achieve the goal by 2030 (i.e. 2010-2030) which we compared to the average annual growth rate over
the most recent period (usually 2010-2015). Progress towards goal achievement on a particular indicator is
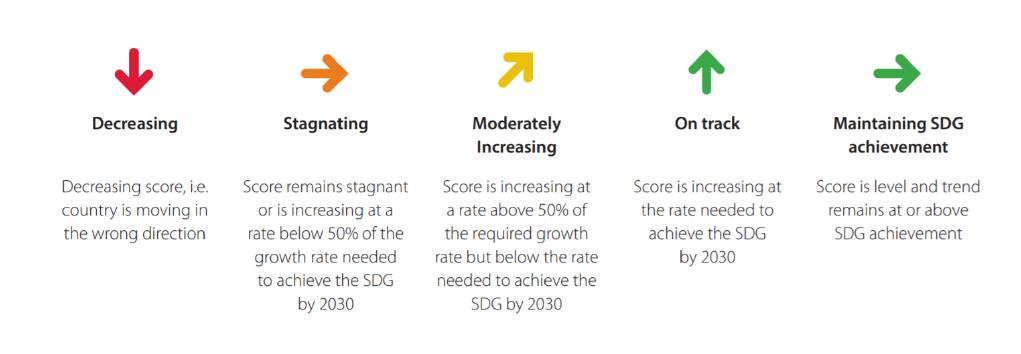
described using a 5-arrow system (Figure 1). Figure 2 illustrates the methodology graphically.
Figure 1: The 5-arrow system for denoting SDG Trends
Source: Authors’ analysis
10
Figure 2: Graphic representation of the SDG Trends methodology
Source: Authors’ analysis
To estimate overall trend for an SDG, each indicator trend for that SDG was re-normalized on a linear scale from 0-
4. The trend for an SDG was calculated as the arithmetic average of all trend indicators for that goal. An average
between 0-1 corresponds to a “decreasing” goal trend, between 1–2 to a “stagnating” goal trend, 2–3 “moderately
improving goal trend”, 3–4 “on track” goal trend. Maintaining SDG achievement corresponds to a normalized score
of exactly 3. Trends are reported at the SDG level only if trend data were available for at least 75% of SDG
Dashboards indicators under that goal.
SDG trends are based on data points that precede the adoption of SDGs, because data is reported with long lags at
the international level due to lengthy validation processes. Over time, we will update the data to use 2015 as
baseline year for SDG Trends.
Annex 1, provides the list of indicators used to compute SDG trends. Trend indicators were selected from among
the indicators included in the SDG Dashboards based on the availability of trend data. When the value for one year
was not available we used the closest available value with a maximum of one-year difference. The table also
indicates the period over which the trend was calculated.
Several other calculation methods were considered. For instance, we tested the sensitivity of the results when using
technical optimums (100 score) as “goal achievement” and calculate distance to technical optimums. This approach
yielded harsher results and is not consistent with our conceptual assumption that lower green thresholds
correspond to goal achievement. We also considered using compound annual growth rates (CAGR) instead of linear
growth rates. The two approaches yield rather similar results and we could not identify a strong argument for using
the more sophisticated CAGR method. Finally, while the dashboards are based only on the two-worst indicators
trends are generated using all indicators under the goal. This is because the dashboards aim to highlight goals where
particular attention is required due to very poor performance on some of the underlying indicators whereas trends
aim to reflect insights on the overall goal evolution including all indicators.
1.6 Setting indicator targets
For each indicators, sustainability “targets” (also called “technical optimums” or “upper bounds”) were
determined using a five-step decision tree
3
:
3
Based on Sachs and al, 2017.
11
1. Use absolute quantitative thresholds in SDGs and targets: e.g. zero poverty, universal school completion,
universal access to water and sanitation, full gender equality. Some SDG Targets propose relative changes
(Target 3.4: […] reduce by one third premature mortality from non-communicable diseases [..]) that
cannot be translated into a global baseline today. Such targets are addressed through step 5 below.
2. Where no explicit SDG target is available, apply the principle of “leave no one behind” to set upper
bound to universal access or zero deprivation for the following types of indicators:
a. Measures of extreme poverty (e.g. wasting), consistent with the SDG ambition to end extreme
poverty in all its forms fileave no one behind”).
b. Public service coverage (e.g. access to contraception).
c. Access to basic infrastructure (e.g. mobile phone coverage, wastewater treatment).
3. Where science-based targets exist that must be achieved by 2030 or later, use these to set 100% upper
bound (e.g. zero greenhouse gas emissions from electricity as required by no later than 2070 to stay
within 2°C, 100% sustainable management of fisheries).
4. Where several countries already exceed an SDG target, use the average of the top 5 performers (e.g.
child mortality).
5. For all other indicators, use the average of the top performers. In the case of global indicators retained,
the upper bound was set by taking the average value of the top 5 global performers. For OECD indicators,
the average top 3 performers.
In some cases, the upper bound exceeded the thresholds to be met by 2030 in order to achieve the SDGs. For
example, the SDGs call for reducing child mortality to no more than 25 per 1000 live births, but many countries
have already exceeded this threshold (i.e. have mortality rates under 25 per 1000). By defining the upper bound as
the “best” outcome (e.g. 0 mortality per 1000) – not the SDG achievement threshold – the SDG Index rewards
improvements across the full distribution. This is particularly important for countries that have already achieved
some SDG thresholds, but still lag behind other countries on this metric.
Overall, only 12% of the targets assigned in the 2018 SDG Index and Dashboards Report are designed based on
explicit targets specified in the SDGs. The rest are designed by using the average of top 5 performers (44%), using
technical optimums (e.g. 0 imported CO2 emissions) (26%) and using Leave no one behind criteria (universal access
to safe water and sanitation) (19%). Annex 4 provides detailed targets for each indicators.
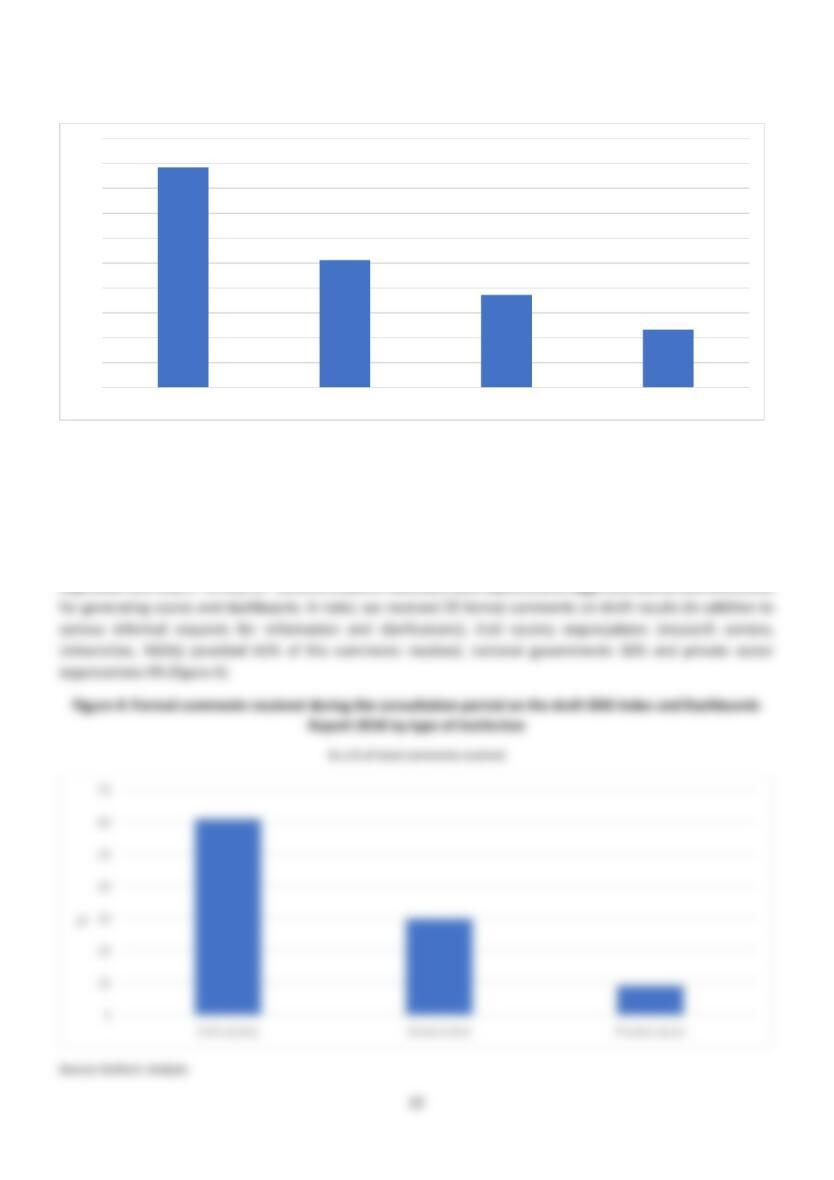
Figure 3: Rationale used to define targets for global indicators, 2018
Source: Authors’ analysis
1.7 Collaboration with experts
As a global network of experts on the SDGs, SDSN consults extensively with a wide range of stakeholders at various
stages of the production process of the SDG Index and Dashboards Report. Experts are consulted on an on-going
basis in early stages to identify new indicators and data. These include primarily international institutions (World
Bank, OECD, WHO, ILO etc.), civil society organizations, and research institutions. A large-scale consultation was
0%
5%
10%
15%
20%
25%
30%
35%
40%
45%
50%
Average top 5 performers Technical optimums Leave no one behind SDG Target