1. Identify the bottleneck resource(s) for process A and determine the capacity of this process.
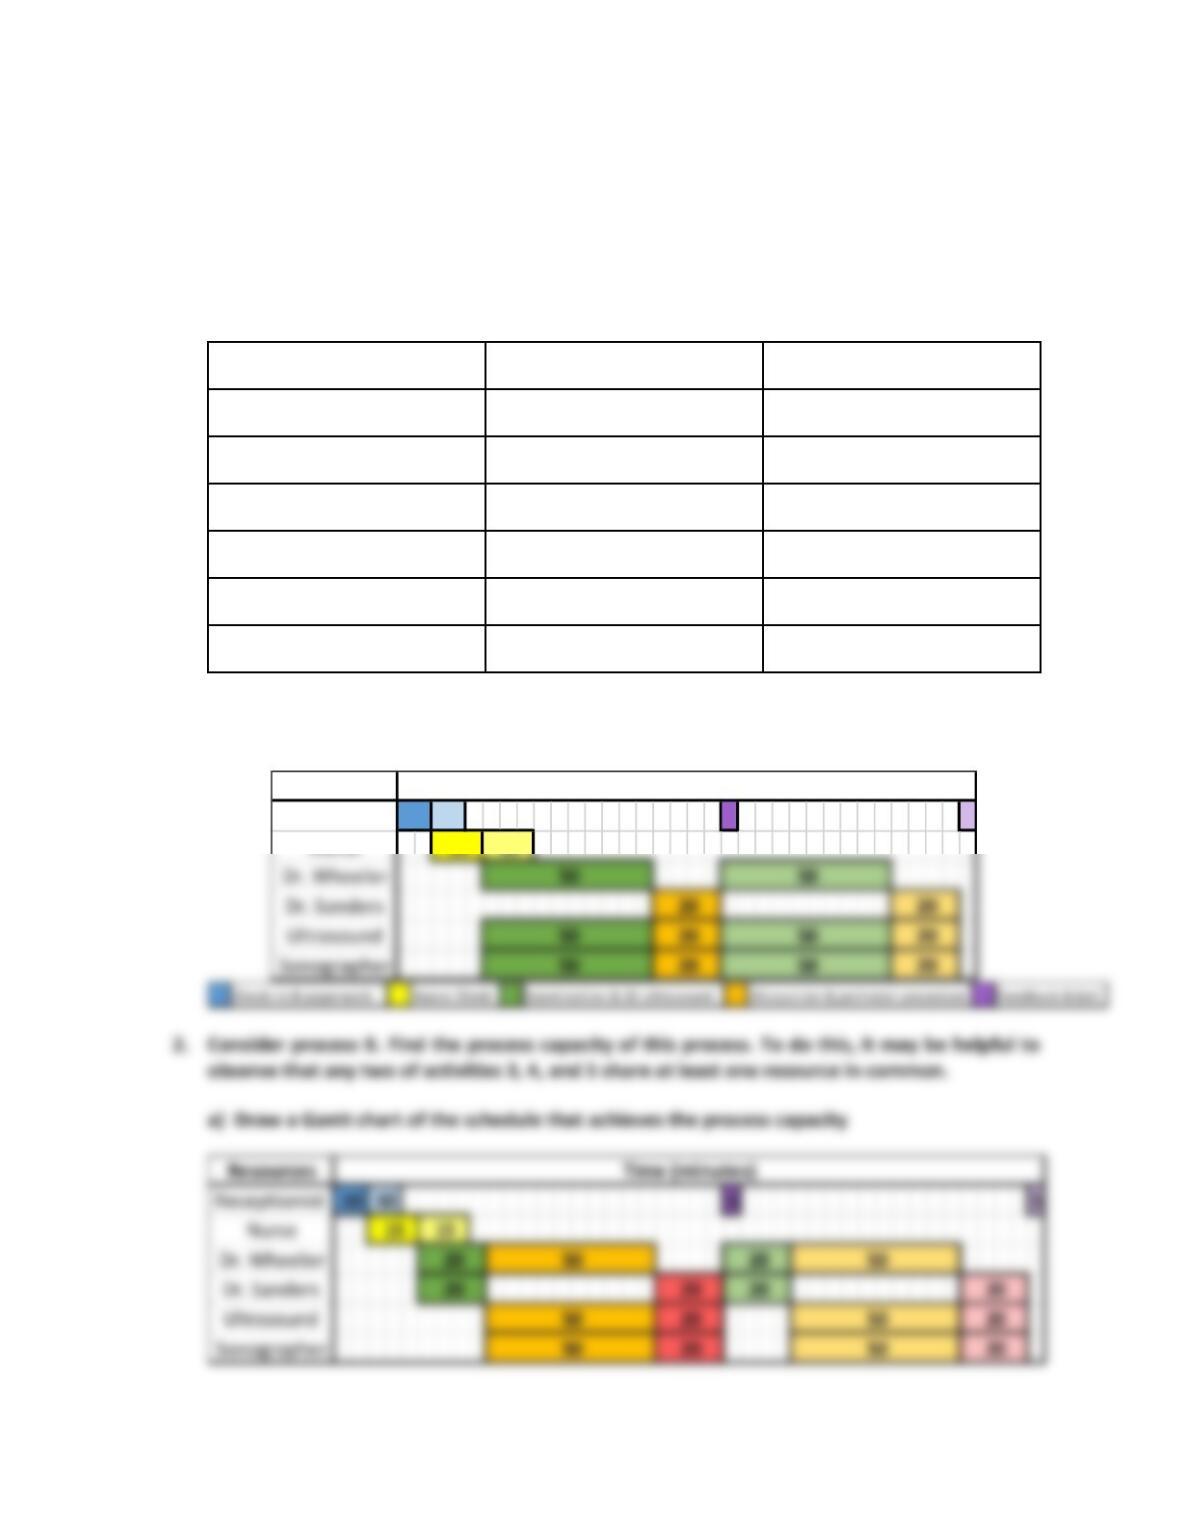
Draw a Gantt chart to illustrate the schedule that achieves the process capacity.
* For the Gantt charts, each activity has a defined color and the lighter tones ones belong to a
second person that enter the process.
Resources
Unit Load (min/unit)
Capacity Rate (per hour)
Dr. Wheeler
50
1.2
Dr. Sanders
20
3
Sonographer
50+20=70
0.86
Ultrasound Equipment
50+20=70
0.86
Nurse Practitioner
15
4
Receptionist
10+5=15
4
The bottleneck resources are the Sonographer and the Ultrasound Equipment because they
have the lowest capacity rate of 0.86 per hour in the process.
Resources
Receptionist 5 5
10
10
Time (minutes)