MAT$113$ FINAL$EXAM$ May$5,$2020$
1
SHOW%ALL%YOUR%WORK%
Question%1%
%
Part$I$
%
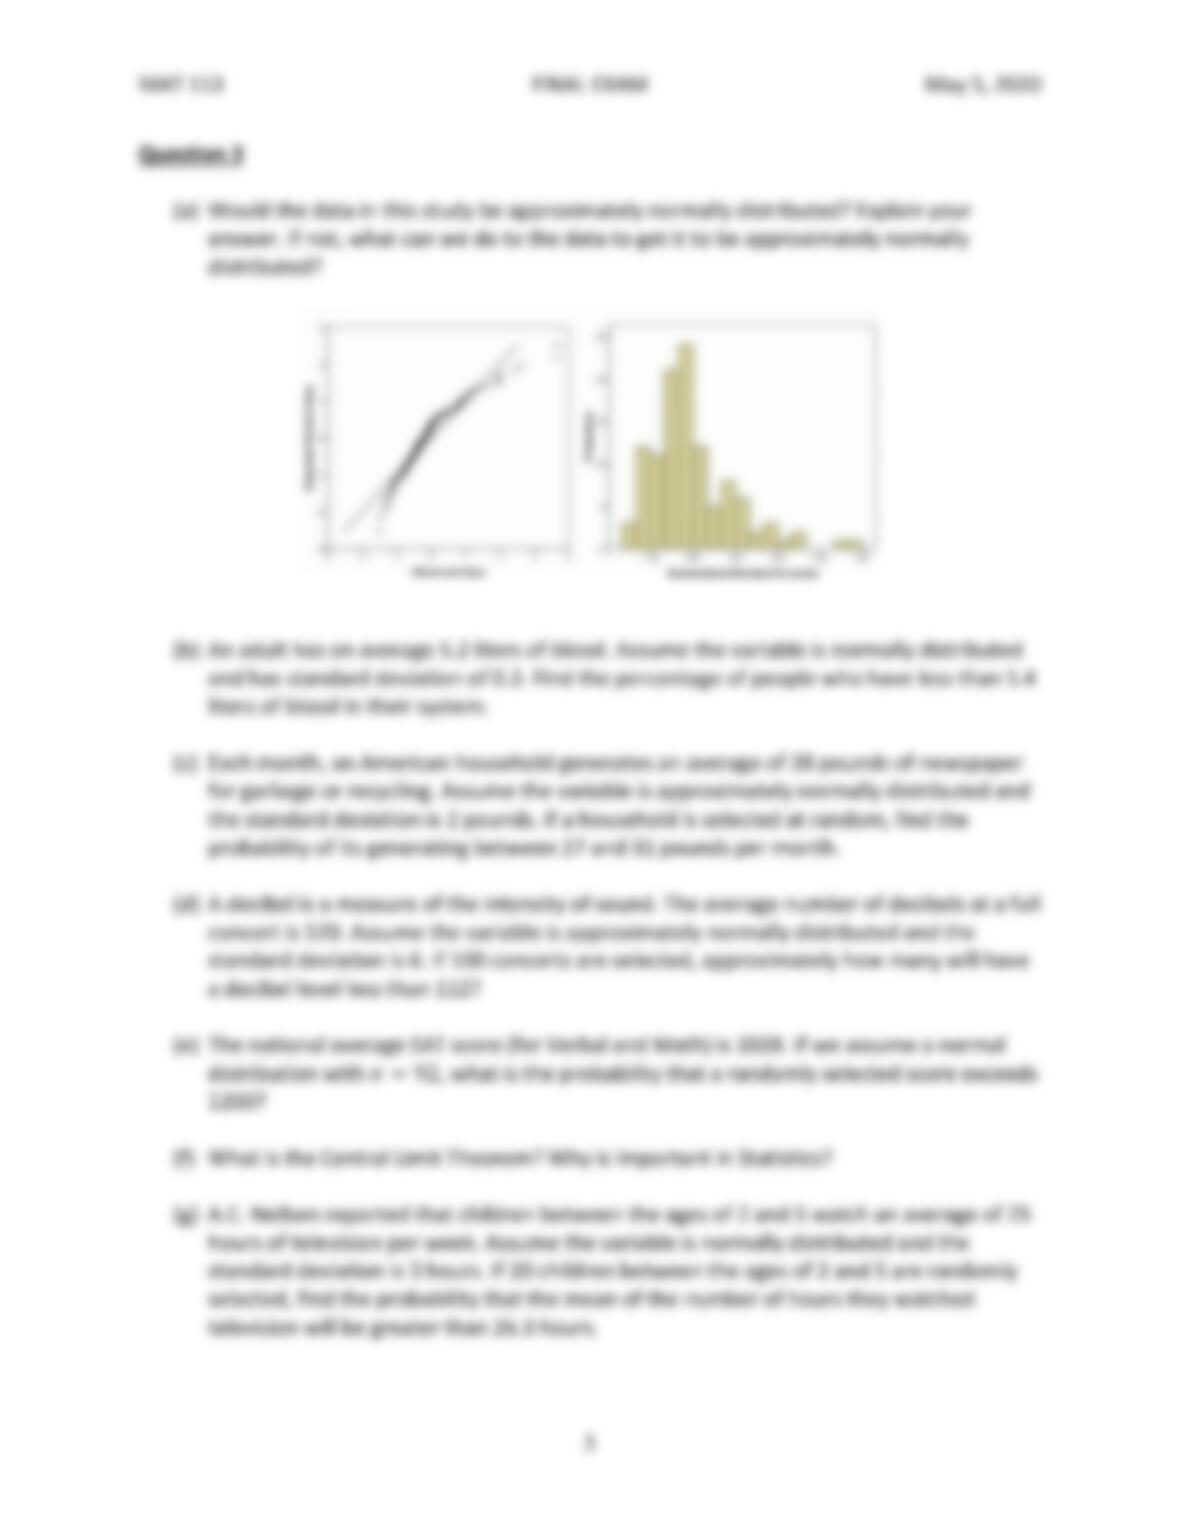
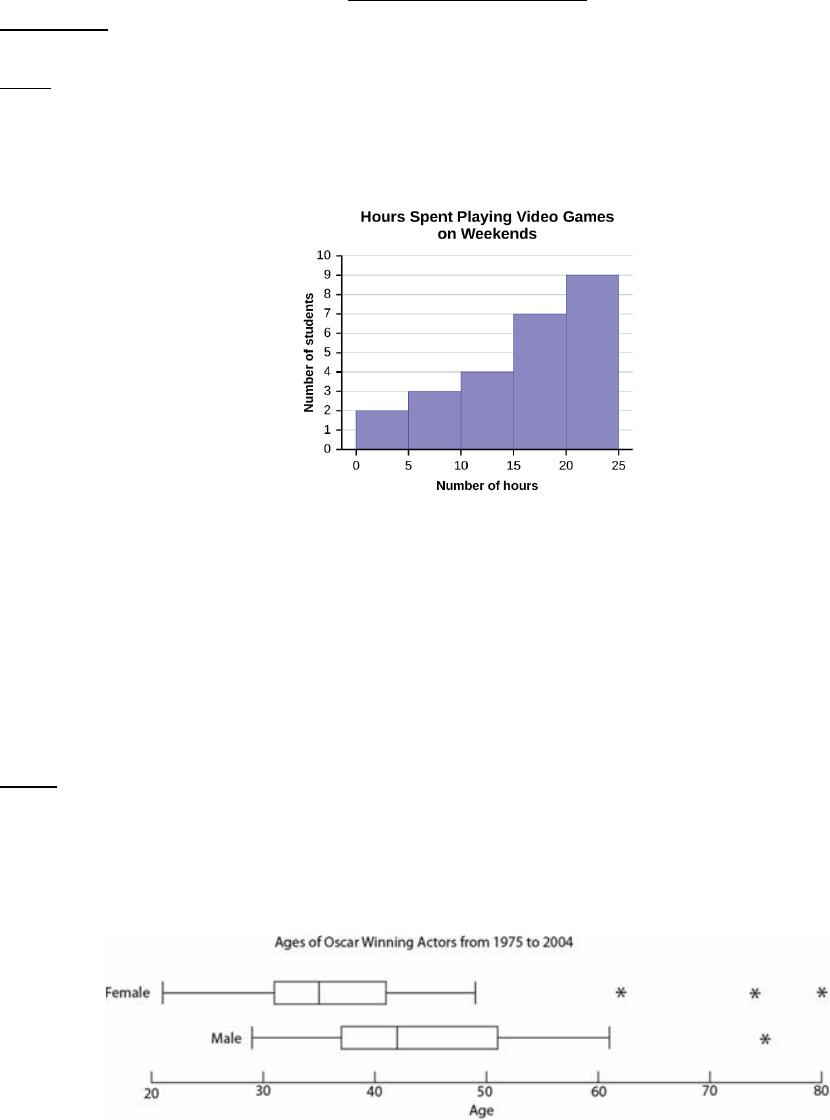
The$following$histogram$gives$the$distribution$of$the$amount$of$time$spent$playing$video$games$
on$weekends$in$hours$for$a$sample$of$students.$$
$
%
(a) What$is$the$approximate$shape$of$the$distribution?$
$
(b) Based$on$the$histogram,$what$conclusions$can$be$determined$in$context$of$the$study.$$%
%
(c) Based$on$the$histogram$is$the$mean$greater$than,$less$than$or$equal$to$the$median?$Can$
we$compute$the$mean,$median$and$standard$deviation$using$the$graph$above?$Why$or$
why$not?$
%
Part$II$
%
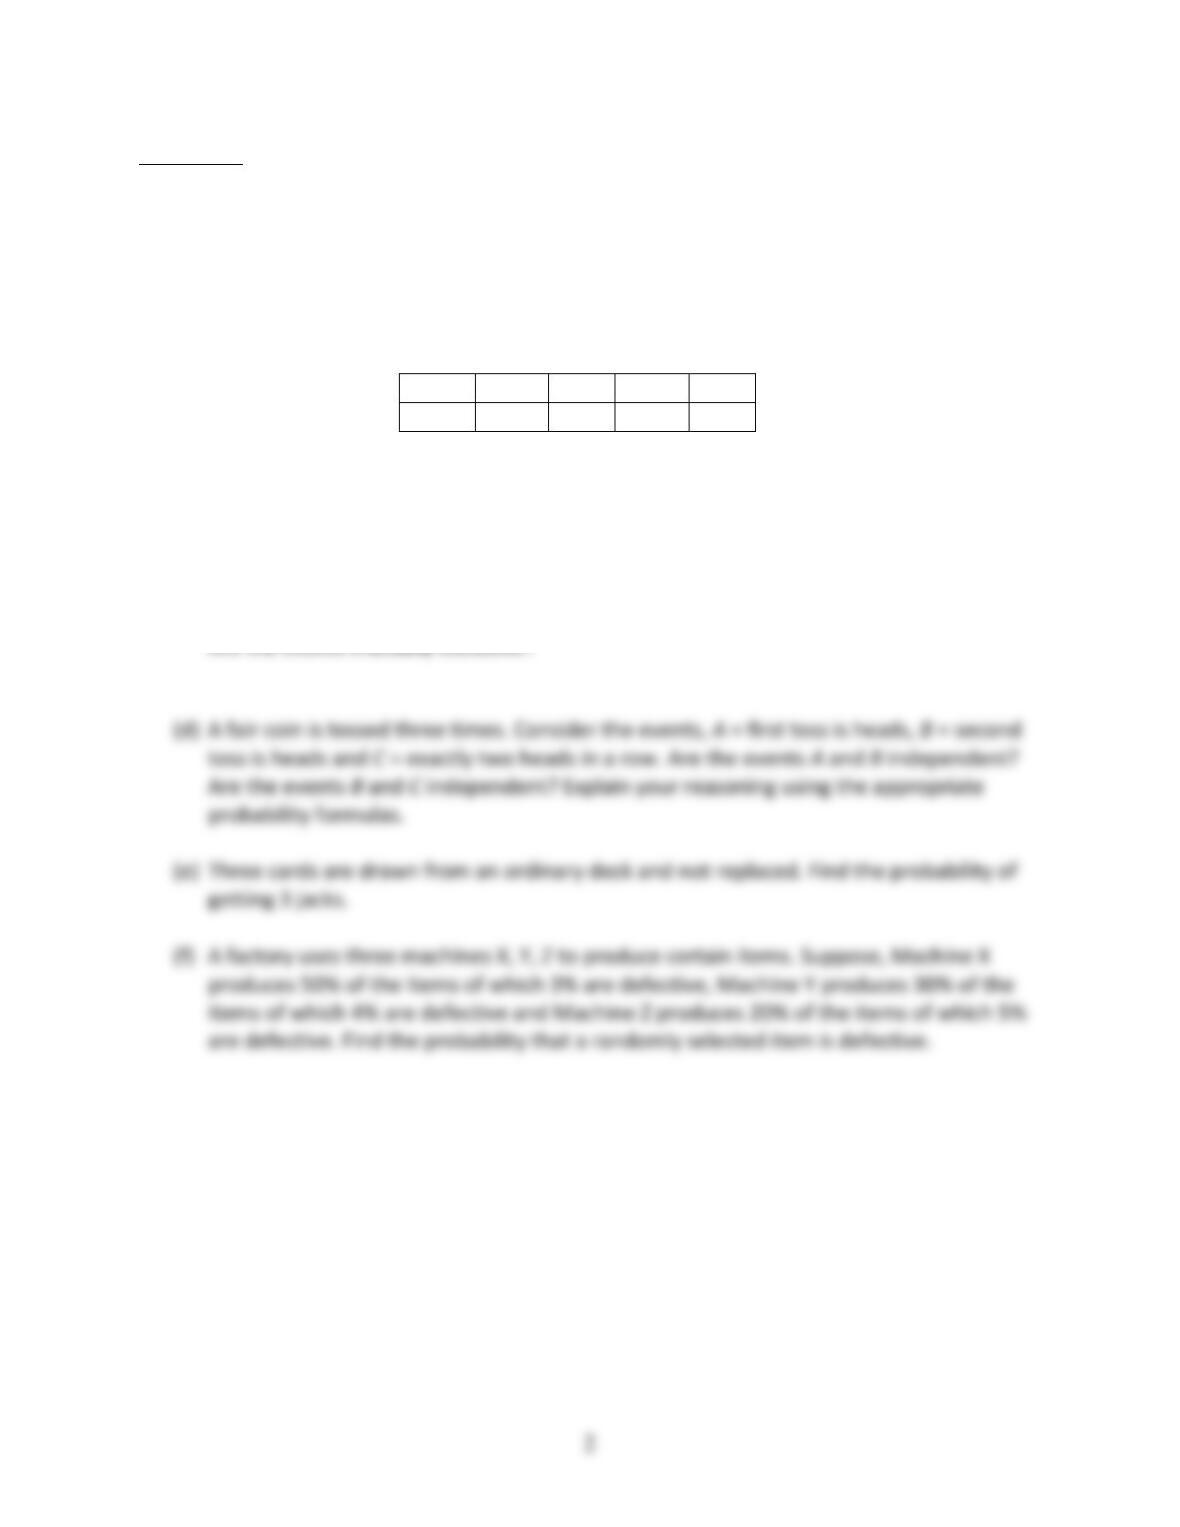
A$recent$study$was$conducted$to$compare$the$age$distributions$of$actors$and$actresses$who$
won$best$acting$Oscars$from$1975$to$2004.$A$random$sample$was$taken$from$each$gender.$The$
two$boxplots$are$shown$below$to$summarize$these$results.$$
%
$
(a) Are$ there$ any$ outliers$ of$ the$ two$ distributions$ shown$ on$ the$ boxplots?$ Explain$ your$
answer.$$
$
(b) Compare$the$two$distributions.$Describe$your$comparisons$in$the$context$of$the$study.$
MAT$113$ FINAL$EXAM$ May$5,$2020$
Question%2%
%
(a) A$missile$guidance$system$has$5$fail-safe$components.$The$probability$of$each$failing$is$
0.05.$Find$the$probability$that$exactly$two$will$fail.$$$
$
(b) Let$ the$ distribution$ of$ a$ discrete$ random$ variable$ X$ be$ described$ as$ follows;$ where$ X$
represents$the$number$of$seeds$in$a$randomly$selected$Muscat$grape.$
$
X$
0$
1$
2$
3$
p(X)$
0.125$
0.25$
0.375$
0.25$
$$
Find$the$mean$and$variance$of$X.$
$
$
(c) In$the$United$States,$there$are$59$different$species$of$mammals$that$are$endangered.$75$
different$species$of$birds$that$are$endangered,$and$68$species$of$fish$are$endangered.$If$
one$animal$is$elected$at$random,$find$the$probability$that$it$is$either$a$mammal$or$a$fish.$