Expected Return: E(R)
The expected return from investing in a security over some future holding period is an estimate of
the future outcome of this security.
Although the Expected Return is an estimate of an investor’s expectations of the future,
it can be estimated using either ex ante (forward looking) or ex post (historical) data.
If the expected return is equal to or greater than the required return, purchase the
security.
Regardless of how the individual returns are calculated, the Expected Return of a
Portfolio is the weighted sum of the individual returns from the securities making up the
portfolio:
N
n
nnP REwRE
1
)()(
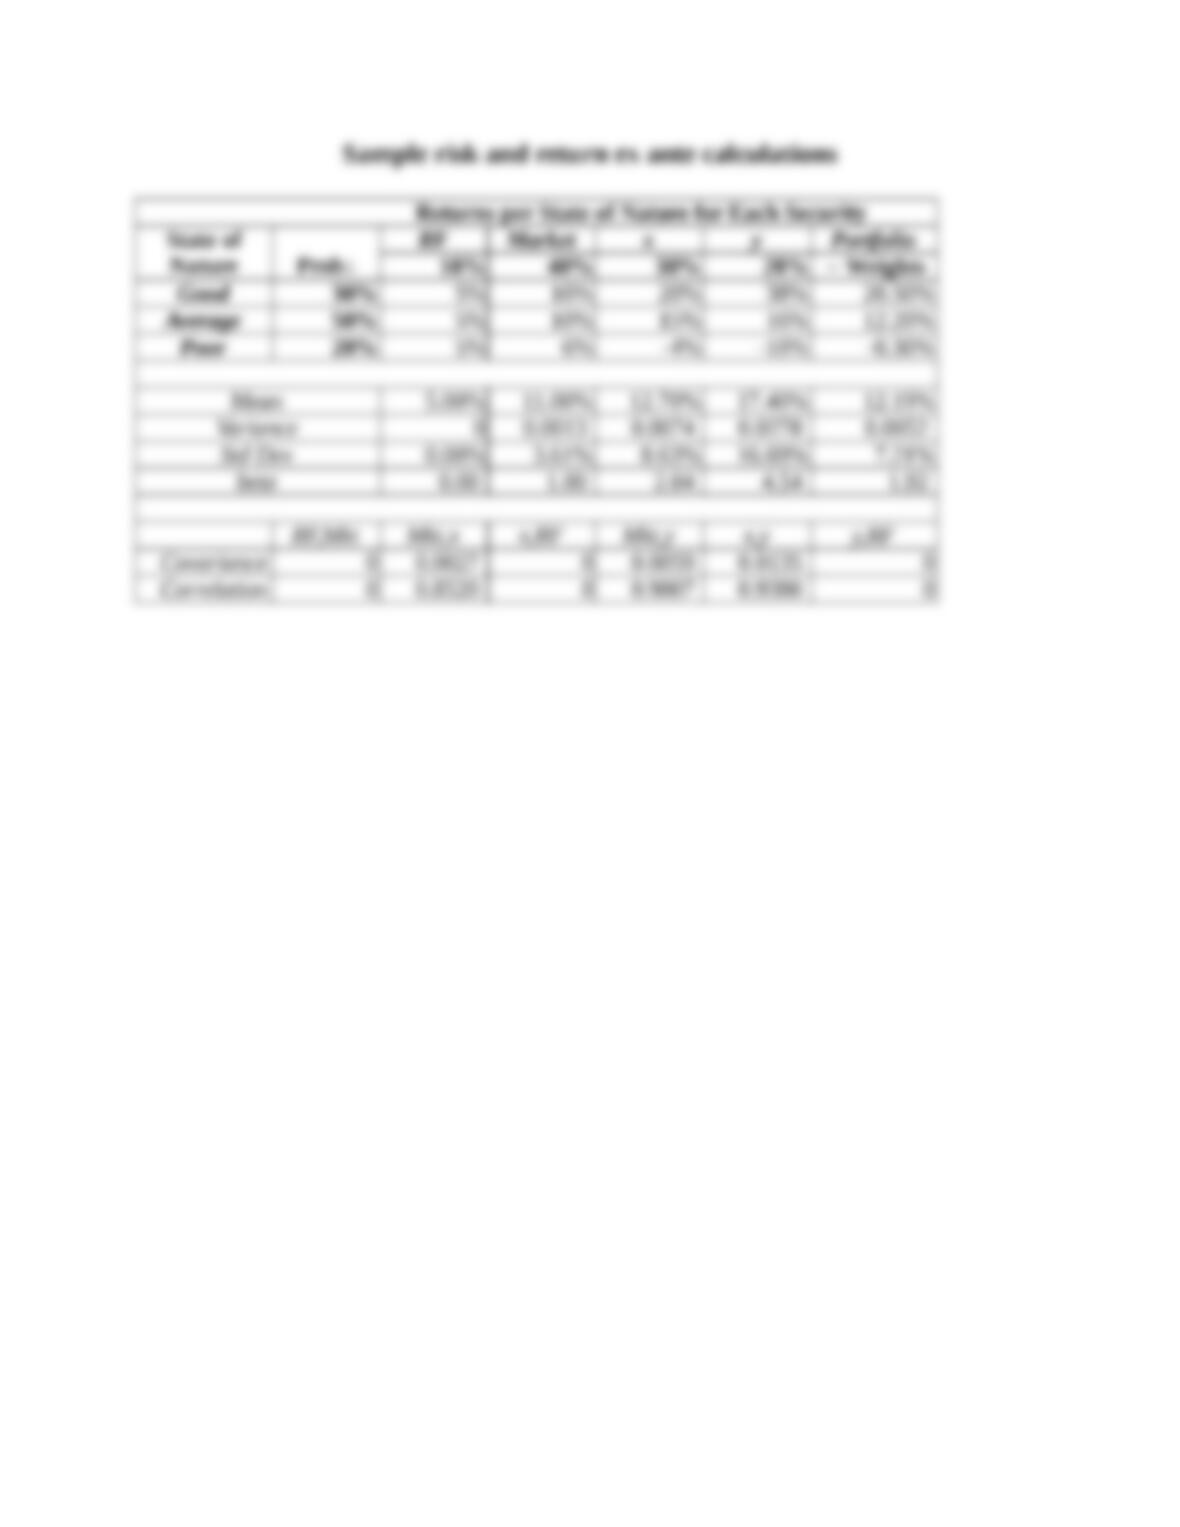
Ex ante expected return calculations are based on probabilities of the future states of nature and
the expected return in each state of nature. Sum over all states of nature, the product of the
probability of a state of nature and the return projected in that state.
State PsRsPs * Rs
Good 30% 20% 0.3(0.2)
Average 50% 15% +0.5(0.15)
Poor 20% -4% +0.2(-0.04)
S
s
ss RPRE
1
)(
12.70%
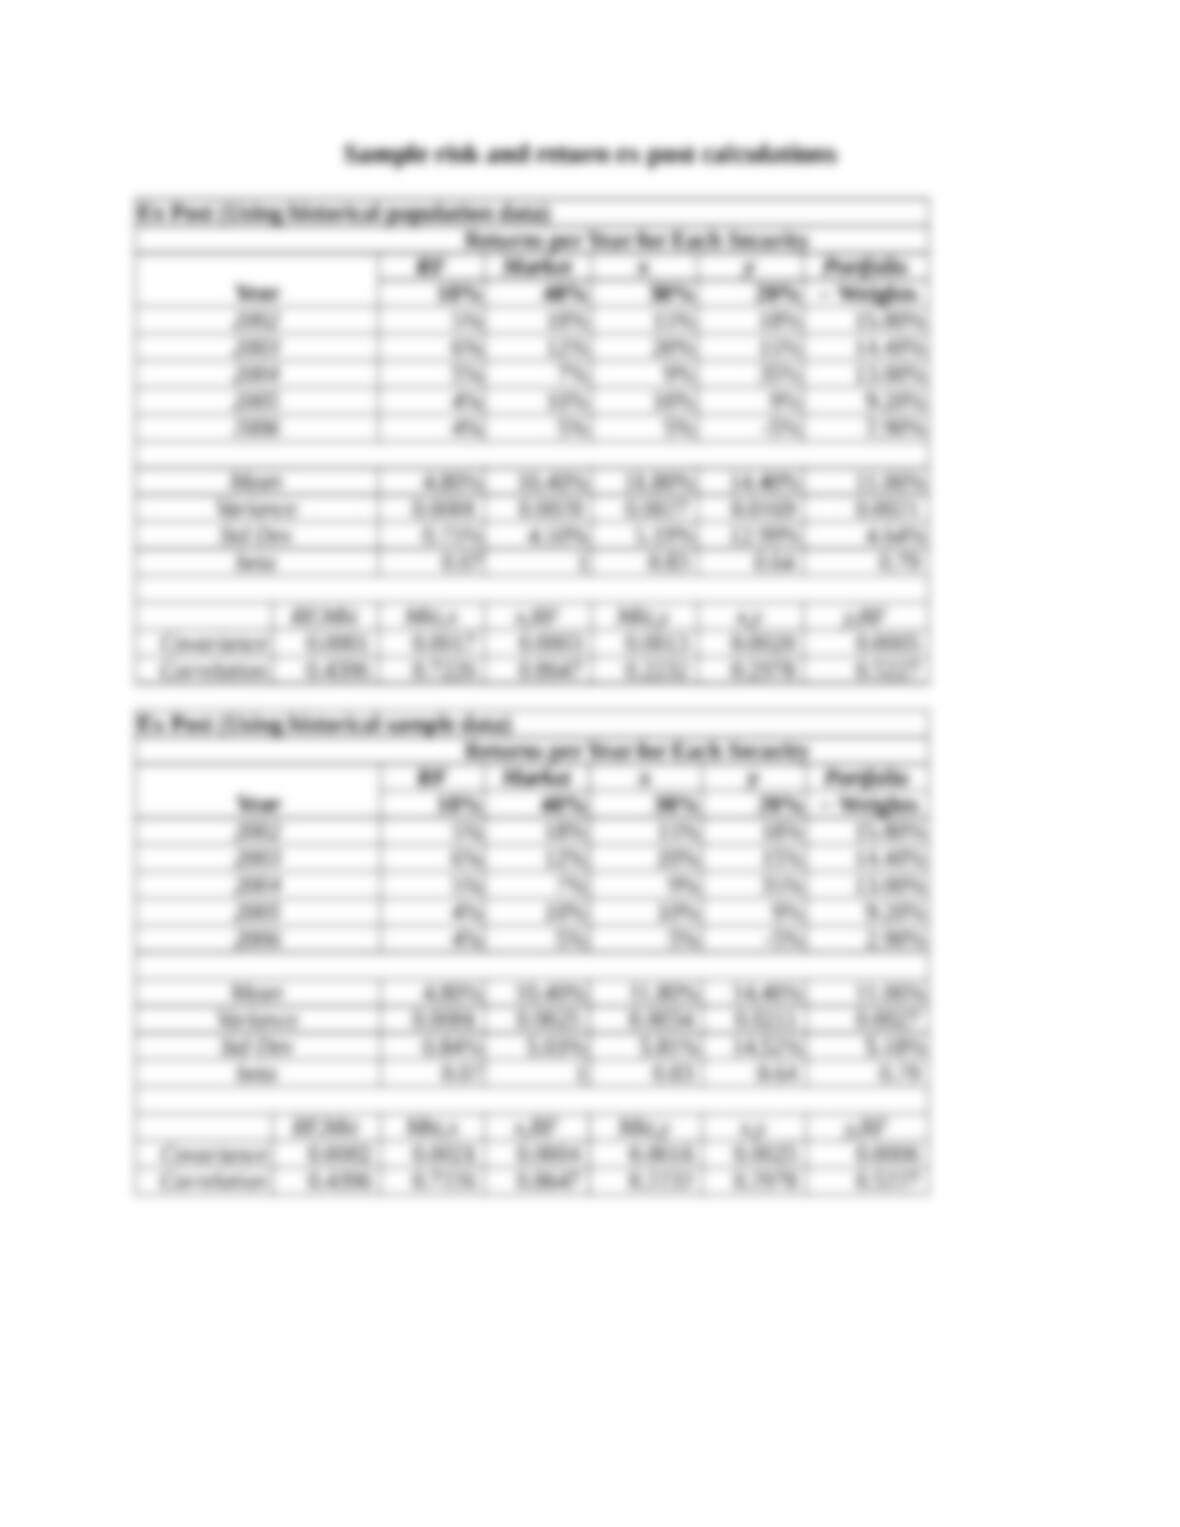
Ex post expected return calculations are based on historical data. Add the historical returns and
then divide by the number of observations.
Year Rt
2002 15%
2003 20%
2004 9%
2005 10%
2006 5%
TRRE
T
t
t
1
)(
11.80%

Variance (Standard Deviation): σ2 (σ)
Variance is a measure of the dispersion in outcomes around the expected value. It is used as an
indication of the risk inherent in the security. Standard deviation is the square root of variance.
Ex ante variance calculation:
1. The expected return is subtracted from the return within each state of nature; this
difference is then squared.
2. Each squared difference is multiplied by the probability of the state of nature.
3. These weighted squared terms are then summed together.
State PsRsPs * Rs(Rs – E(R))2 * Ps
Good 30% 20% 0.3(0.2) 0.3(0.2-0.127)2
Average 50% 15% +0.5(0.15) +0.5(0.15-0.127)2
Poor 20% -4% +0.2(-0.04) +0.2(-0.04-0.127)2
12.70% 0.0074 8.63%
Mean Variance Standard
Deviation
S
s
ss PRER
1
22 )]([
2
Ex post variance calculation:
1. The average return is subtracted from each single period return; this difference is then
squared.
2. The squared differences are summed.
3. This sum is divided by the number of periods (using population data) or the number of
periods minus 1 (using sample data).
Year Rt(Rt – E(R))2(Rt – E(R))2
2002 15% (0.15-0.118)2(0.15-0.118)2
2003 20% (0.2-0.118)2(0.2-0.118)2
2004 9% (0.09-0.118)2(0.09-0.118)2
2005 10% (0.1-0.118)2(0.1-0.118)2
2006 5% (0.05-0.118)2(0.05-0.118)2
= Sum/5 =Sum/5 =Sum/4
11.80% 0.0027 0.0034
Mean Population
Variance
Sample
Variance
5.19% 5.81%
Population
Std Dev
Sample
Std Dev
Population
data
)())(( 2
1
2TRER
T
t
t
Sample
data
)1())(( 2
1
2
TRER
T
t
t

Variance of a Portfolio: σp
Ex ante variance of a portfolio if portfolio returns for each state of nature and probabilities of
the states of nature are known:
P P s P P s
s
S
R E R P
2 2
1
[ ( )]
, ,
Ex post variance of a portfolio if portfolio returns for each historical time period are known:
)())(( 2
1
,
2TRER
T
t
PtPP
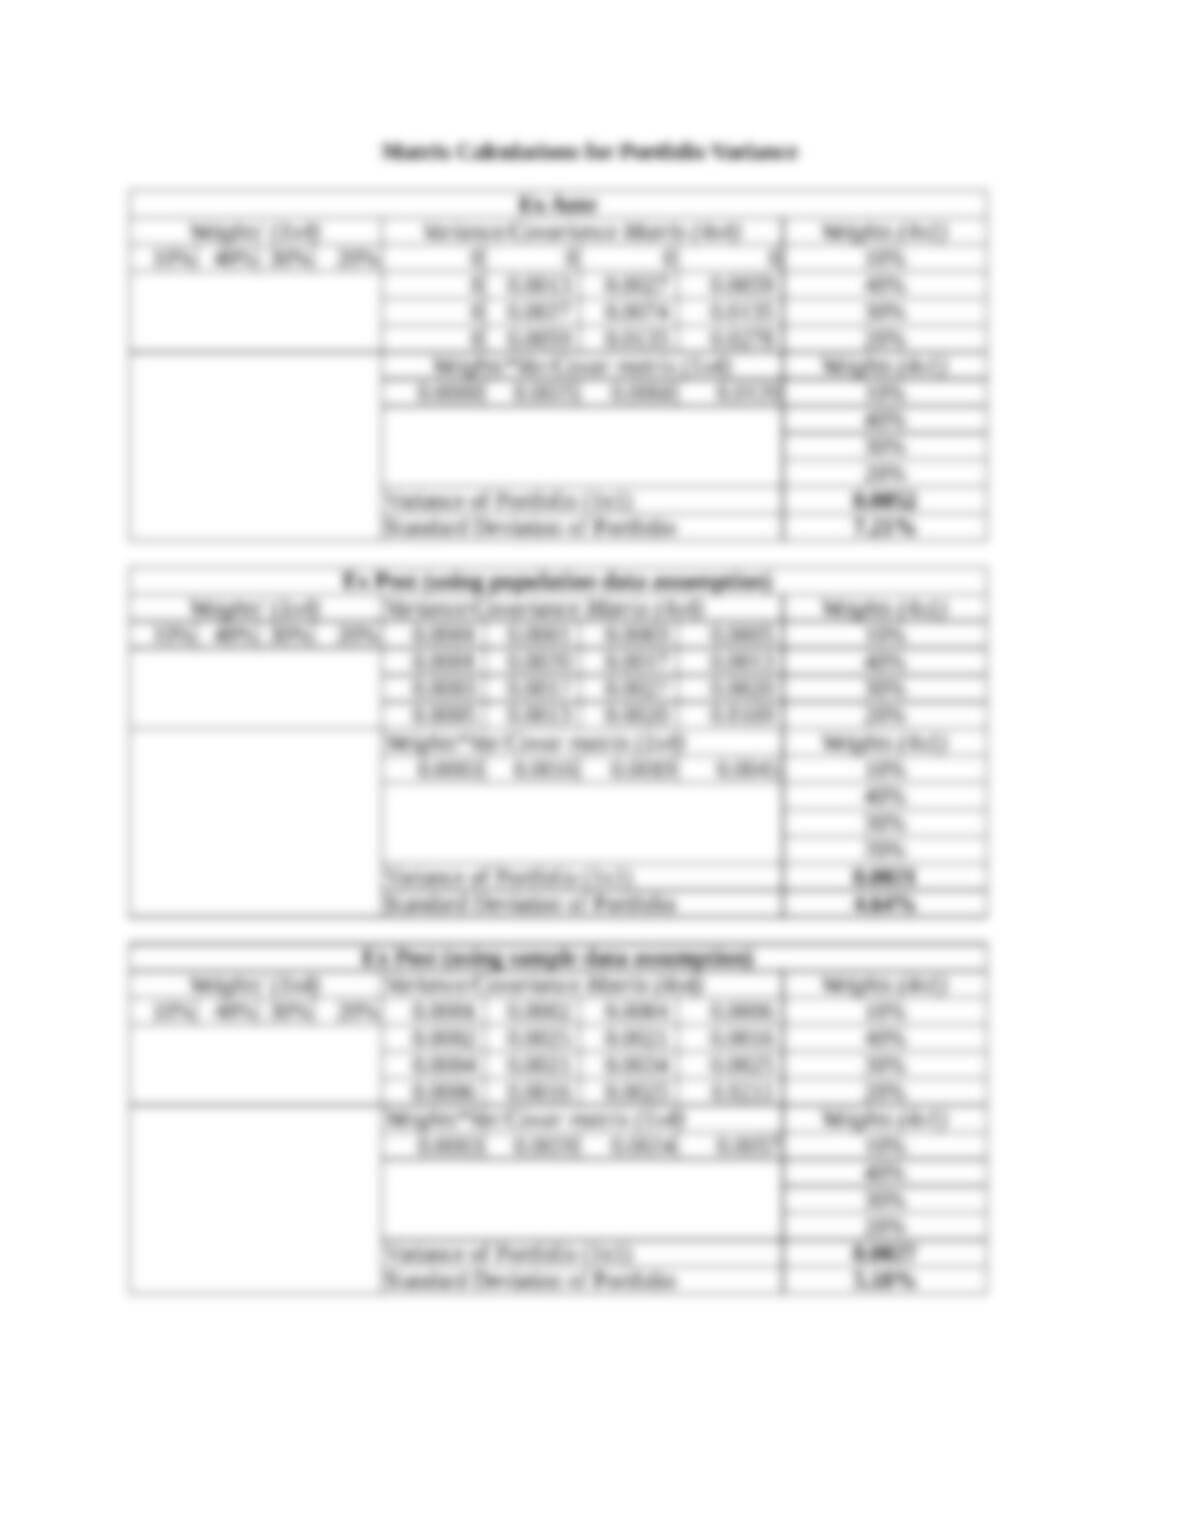
The variance of a portfolio (ex ante or ex post) can be calculated using the weights and
covariances of the assets making up the portfolio:
P j k
k
N
j
N
j k
w w
2
11
kj
N
j
N
jkk
kj
N
j
jjP www
1 ,11
222
For a 2 asset portfolio the formula simplifies to:
P A A A B A A A B
w w w w
2 2 2 2 2
1 2 1 ( ) ( ) ,
The variance of a portfolio is not equal to the weighted sum of the individual asset
variances unless all the assets are perfectly positively correlated with each other.
2
1
2
i
N
i
iP w

Covariance: σij
Covariance is an absolute measure of the extent to which two variables tend to covary or move
together.
Correlation Coefficient: ρij
The correlation coefficient is a standardized statistical measure of the extent to which two
variables are associated ranging from perfect positive correlation (i,j = +1.0) to perfect negative
correlation (i,j = –1.0).
Ex ante
State PSRX,S RY,S PS * (RX,S – E(RS)) * (RY,S – E(RS))
Good 30% 20% 38% 0.3(0.2-0.127)(0.38-0.174)
Average 50% 15% 16% +0.5(0.15-0.127)(0.16-0.174)
Poor 20% -4% -10% +0.2(-0.04-0.127)(-0.1-0.174)
Mean 12.70% 17.40%
Variance 0.0074 0.0278
Std Dev 8.63% 16.69%
Covariance 0.0135
Correlation 0.9380
S
s
jsjisisji RERRERP
1
))(())((
ji
ji
ji
Ex post
Year RX,t RY,t (RX,t – E(RX)) (RY,t – E(RY))
2002 15% 18% (0.15-0.118)(0.18-0.144)
2003 20% 15% (0.2-0.118)(0.15-0.144)
2004 9% 35% (0.09-0.118)(0.35-0.144)