Prediction for Graduate Rates Aury Medina BADM 7020 – Spring 2020 Assignment No. 5 04/12/2020
Business Understanding:
In this report we are finding different variables that affect the
graduation rates in the nation. The main problem United States
has faced in these recent years regarding education is the low
graduation rates from universities and continuing education
institutions. There are many factors that are affecting the low
rates college graduates, a few of them being finances,
residential circumstances, and academic focus of the students.
This has become a big problem in which four-year university
institutions are having a difficult time in retaining their
students in the goal of ultimately graduating. The main
objective in this research will be to try and find between the
variables provided the main affects of the dropping rates
increase in university students not graduating college. We will
mainly look at the students living on and off campus and the
effects it may have on graduation rates.
Data Understanding and Preparation:
In order to prepare for this analysis, the JMP data has to be
reviewed in order to discover any outliers, missing data, and
necessary binning. The variable of Race was binned while
others were left alone. The binning for Race was done by the
text groups since it doesn’t have values to bin. All other
variables were included, and no missing data was found as
well as no outliers. The fit model was performed in order to
determine the statistically significant data analysis.
Afterwards, a final column was created split into using a
random 70% training and 30% validation. This will allow us
to perform our prediction portion of our analysis.
Analysis
Explanation:
In the following analysis, we were able to use the variables of
GRAB-BUS5 as (Y) and OnCampus as the independent
When looking at the prediction analysis, we are going ahead
and using those variables with validation. The validation will
provide us a certainty to a prediction in graduation rates for off
and on campus students. This will use hold out samples that
will allow to test the model and provide us with measurements
in a confusion matrix as well as lift curve and ROC curve.
This analysis may allow for universities to provide pre-college
analysis on upcoming students in order to keep track and in
contact with those students in the not graduating rates.
Confusion Matrix:
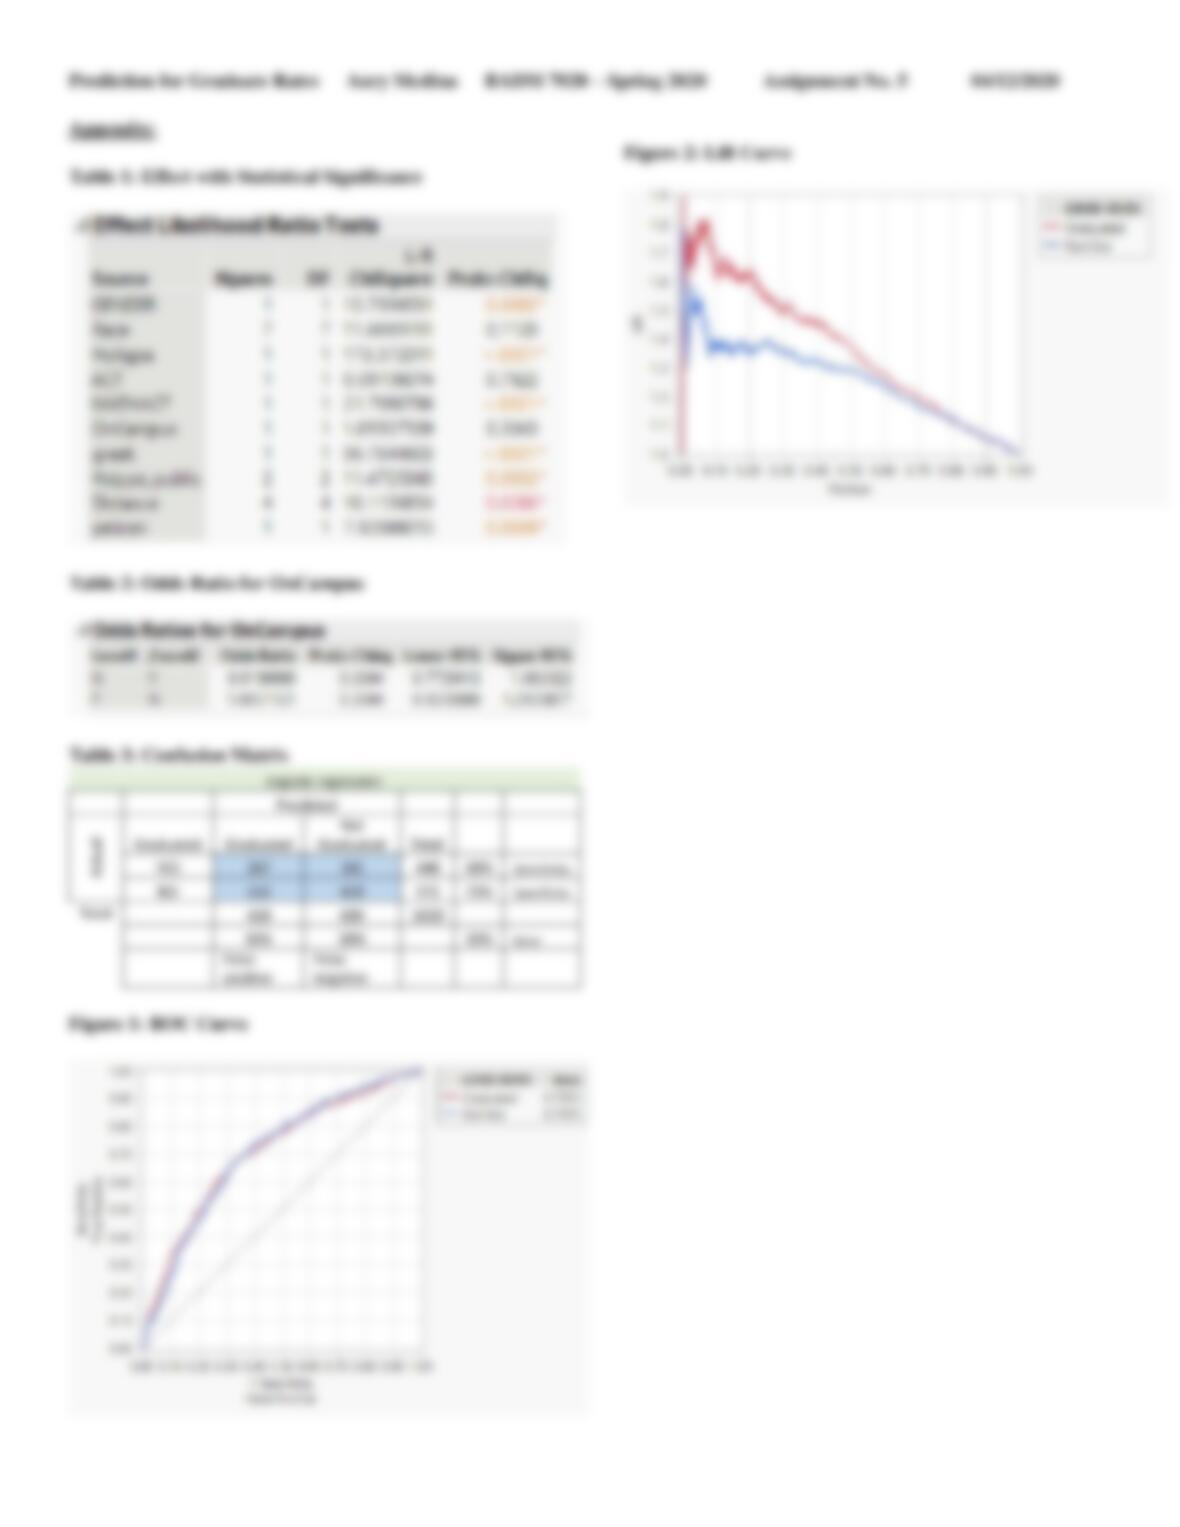
The validation set results provided in the Confusion matrix,
shown in Table 3, gave us the measuring factors needed for
the prediction which include, error, false positive rate, false
negative rate, sensitivity, specificity, and overall error.
Reviewing the results, it has acknowledged that the overall
error rate is at 33%. The graduated cases were correctly
classified at 60%, also defined in the table as sensitivity. As
for the not graduated cases were at 73% as the specificity. The
false positive shown as 36% and the false negative rate of
30%. The false positive would be defined as the Yes
predictions and the false negatives would be the No
predictions. The model ultimately resulted in more not
graduated cases versus the graduated cases.
ROC Curve:
In Figure 1, we’re able to analyze the ROC curve and see that
the two different models based on Graduated and Not
Graduated are significantly close. We can see that the AUC is
at 0.7072 and that the Graduated ROC is closer to 1 when
starting but falls slightly lower when crossing the sensitivity at
0.70. The Not Graduated ROC starts off below 1 and fall more
to the left after 0.70 in the sensitivity, while it starts to change
at 0.40 in the specificity.