Quiz
Note: It is recommended that you save your response as you complete each question.
Question 1 (1 point)
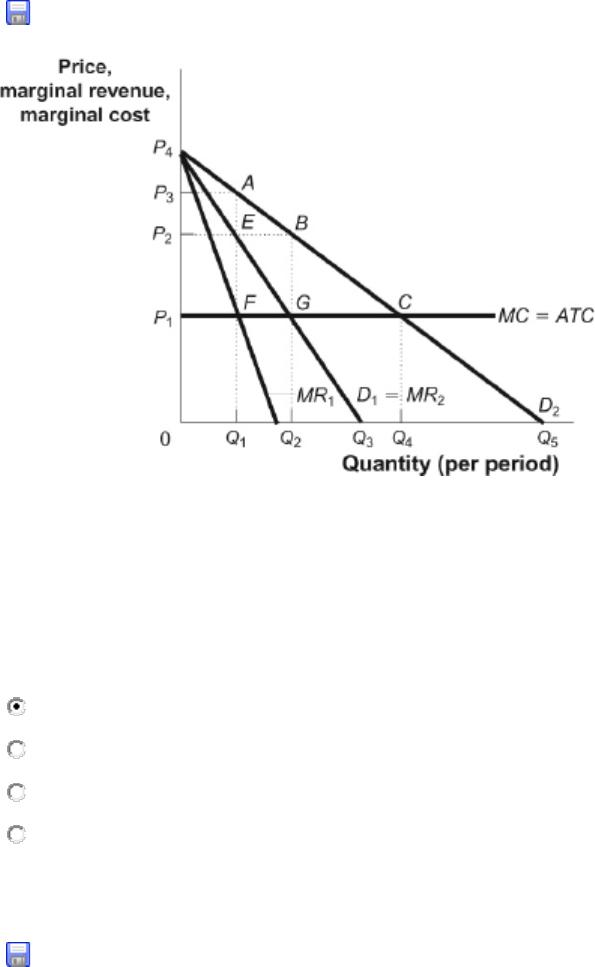
Figure: Monopoly Profits in Duopoly
Reference: Ref 31-2
(Figure: Monopoly Profits in Duopoly) Examine the figure Monopoly Profits in Duopoly. The
figure illustrates the situation in which an industry consisting of two firms that face identical
demand curves (D1) can collude to increase profits. The market demand curve is D2. Which
assumption is part of the analysis illustrated by the model?
Question 1 options:
a)
The firms can act as a cartel and maximize their combined economic profit.
b)
The two firms have identical marginal cost but different average total cost.
c)
The MR curve is not relevant to either firm’s choices.
d)
The two firms sell differentiated products.
Question 2 (1 point)
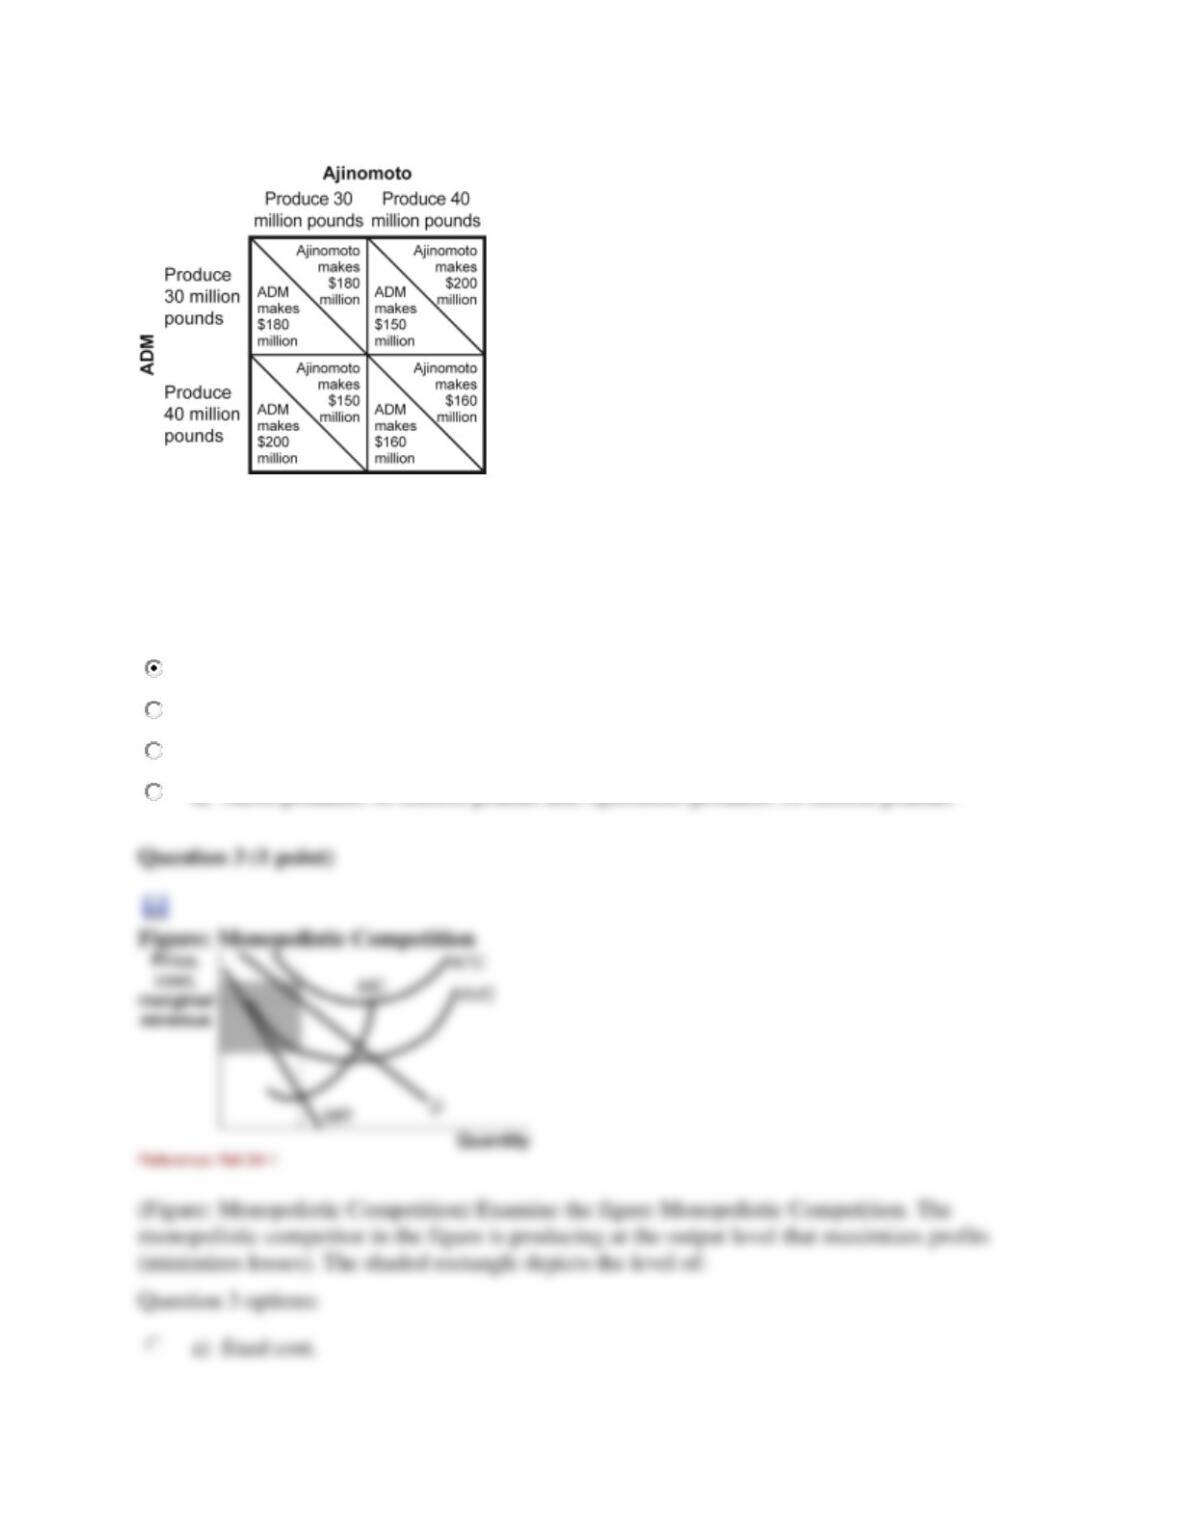
Figure: Payoff Matrix for Ajinomoto and ADM
Reference: Ref 32-2
(Figure: Payoff Matrix for Ajinomoto and ADM) Examine the figure Payoff Matrix for
Ajinomoto and ADM. Given the payoff matrix in the figure, the optimal combination for
maximum combined profit occurs when:
Question 2 options:
a)
each firm produces 30 million pounds.
b)
ADM produces 30 million pounds and Ajinomoto produces 40 million pounds.
c)
each firm produces 40 million pounds.
d)
ADM produces 40 million pounds and Ajinomoto produces 30 million pounds.
a)
fixed cost.